A Frayed and Fragmented System of Supports for Low-Income Adults Without Minor Children
Table of Contents
Overview: Current System Leaves Great Unmet Need, Lifts Few Out of Poverty
SNAP Restricts Nutrition Assistance for Low-Income Non-Elderly Adults Not Living With Minor Children
State General Assistance Programs Provide Cash Aid to Few Low-Income Adults
Overview: Current System Leaves Great Unmet Need, Lifts Few Out of Poverty
By Joseph Llobrera and Lauren Hall
Over 100 million people — about a third of the country’s population — are non-elderly adults who don’t have minor children in the family[1] and don’t have severe disabilities. More than 1 in 8 of these adults are in poverty.[2]
Our system of economic and health supports — such as Medicaid, the Supplemental Nutrition Assistance Program (SNAP), and refundable tax credits — is geared largely toward helping children and their parents, people with disabilities, and the elderly. The nation’s basic supports for low-income, non-elderly adults without children, particularly for those who do not meet a rigorous disability standard, are weak, fragmented, and often highly restrictive, leaving many of these individuals without help they need to afford the basics. These adults need stronger supports to help meet essential needs, a problem that the hardships inflicted by the COVID-19 pandemic have magnified.
Compared to the larger population of non-elderly adults, low-income non-elderly adults are more likely to be young, have lower educational attainment, or have a disability that may not be severe enough to qualify for Supplemental Security Income (SSI) or Social Security Disability Insurance (SSDI) but nonetheless prevents or limits work. Due to systemic racism and other factors that have resulted in fewer educational and employment opportunities, non-elderly adults who identify as Black or Latino are more likely to have low incomes.
Most of these adults who are able to work do so, but they often hold jobs with greater turnover and volatility that don’t pay high enough wages to enable these adults to meet basic needs such as adequate, nutritious food and safe, stable housing. Often these jobs also do not provide benefits like employer-based health insurance.
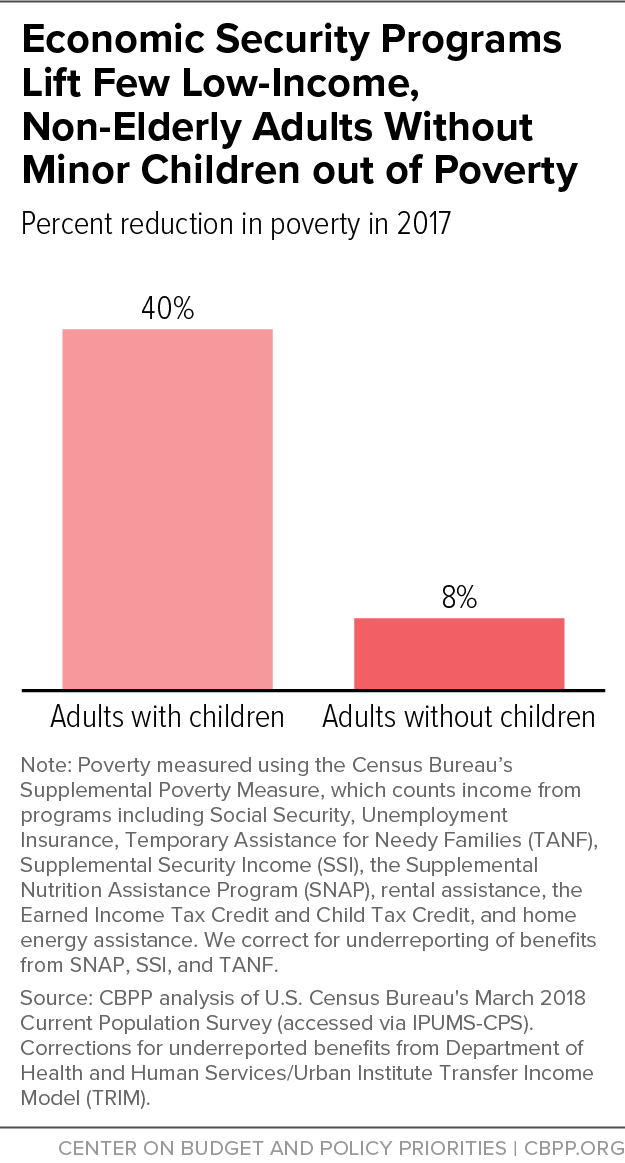
The nation’s system of economic and health supports often leaves these adults unassisted or aided to only a small degree. While the current system of economic security programs reduces the number of non-elderly adults with minor children in poverty by 40 percent by lifting their family incomes above the poverty line, these programs reduce poverty by only 8 percent for non-elderly adults without minor children. (See Figure 1.)
- Low-income, non-elderly adults not living with a minor child are more likely to lack health insurance (29 percent) than those living with children (24 percent).[3] This problem is most severe in the 14 states that haven’t implemented the Affordable Care Act’s (ACA) Medicaid expansion, where these adults are ineligible for health insurance through Medicaid (unless they have a serious disability).
- One in ten households without minor children experienced food insecurity in 2019. For the subset of this group that consists of low-income, non-elderly adults who aren’t living with minor children and don’t have a disability, food assistance is available through SNAP for only three months out of every 36 while they aren’t employed or participating in a work or training program at least half time, unless they live in an area temporarily exempt from this restriction because of elevated unemployment.
- Some 9.3 million non-elderly adults not living with minor children both meet the eligibility criteria for federal rental assistance and pay more than half of their income for rent, but only 1.9 million of them — 1 in 5 — receive any such assistance. Housing assistance is very constrained due to funding limitations, resulting in large unmet need.
- Workers without minor children are the only demographic group that contains people whom the federal tax system taxes into, or deeper into, poverty. That’s in part because they are eligible only for a tiny Earned Income Tax Credit (EITC) that is too small to offset the federal taxes (primarily payroll taxes) they owe, or are eligible for no EITC at all.
- Only about half of the states have General Assistance programs that provide basic cash aid to very poor people without minor children in the home, and fewer than half of those states provide any such benefits to people who don’t have a disability or other specified barrier to employment.
Many non-elderly adults without children have disabilities or illnesses that make working difficult. Most federal programs that provide benefits to individuals with disabilities, however — such as SSI and SSDI — generally provide benefits only to individuals with severe and long-lasting impairments. Many people with work-limiting impairments are ineligible for disability benefits despite being out of work or able to work only modest amounts.
The federal government has left it up to states to decide whether to provide any cash assistance to low-income, non-elderly adults without children who don’t meet the disability standard for SSI and SSDI. If states do provide such help, it’s entirely up to them to decide how much to provide and under what conditions. Most states have never provided substantial support for this group. Moreover, income support for these individuals has weakened substantially over the past 30 years and continues to erode.
The COVID-19 pandemic and the economic hardship it has caused have further exposed critical gaps in America’s system of economic and health supports. Low-income, non-elderly adults without children have been particularly hard hit, due to their low incomes and disproportionate employment in low-paid industries that have experienced larger job losses. In addition, Black, Latino, and Indigenous people as well as immigrants have been affected disproportionately by both the health crisis and its economic fallout.[4] With millions of people unemployed or facing substantial income losses during the COVID-19 economic downturn, the lack of stronger economic and health supports for this group is having a particularly acute impact.
Who Are the Low-Income, Non-Elderly Adults Without Children?
In 2017, there were over 100 million 18- to 64-year-old adults in the United States without children in the family who didn’t receive Social Security or SSI.[5] One in five had income below 200 percent of the official poverty line (about $25,500 annually for a single individual in 2017); 1 in 10 lived below 100 percent of the official poverty line (about $12,800 annually for a single individual in 2017).[6]
Using the Census Bureau’s Supplemental Poverty Measure (SPM), 13.1 percent of non-elderly adults without children lived in poverty in 2017 after accounting for government benefits and certain expenses (such as out-of-pocket medical expenses).[7] This group is more likely to experience poverty than are non-elderly adults with children, whose poverty rate under the SPM was 10.9 percent in 2017.[8] The SPM poverty rate among children, themselves, was 13.6 percent.
The slightly higher poverty rate for children than for non-elderly adults without children in part reflects the smaller family sizes for the latter group. The income level that puts families of one or two members above the SPM poverty line is low ($13,400 for a single individual) compared to the corresponding level for a larger family with children (the SPM poverty line for a family of four is $28,900).[9] Supports for low-income, non-elderly adults without minor children are much less effective at lifting those adults above the poverty line than are the supports available to families with children.
The population of low-income, non-elderly adults without children or disabilities is a dynamic one: employment status and economic status for any individual may change over time. In addition, disability may be short term or longer lasting and may vary in severity over time. And whether the adult has a child in their home may change as they or a child joins or moves out of a home.
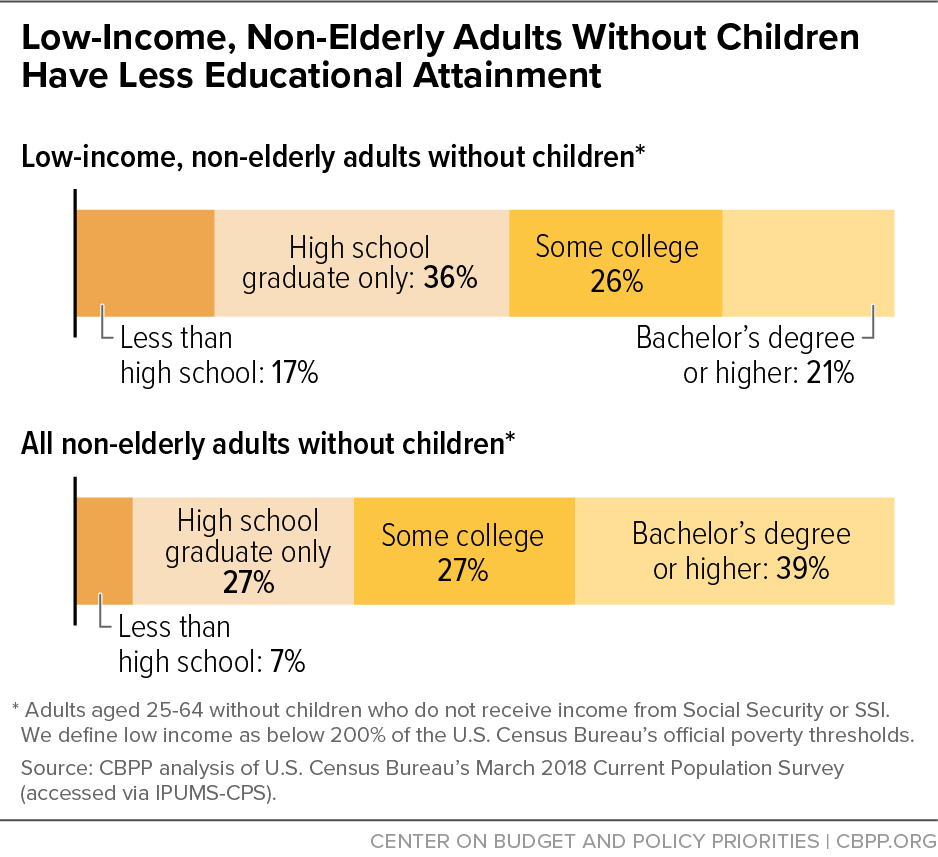
Low-income adults without children generally tend to be younger than all non-elderly adults without children: about 60 percent are under age 45, compared to 52 percent for all non-elderly adults. While the majority of non-elderly adults without children are white, Black and Latino people are overrepresented among those with low incomes, indicative of historical racism and other factors that have led to wide disparities and unequal treatment in housing, education, and employment. And while over one-third of all non-elderly adults without children have a college degree, low-income non-elderly adults without children are only about half as likely to have a college degree, which often limits their employment and economic opportunities. (See Figure 2.) Low-income non-elderly adults without children are also twice as likely as all non-elderly adults to have a disability that limits or prevents work.[10]
Eligibility for some programs is limited to people who are unable to work, and some programs’ definitions of disability do not account for certain physical, mental, or other health conditions that limit the kind or amount of work an individual can do. In some programs, eligibility for non-elderly people who aren’t employed is limited to people receiving SSI or SSDI. But SSI[11] and SSDI[12] have arduous (and lengthy) disability determination processes, and many people with disabilities don’t receive those benefits. Of the more than 46 million adults reporting a disability in 2014, only about 40 percent received cash assistance such as SSI or SSDI.[13] Many did not qualify because their disability did not meet the strict criteria for these programs, which can relate to both the severity and the duration of an individual’s condition.
If an adult is deemed able to work, they often are expected to work in order to qualify for benefits. In actuality, work status for this group fluctuates; many people work significant periods of time but also experience periods of joblessness. Work status for this group is better considered over time than at a single point in time.
Most low-income, non-elderly adults who can work do so. Using the most recent longitudinal data from the Census Bureau’s Survey of Income and Program Participation (SIPP),[14] we examined the employment data pertaining to low-income, non-elderly adults who don’t have children in the family and don’t receive SSI or SSDI. (See Figure 3.)
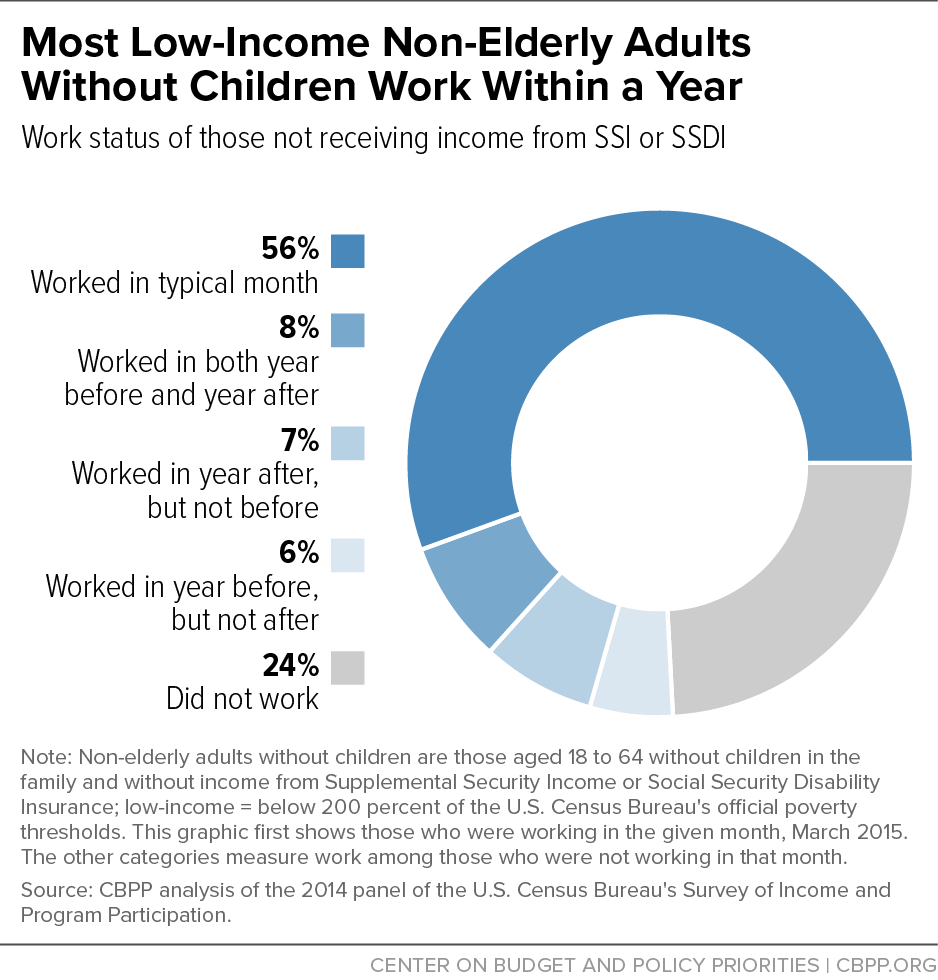
An adult may be out of work for a period of time for a variety of reasons, including health reasons, school attendance, or the need to care for a family member. Others cannot find work or have been laid off. People who are not working within a year are more likely to identify as having a disability than those who are working. If benefits are contingent on employment, non-elderly adults without children may find themselves ineligible for important assistance, including at times when they need it most.
Educational attainment often plays a role in the availability of employment opportunities. For example, the SIPP data show that people who weren’t employed 12 months before or after the given month we examined tended to have less education than people who worked within that period. An adult’s educational attainment is the result of many factors, including their family’s income when they were children and the quality of the schools they attended. Due to racism and discrimination, people of color disproportionately face barriers to educational and employment opportunities. This is reflected in the SIPP data, which show that people of color were somewhat less likely than those identifying as white to work 12 months before or after a given month, though most people of every racial or ethnic group work.
Moreover, the COVID-19 pandemic and recession have exacerbated systemic barriers to economic mobility that people of color face. Due to factors including the lack of adequate educational and employment opportunities, Black and Latino workers were more likely prior to the pandemic to be employed in low-paid industries that have seen disproportionately large job losses during the pandemic.[15] Low-paid industries accounted for more than half of the jobs lost from February to December 2020, our analysis found.[16] Similarly, people with a college degree have seen jobs return far more quickly than people without a college degree, exacerbating racial disparities in unemployment.
Economic and Health Programs Often out of Reach for Low-Income Adults Without Children
When these adults do receive assistance, health and economic security programs can increase their access to health insurance, their food security, and their housing stability, ultimately improving their health outcomes and economic well-being. For example, SNAP keeps millions of people out of poverty, reduces food insecurity, and has been linked to positive health outcomes among adults, such as fewer physician visits, fewer days missed due to illness, more positive self-assessments of health status, and a reduced likelihood of demonstrating psychological distress.[17] In addition, the coverage provided by the ACA’s Medicaid expansion yields significant benefits for those who gain coverage, including improved access to health care, better financial security and economic mobility, and better health outcomes such as lower morbidity and mortality.[18] Rental assistance is highly effective at reducing homelessness and housing instability among those receiving it, and by lowering rental costs, it allows low-income people to spend more on other basic needs like food and clothing.[19] The EITC and General Assistance raise low incomes and reduce poverty.
These programs reach far fewer adults without children than the number who need such assistance; many non-elderly adults without children receive little or no assistance despite experiencing serious hardship. Cash aid provided through General Assistance was never substantial and continues to erode, and uneven coverage and restrictive policies limit the ability of various federal economic and health supports to adequately address needs like food, housing, and health care. Although economic security programs reduce the number of non-elderly adults with minor children in poverty by 40 percent, these programs reduce poverty by only 8 percent for non-elderly adults without minor children.[20] Strengthening these supports for non-elderly adults without children would be particularly important to improving the well-being of people of color and immigrants, who typically have fewer assets to fall back on during hard times.
In addition, many immigrants with very low incomes are ineligible for various forms of public assistance due to their immigration status, including people with Deferred Action for Childhood Arrivals or Temporary Protected status, people with temporary visas related to a variety of factors like schooling, people filling jobs needed in certain economic sectors, and lawful permanent residents who are in their first five years of having that status. These restrictions in accessing support place many immigrants and members of their families in an especially vulnerable situation amid the COVID-19’s pandemic and economic crisis. In other cases, lawfully present immigrants or members of their families are eligible for help from programs like SNAP or Medicaid but often forgo that assistance out of fear of the Trump Administration’s harsh “public charge” policies, which can place immigrants at risk if they receive those benefits despite being eligible for them.[21] If immigrants and their family members are afraid to access help for which they qualify, they are more likely to face serious hardships like eviction, poor health outcomes, homelessness, and hunger.
The economic and health programs discussed in this paper cover non-elderly adults without children to varying degrees, but the programs’ eligibility restrictions with respect to this population leave many adults in need with little or no assistance. Furthermore, the differences in eligibility across programs can be complex and cumbersome for people to understand and navigate. (See Table 1.) And wide variations across states mean that two otherwise-similar people living in different states may have varying types and levels of assistance available to them.
Medicaid. States have the option to expand Medicaid coverage to low-income adults with incomes below 138 percent of the federal poverty level, or $17,608 for a single person in 2020. If a state does not adopt the expansion, then among adults who aren’t elderly, disabled, or in need of long-term care, only parents (often only parents with exceedingly low incomes) can qualify for Medicaid. Other non-elderly, non-disabled adults are generally ineligible for Medicaid in these states regardless of how low their incomes are or whether they have access to other coverage.
Thirty-six states and Washington, D.C. have implemented the ACA Medicaid expansion, with two more states planning to implement it in the near future as a result of successful ballot initiatives in 2020. More than 15 million adults had health insurance coverage in 2019 through the Medicaid expansion. But an estimated 6.5 million more would have been covered had all states adopted the expansion. (The figures cited here include both adults with children and adults not raising children in their home.)
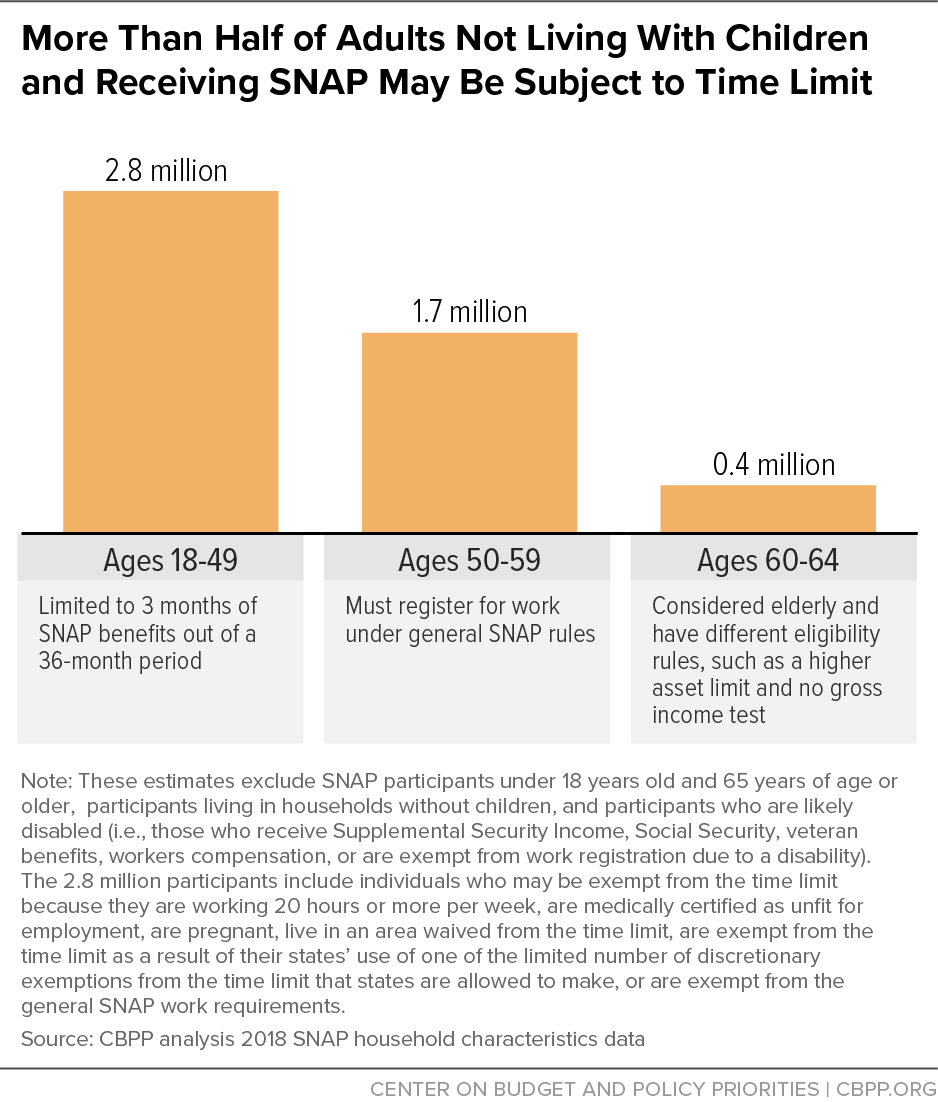
SNAP. SNAP provides food assistance to nearly 5 million low-income working-age adults not living with minor children. Nearly 3 million of these individuals, those aged 18 to 49, face much tougher eligibility rules than other participants. In general, they can only receive SNAP benefits for three months out of every 36 months unless they are working or participating in a qualifying work program for at least 20 hours per week, regardless of the availability of work or training programs in their area. People who search diligently for work but can’t find it are cut off the program after three months despite their search efforts. States can waive the three-month time limit for this group for areas within the state that meet certain unemployment thresholds. In 2019, 34 states, the District of Columbia, Guam, and the U.S. Virgin Islands had a waiver from this time limit in place in parts of the state with high unemployment. The time limit has been temporarily suspended nationally during the COVID-19 pandemic.
Federal rental assistance. Rental assistance makes housing affordable by allowing low-income families to pay 30 percent of their income for housing, with a federal subsidy covering the rest. Rental assistance helps about 10 million renters keep a roof over their heads. It also helps people with disabilities; nearly half of the non-elderly (aged 18 to 61) adults without children receiving rental assistance have a disability.[22] Insufficient funding prevents most people in need from receiving any help with the rent, however. Fewer than 1 in 5 eligible non-elderly adults without children receive any rental assistance.
EITC. The Earned Income Tax Credit is a federal tax credit for low- and moderate-income households that increases in value as a person’s earnings rise (up to certain income thresholds); only households with earnings in that year qualify. The credit amount depends on whether tax filers have qualifying children (and if so, on the number of children). For people in certain income ranges, the credit amount also depends on marital status. (This part of the EITC structure is designed to address marriage-penalty issues.) The EITC boosts incomes and reduces poverty, but is far stronger for low-income families with children than for low-income working adults without children, who are eligible only for a small credit or none at all. Largely as a result of the EITC for these workers being so small, the federal tax code taxes about 5.8 million adults between the ages of 19 and 65 who aren’t raising children in their home into, or deeper into, poverty; the federal payroll (and in some cases, income) taxes these workers owe are larger than any EITC they receive. In addition to the federal EITC, some 29 states plus the District of Columbia and Puerto Rico have enacted their own versions of the EITC, which typically are set at a modest percentage of the federal EITC.
General Assistance (GA). General cash assistance is entirely funded with state or local dollars. States can choose whether to have a program at all, and if so, they set their own eligibility criteria and benefit levels. Half the states do not provide any type of GA. Of the 25 states that do, only 11 provide any GA benefits to individuals who are deemed “employable,” meaning that they don’t have a disability or certain other barriers to work. State GA programs served fewer than a half million poor households in December 2019. Benefit levels are very low: maximum benefits fall below half the federal poverty level in most states with GA programs, and below a quarter of the federal poverty level in half of these states.
Policymakers Can Strengthen Supports for Low-Income Adults
The system of economic and health supports for low-income, non-elderly adults without children should be strengthened to close gaps in the current spotty system of assistance. These programs have the potential to substantially reduce financial, housing, and food hardship that many low-income, non-elderly adults without children face. This is especially urgent in response to the COVID-19 pandemic and economic downturn and the increased hardship that low-income households confront. To ensure households have the assistance they need when they fall on hard times, policymakers should:
Expand program coverage and strengthen program benefits. Due to some programs’ limited coverage and benefits, many low-income non-elderly adults are receiving little or no assistance. Expanding program coverage and boosting benefits would provide greater assistance to this group and lift more people out of poverty. For example, all states should adopt the ACA’s Medicaid expansion for low-income adults (and federal policymakers should consider new financial incentives to encourage the remaining states to do so), and the federal government should modify the ACA marketplace coverage that’s offered to low-income adults to better ensure quality affordable coverage in states that continue to decline to expand Medicaid.
Make assistance available to those who don’t have jobs. As described above, some programs make benefits available only to non-elderly adults who are employed or meet a strict definition of disability. This lack of assistance leaves many in need without help and overlooks key nuances about this population. Ultimately, more significant income assistance and fewer eligibility restrictions are needed to reduce poverty and hardship among this group.
Reduce significant variation across states in program rules. Reducing the variation in access to programs and benefit amounts would allow low-income adults to receive more equal support, regardless of residence.
Prevent further restrictions in eligibility and benefits. Some federal and state policymakers have proposed measures that would further restrict eligibility and benefits for key needs-based programs, lessening their ability to provide assistance and meet the needs of low-income adults. Given that economic and health programs can improve health, educational, and employment outcomes, while also alleviating hardship, policymakers should reject efforts to curb access to these benefits.
The chapters that follow describe eligibility criteria, participation data, and measures of effectiveness for low-income, non-elderly adults without children across five types of health and economic security programs: Medicaid, SNAP, HUD rental assistance programs, the EITC, and state General Assistance programs. The table below briefly explains how each program defines and determines eligibility, the benefits available to participants, and variation among states in administering these programs.
| TABLE 1 | |||
|---|---|---|---|
| Economic and Health Supports Are Fragmented, Weak for Low-Income, Non-Elderly Adults Without Minor Children in the Family | |||
| Program | Eligibility Affecting Non-Elderly (18- to 64-year-old) Adults Without Minor Children in the Family | Benefits | State Variation |
| Medicaid | States have the option under the ACA’s Medicaid expansion to cover adults aged 19-64 with incomes at or below 138 percent of the federal poverty level — including adults who don’t have children living in the home and don’t otherwise qualify for Medicaid (i.e., they don’t have a federally recognized disability). | Access to comprehensive health care that improves health outcomes, financial security, and economic mobility. | Access to Medicaid for this group largely depends on whether a state has adopted the Medicaid expansion. Currently, 36 states and D.C. have implemented the Medicaid expansion, with future implementation anticipated in two more states as a result of the approval of ballot initiatives. |
| Supplemental Nutrition Assistance Program (SNAP) | Otherwise-eligible adults aged 18-49 (who generally must have gross income below 130 percent of the federal poverty level) who aren’t physically or mentally unable to work, pregnant, or in a household with a minor child can receive SNAP benefits for only three months (out of every 36 months) in which they are not employed or participating in a qualifying work or training program for at least 20 hours per week. Searching for work but being unable to find work does not count as a qualifying work activity. | Nutritional support to purchase food at designated SNAP retailers. In 2018, the average monthly benefit for one-person households consisting of adults aged 18-49 without minor children was $172. | The three-month time limit can be lifted in some areas if the state receives a temporary waiver from the time limit, based on elevated unemployment in those areas. In 2019, 34 states, D.C., Guam, and the Virgin Islands had a waiver from the time limit in place, in most cases for part of the state. |
| Federal Rental Assistance | Adults aged 18-61 without minor children and with incomes at or below 80 percent of the local median income are eligible for housing assistance, but funding is limited. Due to insufficient funding, 7 million eligible households consisting of non-elderly adults without children that pay over half their income for rent are unable to receive any rental assistance. Available resources are targeted to individuals with disabilities; nearly half of non-elderly adults receiving rental assistance have a disability. | Rental assistance makes housing affordable by allowing families to pay 30 percent of their income for housing, with a federal subsidy covering the rest. | There are variations in how the program is administered by state and local housing agencies and in how those agencies use the program funding they receive. For example, state and local housing agencies administering Housing Choice Vouchers may choose to prioritize people with disabilities when taking renters from a waiting list for assisted housing. |
| Earned Income Tax Credit (EITC) | Adults aged 25-64 who aren’t raising children in the home and who have earned income below a certain threshold (in 2020, $15,820 for someone who isn’t married, $21,710 for married couples). | The EITC is a federal tax credit for low-income workers that raises their incomes and reduces poverty. There is a small EITC specifically for workers without children. It provided an average credit of $302 in 2018. Even with the credit, many in this group still owe net federal taxes, despite being below the poverty line. | States can create their own version of the federal EITC to help low-income working people meet basic needs. Currently, 29 states, D.C., and Puerto Rico have enacted a state EITC, with varying inclusivity and credit amounts. |
| State General Assistance (GA) | Very low-income adults who are not elderly, do not have minor children in the home, and do not qualify for SSI (or are waiting for an SSI benefit determination) sometimes qualify for GA, depending on whether their state offers a GA program and, if so, its eligibility criteria. Available benefits may differ depending on whether an adult has some disability or barrier to employment. | Basic cash assistance to supplement income and provide for basic needs. Benefit levels have eroded over the years, and eligibility has become much more restrictive in many states. Currently, benefits are below half the federal poverty level in most states with GA programs and below a quarter of the federal poverty level in half of these states. | States determine whether or not to provide GA and which groups of individuals to serve. Currently, only 25 states have GA programs at all, and only 11 states provide benefits to individuals who do not have some disability or barrier to employment. Benefit levels vary from state to state. |
ACA Medicaid Expansion Offers Long-Needed Health Insurance Coverage to Low-Income Adults Without Children
Created in 1965, Medicaid is a public insurance program that provides health coverage to low-income families and individuals, including children, parents, pregnant women, seniors, and people with disabilities; it is funded jointly by the federal government and the states. In 2014, the Affordable Care Act (ACA) gave states the option to expand Medicaid eligibility to low-income, non-elderly adults who do not have children of their own living in the home and who do not otherwise qualify for Medicaid for reasons such as having a federally recognized disability.
By October 2020, 36 states and the District of Columbia had implemented the ACA Medicaid expansion option.[23] More than 15 million low-income adults had health coverage in 2019 through the Medicaid expansion, the large majority of them newly eligible for Medicaid because of the ACA.[24] Another 6.5 million would have been covered by Medicaid had all states expanded, the Urban Institute estimates, including roughly 4.6 million low-income adults without children of their own living in the home; more than half were instead uninsured, while most of the rest instead had coverage through the ACA marketplaces, which requires higher premiums and cost sharing.[25] Since the ACA’s major coverage expansions took effect in 2014, Medicaid has helped to reduce the number of uninsured low-income adults without children of their own living in their home from 10.5 million to 5.2 million.
With millions of people newly unemployed or facing sharp income losses during the COVID-19 recession, the need for Medicaid coverage has been growing, as it does during all economic downturns. The states that have expanded Medicaid are better positioned to respond to the COVID-19 public health emergency and to prevent the resulting economic downturn from worsening access to care, financial security, health outcomes, and health disparities.
Medicaid expansion coverage yields significant benefits for those gaining coverage, including improved access to health care, financial security, economic mobility, and better health outcomes.[26] Perhaps most striking, rigorous studies have found that Medicaid expansion — and ACA coverage more broadly — save lives.
Background
Each state operates its own Medicaid program within federal guidelines. Federal policymakers have revised these guidelines over time, both to expand Medicaid eligibility to more low-income individuals and to make new health benefits available to them, such as home health care services and prescription drugs. States have considerable flexibility in designing and administering their programs, so eligibility and benefits vary from state to state.
In 2019, 95 million low-income people were enrolled in Medicaid over the course of the year. In any given month, Medicaid served 31 million children, 27 million adults (mostly in low-income working families), 6 million seniors, and 9 million people with disabilities, according to Congressional Budget Office (CBO) estimates.[27]
Medicaid is an “entitlement” program, which means that anyone who meets eligibility rules has a right to enroll in Medicaid coverage. It also means that states have guaranteed federal financial support for part of the cost of their Medicaid programs, ranging from 50 percent to 77 percent of costs, with states with lower personal income bases receiving greater federal financial assistance.
In order to receive federal funding, states must cover certain “mandatory” populations:
- children through age 18 in families with income below 138 percent of the federal poverty line ($29,974 for a family of three in 2020);
- people who are pregnant and have income below 138 percent of the poverty line;
- certain parents or caretakers with very low income; and
- most seniors and people with disabilities who receive cash assistance through the Supplemental Security Income (SSI) program.
States may also receive federal Medicaid funds to cover “optional” populations. These include: people in the groups listed above whose income somewhat exceeds the limits for “mandatory” coverage; seniors and people with disabilities not receiving SSI and with income below the poverty line; “medically needy” people (those whose income exceeds the state’s regular Medicaid eligibility limit but who have high medical expenses, such as for nursing home care, that reduce their disposable income below the eligibility limit); and other people with higher income who need long-term services and supports. And, as discussed below, under the ACA, states can also cover — with enhanced federal funding — adults aged 19 through 64 with income below 138 percent of the poverty line, including those without children living in the home and those not receiving federal disability assistance. This chapter focuses on these adults — identified in this chapter as “Medicaid expansion adults” — who either are enrolled in Medicaid due to the ACA expansion or who are uninsured but would be eligible and could enroll if their state expanded coverage.
Federal rules also require state Medicaid programs to cover certain “mandatory” services, such as hospital and physician care, laboratory and X-ray services, home health services, and nursing facility services for adults. States can — and all do — cover certain additional services as well. All states cover prescription drugs, and most cover other common optional benefits, including dental care, vision services, hearing aids, and personal care services for frail seniors and people with disabilities. Although these services are considered “optional,” they are critical to meeting Medicaid beneficiaries’ health needs.
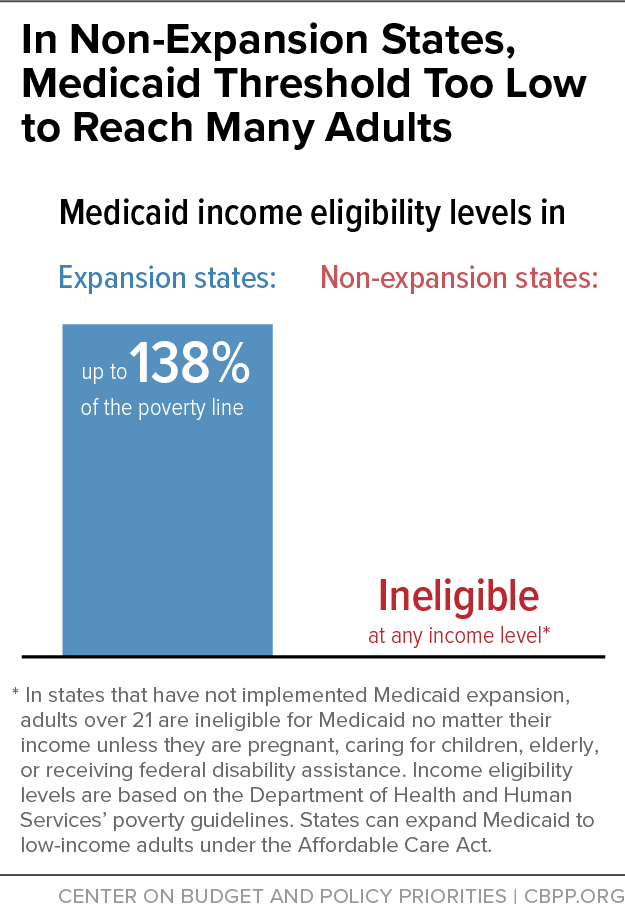
Not all people with low income are eligible for Medicaid. In the 14 states that have not implemented the ACA Medicaid expansion (as of October 2020), adults over 21 are generally ineligible for Medicaid no matter how low their incomes may be unless they are pregnant, caring for children, elderly, or receiving federal disability assistance. (See Figure 4.) And, in the typical (or median) non-expansion state, even those who are parents are ineligible if their income exceeds just 41 percent of the poverty line ($8,905 for a family of three),[28] unless they are pregnant or receiving federal disability assistance.
ACA Expands Medicaid to Low-Income Adults Without Children of Their Own in the Home
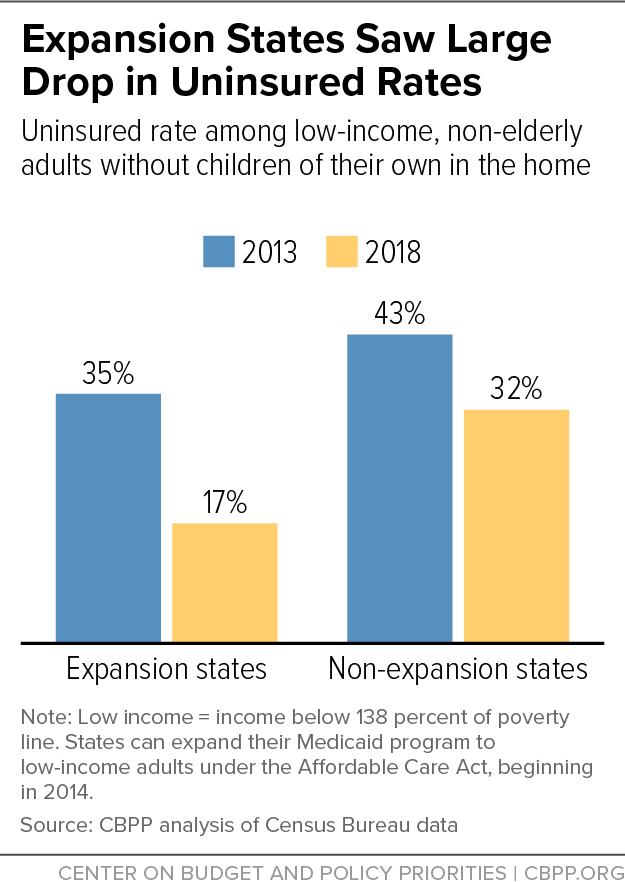
Prior to the implementation of the ACA’s health insurance coverage provisions, health insurance coverage options were quite limited for low-income adults without children of their own living in their home. Medicaid coverage was available to non-elderly adults not receiving federal disability assistance and without children of their own living in the home only in a small number of states that applied for waivers.[29] The individual insurance market was expensive and often denied coverage or offered only partial coverage, particularly for those with pre-existing conditions. Employer-sponsored coverage was (and continues to be) less available to low-wage workers and often out of reach financially.[30] As a result, in 2013, nearly half — some 48.6 percent — of these adults were uninsured.[31]
The ACA changed the health insurance coverage landscape dramatically for low-income adults without children of their own living in the home. It gave states the option to expand Medicaid coverage to all adults[32] with family income at or below 138 percent of the federal poverty line — $17,608 for a single individual and $23,791 for a couple in 2020.[33] Like all other Medicaid enrollees, these adults are enrolled in comprehensive health coverage with minimal cost sharing. As of October 2020, 36 states and the District of Columbia had implemented the Medicaid expansion for low-income adults.[34] (Two others had adopted Medicaid expansion through voter initiatives but not yet implemented it.)
The federal government finances 90 percent of the cost of Medicaid expansion on a permanent basis. While states pay the remaining 10 percent of the cost, Medicaid expansion has produced net budget savings for many states by lessening the burden on a patchwork of largely state-funded programs that connect people who are experiencing homelessness, have substance use disorders, or have other serious needs with critical health care services.[35]
The ACA also reformed the individual health insurance market, making it more accessible to low-income adults. Each state was required to create an individual insurance marketplace, either federally directed or operated by the state, in which premium tax credits and cost-sharing subsidies help low- and moderate-income families afford health coverage. Financial assistance is available to marketplace enrollees with income between 100 percent and 400 percent of the federal poverty line. And individual market plans now must cover ten categories of essential benefits, including physician care, laboratory services, and hospitalization. Insurers can no longer discriminate against people with pre-existing conditions in the individual market, which is particularly critical given that roughly 54 million non-elderly people have health conditions for which insurers commonly denied coverage.[36]
The ACA has led to historic gains in health insurance coverage, improved access to care, reduced financial burden, and improved health for Medicaid expansion adults.[37] The uninsured rate among these adults dropped from 48.6 percent in 2013 to 28.7 percent in 2018, the most recent data available. Gains have been greatest in states that have adopted the ACA Medicaid expansion for low-income adults.[38] (See Figure 5.)
Studies also show that Medicaid expansion leads to more low-income adults having a personal physician and getting preventive care and regular care for chronic conditions, reductions in the share of low-income adults struggling to pay medical bills, better access to credit, improved diabetes and hypertension control, and fewer premature deaths among older adults.[39]
With millions of people newly unemployed or facing sharp income losses during the COVID-19 recession, the need for Medicaid coverage has been growing, as it does during all economic downturns. While comprehensive data are not yet available, preliminary data for a subset of states show enrollment is rising. Among 29 states with July 2020 data, enrollment is up 8.4 percent since February. The 36 states (plus the District of Columbia) that have expanded Medicaid are better positioned to respond to the COVID-19 public health emergency and to prevent the resulting economic downturn from worsening access to care, financial security, health outcomes, and health disparities; enrollment among Medicaid expansion adults rose 10 percent between February and June in the 16 states with available data.[40] At September’s 7.9 percent unemployment rate, non-elderly Medicaid enrollment would be expected to rise by 3 million to more than 5 million people, Urban Institute projections indicate.[41]
The ACA Medicaid expansion was intended to be implemented nationwide and to fill historical gaps in Medicaid eligibility for low-income adults, with premium tax credits for individual marketplace coverage envisioned as the vehicle for covering moderate-income adults. A June 2012 Supreme Court ruling, however, deemed the Medicaid expansion optional. Thus, in the 14 states that have not adopted the ACA Medicaid expansion, there remains no subsidized health insurance option for low-income adults without a federally recognized disability and without children of their own living in the home. These adults fall into what is widely known as the “coverage gap.”
Who Are Medicaid Expansion Adults?
More than 15 million low-income adults were enrolled in Medicaid under the ACA Medicaid expansion in 2019 in the 34 states (including the District of Columbia) that had implemented Medicaid expansion coverage by that time, according to the most recent administrative enrollment data.[42] Roughly three-quarters of those Medicaid expansion enrollees, or nearly 12 million, were low-income adults without children of their own living in the home, with the remainder being parents with income above their state’s eligibility level for parents but at or below 138 percent of the federal poverty line.[43] Likewise, an estimated roughly 6.5 million low-income adults would be eligible for Medicaid if their state expanded Medicaid coverage, including roughly 4.6 million low-income adults without children living in the home.[44] The remainder of this section considers, as one group — which we refer to as “Medicaid expansion adults” — both low-income adults enrolled in the Medicaid expansion who don’t have children of their own in the home and uninsured low-income adults without children of their own in the home who would be eligible if their state expanded Medicaid.[45] (See Figure 6 and Appendix Table 1.)
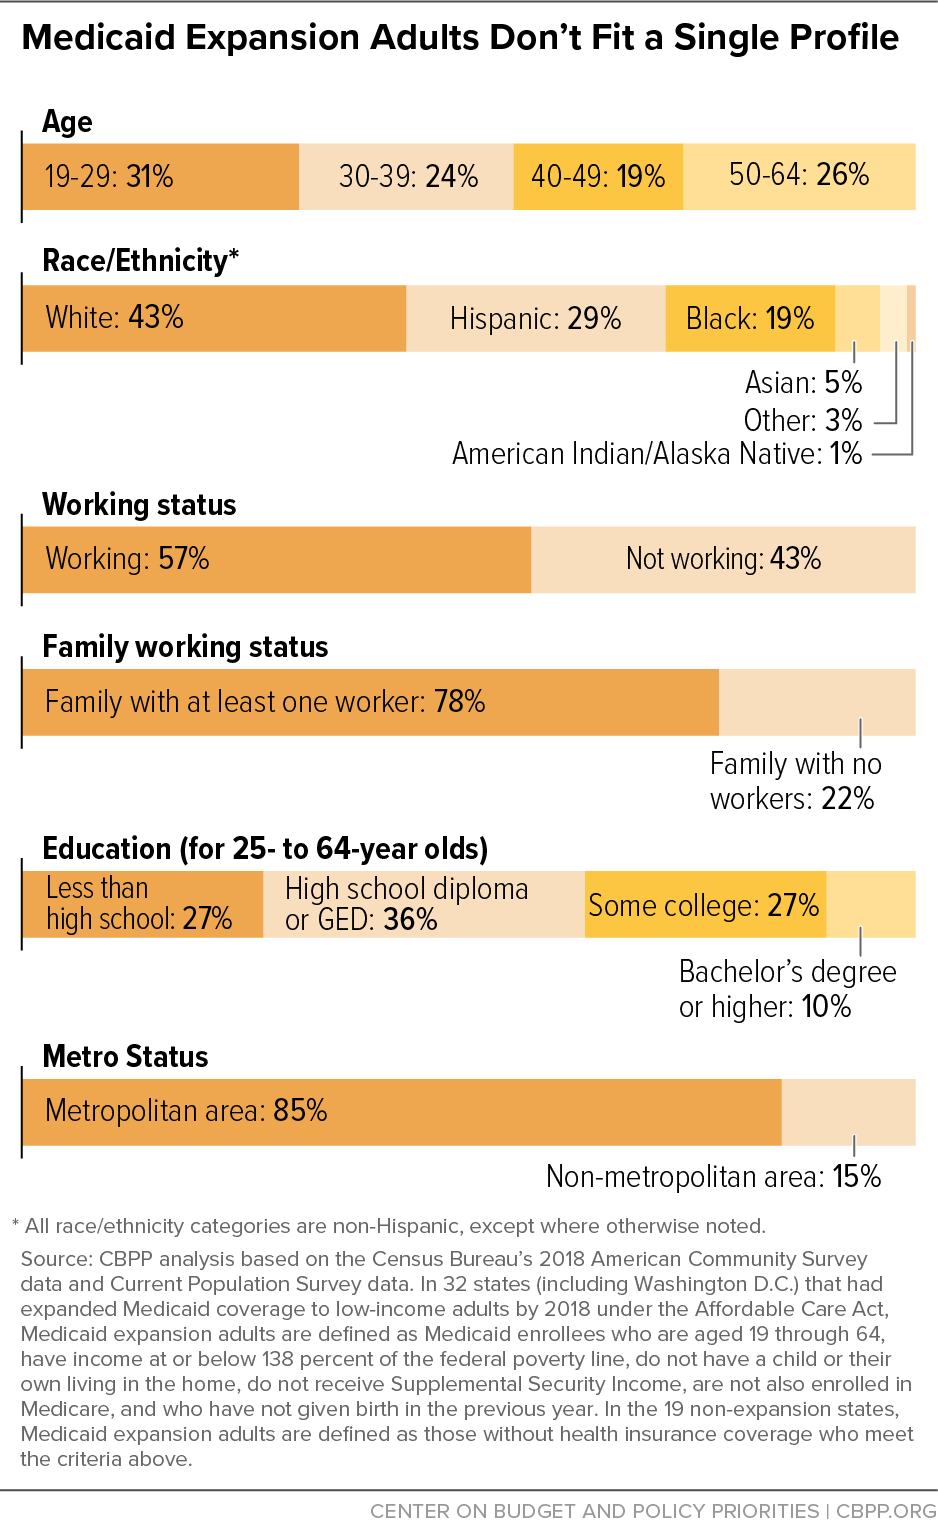
Age. Medicaid expansion benefits adults of all ages, but particularly young adults and those nearing retirement age. Roughly 31 percent of Medicaid expansion adults are aged 19 to 29, while roughly 26 percent are aged 50 to 64.[46] Medicaid is a needed support for young adults joining the workforce, often in entry-level or low-wage jobs in which employer-sponsored coverage is less available and affordable. Likewise, Medicaid serves many near-elderly adults transitioning out of the workforce and in need of health insurance coverage before reaching Medicare eligibility age.
Race and ethnicity. Medicaid expansion helps to reduce longstanding racial and ethnic disparities in health insurance coverage. More than half of Medicaid expansion adults are people of color, with roughly 29 percent Hispanic, 19 percent Black, and 6 percent Asian American, Native American, or Alaska Native. The uninsured rate gap between white people and people of color, especially Black people, has narrowed significantly since the implementation of the ACA’s coverage provisions, particularly in states that have adopted the Medicaid expansion. Still, racial gaps in coverage and access to care remain even in expansion states, which shows that longstanding economic and health system inequities, as well as limits on immigrants’ eligibility for Medicaid coverage, continue to harm people of color.
Disability status. Nearly 1 in 5 Medicaid expansion adults are living with a disability. Before the implementation of the ACA Medicaid expansion, the primary path for adults with a disability to qualify for Medicaid coverage was to declare an inability to work and go through a disability determination to qualify for SSI. However, many people with disabilities do not meet the strict SSI qualifying standards and so do not qualify for Medicaid based on that criterion.
Medicaid expansion helps address that gap.[47] Some 17 percent of Medicaid expansion adults have at least one condition that impairs daily functioning and their ability to work, including deafness or serious difficulty hearing, blindness or serious difficulty seeing, serious cognitive impairment, serious difficulty walking or climbing stairs, difficulty dressing or bathing, or difficulty doing basic daily activities. Furthermore, an even greater share of Medicaid expansion adults have a serious chronic condition, such as diabetes, asthma, or a mental health condition.[48] Medicaid expansion serves as a vital support for these individuals. For example, employment rates for workers with disabilities have risen in Medicaid expansion states while falling in non-expansion states, research shows.[49]
Workers. Most Medicaid expansion adults are working themselves or are in a working family. Some 57 percent work during the year, with 36 percent working in at least 40 weeks of the year. Furthermore, 78 percent are in a working family, and 63 percent are in a working family with an individual working at least 40 weeks of the year. During the COVID-19 pandemic, Medicaid expansion has been an important source of coverage for essential workers. In 2018, 25 percent of Medicaid expansion adults worked in industries that have been considered essential or front-line industries during the pandemic, including hospital workers, home health aides, food manufacturing workers, grocery store workers, farm workers, employees of pharmaceutical manufacturers, pharmacy workers, bus and truck drivers, and warehouse workers. Among those who are not working, most report potential barriers to work such as illness or disability, caregiving responsibilities, or attending school.[50]
Education. Medicaid expansion helps to reduce health insurance coverage disparities by education levels. Roughly 60 percent of Medicaid expansion adults have not attended college, compared to only 37 percent of non-elderly adults without children with income above the Medicaid income threshold. Although the great majority of Medicaid expansion adults are working or in working families, lower levels of education are associated with lower-wage work, which is less likely to offer affordable employer-sponsored coverage. Medicaid expansion coverage provides critical support; among those who have not attended college, the uninsured rate in Medicaid expansion states fell from 28.3 percent in 2013 to 16.0 percent in 2018.[51]
Geography. Medicaid expansion adults reside in both urban and rural areas. Roughly 85 percent live in a metropolitan area, while 15 percent live in a non-metropolitan area. Medicaid expansion adults are slightly more likely to live in a non-metropolitan area than are non-elderly adults generally.[52] In addition to providing health insurance coverage to low-income adults, Medicaid also supports and sustains hospitals, particularly in rural areas.[53]
Military experience. Some 2.2 percent of non-elderly adult military veterans are Medicaid expansion adults, and they represent 2.0 percent of all Medicaid expansion adults. Like the overall population, most veterans get health coverage through their employer, but large gaps exist for those without access to job-based coverage. While many veterans receive coverage through the Department of Veteran Affairs (VA) health system, some do not qualify, some do not live near a VA facility, and some are not aware of VA care. Medicaid expansion helps provide coverage for the lowest-income veterans without children living in the home. Medicaid reduces unmet health care need and medical debt among veterans and provides needed services such as behavioral health, prescription drug coverage, and home health care services.[54]
Policymakers Should Reject Efforts to Restrict Medicaid Coverage and Access
Despite the Medicaid expansion’s unmitigated success in meeting the health care needs and reducing the financial burdens of low-income adults without children of their own living in the home, debate continues over certain policies related to Medicaid expansion that are clearly harmful to enrollees. Furthermore, the Trump Administration and 18 state attorneys general, led by Texas, have petitioned the Supreme Court to strike down the ACA.[55] An estimated 21.1 million more people would be without health insurance coverage in 2022 were the ACA to be repealed.[56]
Debate also continues about whether to require work of Medicaid expansion adults as a condition of Medicaid eligibility and whether to impose premium and cost-sharing payments on this group. These debates continue both in various states that already have expanded Medicaid coverage under the ACA, such as Arkansas and Indiana, and in states that are considering expanding Medicaid, such as Missouri. Such policies threaten to lessen the benefit of Medicaid expansion and, in states that have adopted the expansion, to reverse some of the recent progress made in covering low-income adults without children of their own living in the home.
Taking coverage away from people who do not meet a work requirement is at odds with Medicaid’s central objective of providing affordable health coverage to people who would not otherwise have it. Yet, nine states have received approval from the Trump Administration to take Medicaid coverage away from adults who do not meet work requirements. In Arkansas, the only state so far to implement work requirements for Medicaid — which since have been suspended by a judicial injunction — it is increasingly clear that the work-requirement policy failed on its own terms.
Some 18,000 Arkansans — nearly 1 in 4 of those subject to the state’s work requirement — lost Medicaid coverage over the course of just the seven months in which the work requirement was enforced. Far more Arkansans lost Medicaid coverage than the number of people in the presumed target group of people who weren’t working and were ineligible for exemptions to the policy. Evidence suggests that many people who were working and many people with serious health needs lost coverage due to red tape. Large numbers of enrollees who lost coverage reported that they did not know about the work requirement or that it applied to them.
Harvard researchers found that among low-income Arkansans subject to the work requirement, the uninsured rate rose, yet there were no significant increases in employment, number of hours worked, or the overall rate of community engagement, including looking for a job, training for a job, or providing community service.[57] Furthermore, Arkansas’ own data show only scant evidence of increased work due to the work requirement.[58]
Six states — Arizona, Indiana, Kentucky, Maine, New Hampshire, and Virginia — have now reversed or suspended their plans to take Medicaid coverage away from people who don’t meet work requirements. These states cited legal challenges and significant pending coverage losses, among other reasons.
On another front, current rules limit premiums and cost sharing in Medicaid to facilitate low-income people’s access to coverage and care, but some states have received waivers to impose premiums. For example, Indiana requires adults enrolled in the state’s Healthy Indiana Plan (HIP, its version of the Medicaid expansion) to pay a monthly premium. Adults with income above the poverty line who don’t pay the premium are locked out from Medicaid coverage for six months, while adults with income below the poverty line are limited to significantly narrower benefit coverage — for example, exclusion of dental and vision care.
The preponderance of research shows that premiums reduce enrollment in coverage and co-payments often prevent Medicaid beneficiaries from accessing needed medical care.[59]
Medicaid is very effective in providing health insurance coverage to the most vulnerable. With the ACA, that includes coverage for low-income adults without children of their own living in the home, a group historically left out of health care coverage assistance efforts. Since the ACA’s major coverage expansions took effect in 2014, Medicaid has helped to reduce the number of uninsured low-income adults without children of their own living in the home from 10.5 million to 5.2 million. Perhaps most striking, rigorous studies have found that Medicaid expansion — and ACA coverage more broadly — save lives.[60] Further progress could be made if the 14 states that have not implemented Medicaid expansion did so, and if states implemented policies that encourage enrollment among eligible individuals rather than policies that discourage enrollment, like work requirements and cost-sharing requirements.
| APPENDIX TABLE 1 | |
|---|---|
| Demographics of the Medicaid Expansion Adult Population | |
| % of total Medicaid expansion adults | |
| Age | |
| 19 to 29 | 31% |
| 30 to 39 | 24% |
| 40 to 49 | 19% |
| 50 to 64 | 26% |
| Race/Ethnicity | |
| White, non-Hispanic | 43% |
| Black, non-Hispanic | 19% |
| Asian, non-Hispanic | 5% |
| American Indian/Alaska Native, non-Hispanic | 1% |
| Other, non-Hispanic | 3% |
| Hispanic | 29% |
| Working Status | |
| Working | 57% |
| Not working | 43% |
| Family Working Status | |
| Family with at least one worker | 78% |
| Family with no workers | 22% |
| Education Level (for 25- to 64-year-olds) | |
| Less than high school | 27% |
| High school diploma or equivalent | 36% |
| Some college | 27% |
| Bachelor’s degree or higher | 10% |
| Metropolitan Status | |
| Living in a metropolitan area | 85% |
| Living in a non-metropolitan area | 15% |
SNAP Restricts Nutrition Assistance for Low-Income Non-Elderly Adults Not Living With Minor Children
By Joseph Llobrera, Catlin Nchako, and Lauren Hall
Introduction
The nation’s largest anti-hunger program, the Supplemental Nutrition Assistance Program (SNAP), provides nutritional support for low-wage working families, unemployed workers and their families, and low-income seniors and people with disabilities. Unlike most means-tested benefit programs, which are restricted to particular categories of low-income individuals, SNAP provides benefits broadly to low-income households that meet the program’s eligibility requirements. SNAP’s coverage of non-elderly adults not living with children at home, however, is heavily restricted, with the result that many such people can secure neither food assistance nor other forms of aid, regardless of how poor they are.
In 2018, SNAP provided food assistance to nearly 5 million individuals aged 18 to 64 who weren’t living with minor children and didn’t have severe disabilities. SNAP requires most of these individuals (those aged 18 to 59 who aren’t employed) to register for work and to accept any reasonable work offer.
But for a subset of this group — individuals aged 18 to 49 who don’t live with minor children and aren’t severely disabled — the eligibility requirements are much more restrictive. With some exceptions, SNAP rules limit benefits for these individuals to just three months in any 36-month period when the individuals are not employed or participating in a work or training program for at least 20 hours a week.[61] States are not obligated to offer the affected individuals a work or training program slot, and most do not. SNAP recipients in this group who don’t have jobs generally have their SNAP benefits cut off after three months, irrespective of whether they are searching diligently for a job or willing to participate in a qualifying work or job training program.
In reality, this rule is thus a time limit on benefits, rather than a work requirement, as it is sometimes described. By restricting access to food assistance benefits, the time limit increases the risk of food insecurity and hunger for adults who are subject to these requirements.
In addition to being a harsh policy that punishes individuals who are willing to work but can’t find employment, the rule is one of the most administratively complex and error-prone aspects of SNAP law. Many states also believe that the rule undercuts their efforts to design meaningful work requirements, because the time limit imposes unrealistic dictates on the types of job training that can qualify. For these reasons, many states have long sought the restriction’s repeal.
The number of households that struggle to put enough food on the table has risen dramatically due to the economic effects of the COVID-19 pandemic. In late November and early December 2020, more than 27 million adults (or 13 percent) reported that their household didn’t get enough to eat sometimes or often in the last seven days. Even after the public health emergency ends, access to SNAP benefits will be critical in reducing the risk of food insecurity and hunger for all households, including those with adults not living with minor children, during what could be a long recovery from the economic damage from the COVID-19 crisis.
Background
SNAP is an effective program, lifting millions out of poverty and improving participants’ food security and health. A CBPP analysis using the government’s Supplemental Poverty Measure (SPM, which counts SNAP benefits as income) and correcting for the underreporting of benefit receipt in government surveys, found that SNAP kept 6.3 million people out of poverty in 2017, and lifted 4 million people out of deep poverty (defined as being below 50 percent of the SPM poverty line).[62]
SNAP enables low-income households to afford more adequate and healthy food. Rigorous studies have yielded compelling evidence that SNAP reduces food insecurity (which can occur when households lack the resources to have consistent access to nutritious food). Research in the past decade has also found associations between SNAP participation and positive health outcomes among non-elderly adults, such as fewer physician visits, fewer days missed due to illness, more positive self-assessments of health status, and reduced likelihood of psychological distress.[63]
SNAP eligibility and benefits are, for the most part, set at the federal level and uniform across the nation, though states have flexibility to tailor certain aspects of the program, such as the value of a vehicle that a household may own and still qualify for benefits. Eligibility and benefits are determined based on a household’s income and expenses. The benefit levels are tied to the Department of Agriculture’s Thrifty Food Plan, a diet plan intended to provide adequate nutrition at minimal cost. In 2019, SNAP helped 35.7 million low-income individuals in a typical month, down from its peak of 47.6 million in 2013.[64] In a typical month in 2019, SNAP benefits averaged about $130 per person per month, or about $4 per person per day or $1.40 per meal.
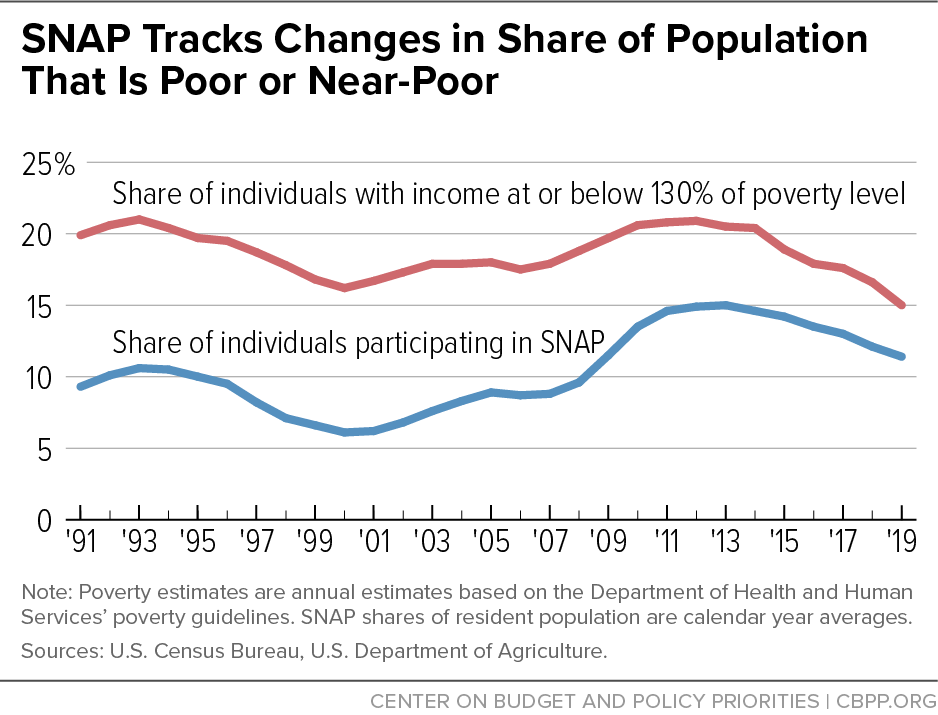
SNAP benefits are an “entitlement,” which means that all applicants who qualify under program rules can receive benefits.[65] After Unemployment Insurance, SNAP is the federal program most responsive to changing economic conditions, expanding to meet rising need during economic downturns and then contracting when conditions improve. By design, SNAP is an effective form of economic stimulus — participation and spending expand automatically when the economy experiences a downturn that raises unemployment and reduces household incomes. This allows SNAP to respond quickly to increased need by providing households with more income to purchase food. (See Figure 7.) During a weak economy, every dollar in new SNAP benefits increases gross domestic product by about $1.50, according to a recent USDA study.[66]
SNAP has expanded at an unprecedented rate during the economic crisis spurred by COVID-19, as millions of people have lost jobs and income and struggled to afford food. Among states that provided preliminary data in late summer, 6 to 7 million people had applied and been approved for benefits since February — a 17 percent increase in participation.[67]
SNAP Supports Millions of Non-Elderly Adults Not Living With Minor Children
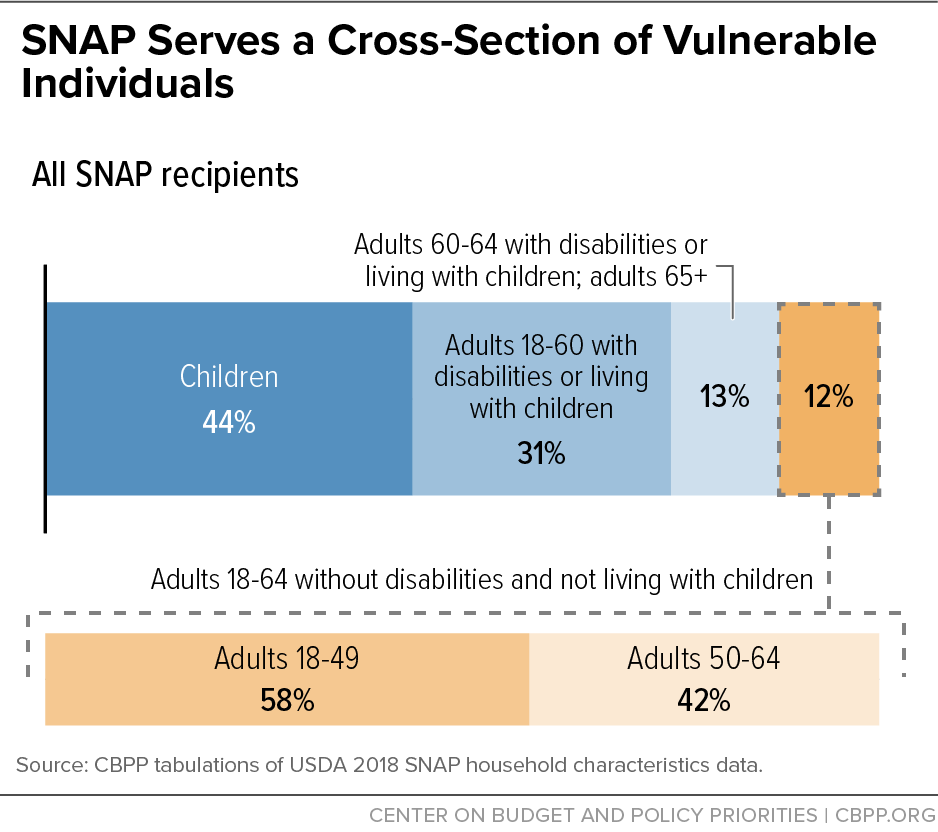
Like most income-support programs, SNAP primarily serves three vulnerable groups: low-income children and their parents and other household members (who make up close to 70 percent of SNAP participants); people with disabilities; and the elderly. But unlike other such programs, SNAP also serves a very broad cross-section of those with little income and few resources — including non-elderly adults without minor children or severe disabilities. In 2018, nearly 5 million adults aged 18 to 64 who weren’t living with minor children in the home (and didn’t have a severe disability) participated in SNAP in an average month. This group makes up 12 percent of the SNAP caseload. These individuals lived in households with an average of one household member and average gross income of $376 a month. They received an average monthly SNAP benefit of $183 while participating in SNAP.
About 1.7 million of these nearly 5 million SNAP recipients were adults aged 50 to 59, who must — unless they are unable to work due to a physical or mental limitation — register for work and accept any reasonable work offer, but otherwise face the same general eligibility rules as most other SNAP participants.[68] Another 400,000 of the aforementioned 5 million adults are aged 60 to 64 (which is considered elderly in SNAP).[69] Households that have elderly or disabled members face somewhat different eligibility rules; they don’t face a gross income limit (they still must meet a “net” or disposable income limit), and asset limits are set somewhere higher for them.
But 58 percent of the 5 million adults aged 18-64 participating in SNAP in 2018 who neither were living with minor children nor had a severe disability — some 2.8 million people — were aged 18 to 49. These individuals face more restrictive eligibility criteria, including the limit on benefit receipt of three months in any 36-month period when they are not employed or participating in a work or training program for at least 20 hours a week (see Figure 8).[70]
Adults Potentially Subject to the Time Limit Are Demographically Diverse; Many Face Barriers to Employment
Most SNAP participants aren’t subject to the time limit because they are children, are age 50 or over, are caring for a child, or have a disability. But the adults who are potentially subject to the time limit are a highly vulnerable group. As noted, there were 2.8 million such individuals, accounting for 7 percent of all SNAP participants, in fiscal year 2018. (See Figure 9.) The rest of this chapter focuses on this group.
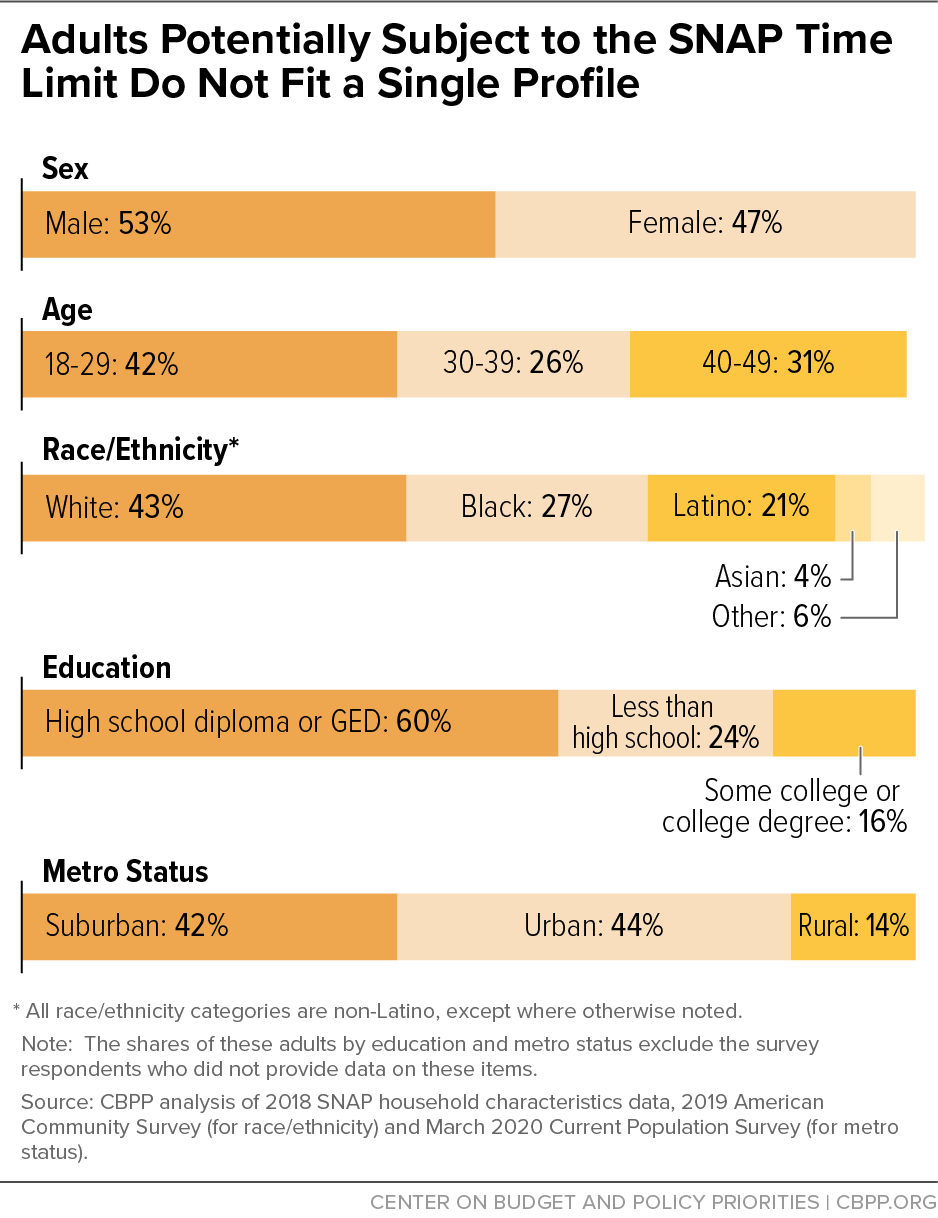
The adults who are potentially subject to the time limit are diverse; no single profile dominates. (See Figure 10.) Nearly half of them (47 percent) are women, and 31 percent are over 40 years old. Among those who reported their education, nearly a quarter (24 percent) have less than a high school education, and 60 percent have only a high school diploma or GED. They live in all areas of the country; among those for whom data on metropolitan status are available, about 44 percent live in urban areas, another 42 percent in suburban areas, and 14 percent in rural areas.[71] Nearly 80 percent live in single-person households. A small share are veterans.[72]
In no small part due to historical factors including ongoing structural racism and discrimination, people of color are more likely to experience hardship, face higher rates of unemployment, and have less access to adequate housing and health care.[73] Food insecurity is part of the nexus of hardship that people of color disproportionately encounter, resulting in lower access to nutritious food or fewer resources to acquire enough food to eat. In 2019, Black- and Latino-headed households were about twice as likely as white-headed households to be considered food insecure, consistent with historical disparities.[74]
SNAP helps reduce racial disparities by targeting benefits to those who need them most. Of the nearly 5 million non-elderly adults not living with minor children who receive SNAP benefits, about a quarter are Black and nearly one-fifth are Latino. Among adults potentially subject to the time limit who report their race, about two-fifths are white, over one-quarter are Black, and about a fifth are Latino. In contrast, the overall U.S. population is about 72 percent white, nearly 13 percent Black, and 18 percent Latino.[75]
Many low-income adults potentially subject to the time limit face multiple challenges to independence and self-sufficiency, including homelessness, physical and mental health limitations, language barriers, unstable employment histories, and criminal records.
Physical and mental health issues can lead to job loss, complicate reentry into the workforce, and limit job opportunities. Moreover, limited education, lack of training, and a sporadic work history often lead to low-skill, low-wage jobs that don’t lift workers out of poverty.
Most Adults Potentially Subject to the Time Limit Are Poor, Attached to the Labor Force
In general, adults potentially subject to the time limit are extremely poor. Like many others, these adults often turn to SNAP when they’re no longer able to make ends meet — for example, when they lose a job, have their hours cut, or can only find low-wage employment. Their household income during the months they participated in SNAP averaged $4,500 in 2018 on an annualized basis (about 37 percent of the poverty level for a single-person household in 2018). Among those in this group who weren’t working at least 20 hours a week and thus faced being cut off of SNAP after three months, average household incomes while on SNAP were lower, at an annualized level of just $2,700 in 2018 (about 22 percent of the poverty level for a single-person household that year).
In addition, only 47 percent of the adults potentially subject to the time limit lived in households with any income.[76] And more than three-quarters lived in households with incomes below half of the poverty level, while nearly all (95 percent) lived in households below 100 percent of the poverty level.
Earnings are the most common income source among adults potentially subject to the time limit. In fiscal year 2018, a little over half (55 percent) of the adults in this group who had any income received some income from earnings in a typical month while on SNAP. About 12 percent received income from General Assistance or Social Security. Even smaller shares received Temporary Assistance for Needy Families (TANF) or Supplemental Security Income (SSI).
While many adults potentially subject to the time limit have limited education, which can restrict their job opportunities, most receiving SNAP who can work do so (otherwise, they would be cut off from SNAP at the three-month point). Although the research evidence is sparse, the evidence that does exist suggests that SNAP participation doesn’t discourage adults potentially subject to the time limit from working when jobs are available.[77]
Many workers turn to SNAP during periods of unemployment, so one would expect employment rates among adults potentially subject to the time limit to be relatively low in the months they are on SNAP. Even so, in a typical month while on SNAP, the share of these adults who are working ranges from a quarter to half.[78]
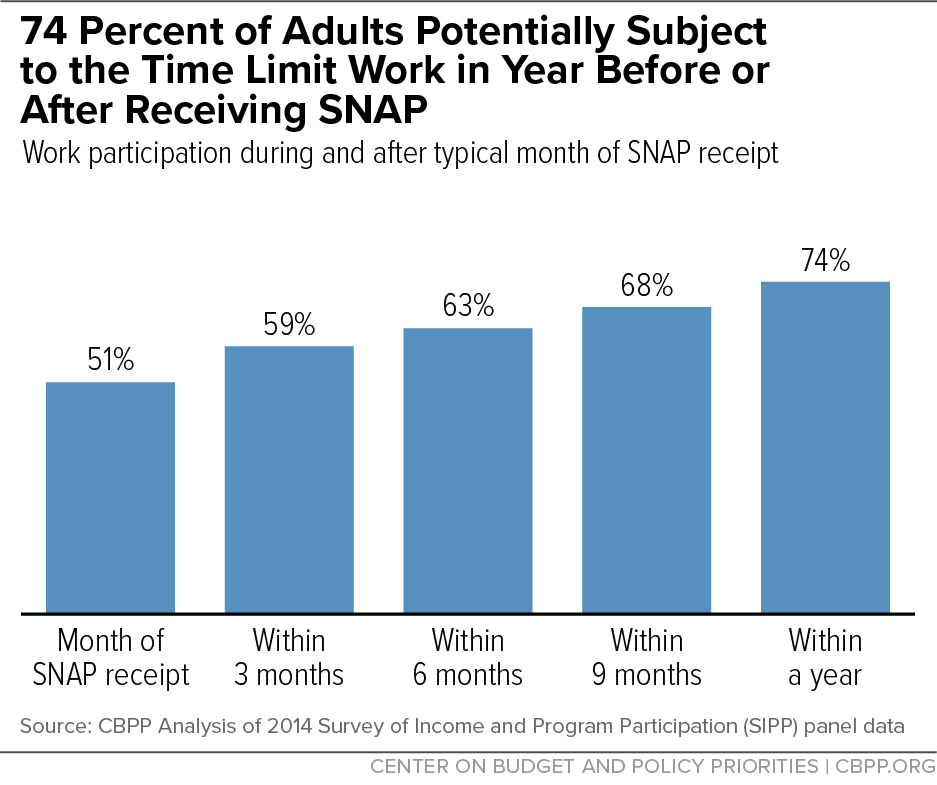
About 74 percent of these adults worked at some point in the year before or year after receiving SNAP. (See Figure 11.) And research conducted on the impact of the time limit following its enactment in 1996 found that three-quarters of all low-income adults who weren’t living with minor children and didn’t have a severe disability (not just those on SNAP) worked in 1997, while 86 percent were in the labor force (that is, either working or actively looking for work).[79]
Most adults potentially subject to the time limit who do work undertake a substantial amount of it. Among those adults who either worked in a typical month while receiving SNAP benefits or worked at some point during the following year, two-thirds worked full time (35 hours a week or more) at least at some point during the year. Over a third (36 percent) worked full time for six months or more of the year. Only 19 percent worked only part time (between 20 and 34 hours per week) for less than six months or worked fewer hours than that.
SNAP Eligibility and the Time Limit
Until the mid-1990s, SNAP was widely available to low-income, non-elderly adults with no children at home and without a severe disability. The Personal Responsibility and Work Opportunity Reconciliation Act of 1996 changed that by imposing the three-months-out-of-36 time limit. As noted, the time limit cuts off benefits after three months for people subject to it who aren’t employed or in a qualifying work or training program for at least 20 hours a week, doing workfare, or living in an area with high unemployment where the three-month limit is temporarily waived.[80]
Since most states don’t provide half-time employment opportunities to SNAP recipients, the only way that a person who can’t find employment can maintain SNAP eligibility during normal economic times generally is to find 20 hours a week of job training or activities under another work program or to find a workfare slot.[81] Job search, the lowest-cost activity for a state to require and monitor, does not count as a qualifying work program.[82]
As noted, states aren’t required to offer these recipients a place in a work or training program for 20 hours a week, and few states do. This leaves it up to individuals who can’t find a job to try to find training or work program openings on their own, which few are able to do, especially since most training programs have insufficient resources to meet demand, resulting in substantial waiting lists. A person who wants to work and is searching diligently but has been unable to find a job, and is willing to participate in job training but has had no opportunity to do so, loses all of their SNAP benefits at the three-month point.
Because this provision denies basic food assistance to people who want to work and will accept any job or work program slot offered, it is effectively a harsh time limit rather than a work requirement as such requirements are commonly understood. Work requirements in economic support programs typically require people to look for work and accept any job or employment program slot that’s offered. But they don’t cut off people who are willing to work and looking for a job simply because they can’t find one. And SNAP itself has separate work requirement authority of that nature for other categories of SNAP participants, under which states can require individuals to participate in job search or a training program but can’t terminate them if no program slot is available.
Studies of people potentially subject to the time limit who exited SNAP in the late 1990s after the time limit went into effect showed that these individuals reported significantly higher rates of food insecurity with hunger, as compared to other low-income adults not living with minor children.[83]
Temporary Waiver of the Three-Month Time Limit
The 1996 law allows states to request a temporary waiver of the three-month limit in areas of the state with elevated unemployment. The time limit provision doesn’t require states to offer workfare programs or job training to people who aren’t able to find a job. As explained above, most states do not offer these programs.
The temporary waiver option for areas with high unemployment has provided significant protection for people who face the three-month limit. Nearly every state suspended the time limit during and after the Great Recession of 2007-2009, due to soaring unemployment, to ensure that poor jobless workers would have access to food.[84] As unemployment rates fell during the economic recovery, fewer areas qualified for these waivers.
Governors across the political spectrum have used this flexibility to secure waivers for high-unemployment areas of their states. Every state except Delaware has used its waiver authority at some point over the last 23 years to temporarily suspend the three-month limit in at least part of the state.
Many of the states that have waivers from the three-month limit do impose other SNAP work requirements on unemployed 18- to 49-year-old adults in the waived areas who aren’t living with minor children, such as requiring them to look for work or participate in a training program if one is available to them. Individuals who don’t comply with those work requirements are subject to having their benefits cut off. But individuals living in areas of a state with waivers are not terminated from SNAP simply for being unemployed and unable to find a slot in a work or training program, as long as they comply with their state’s other applicable work requirements.
Two major events that occurred in 2020 underscore how significant these waivers are to providing food assistance for adults potentially subject to the time limit. A new USDA rule that was slated to take effect on April 1, 2020 would have sharply restricted states’ ability to continue securing waivers to protect unemployed adults from the time limit if they live in areas with elevated unemployment. The rule would have substantially narrowed the criteria that states most commonly use to qualify for waivers, thereby greatly shrinking the number of areas that could qualify for this relief. According to USDA’s own estimates, the rule would have cut off basic food assistance for nearly 700,000 SNAP participants ages 18 through 49 who aren’t living with minor children.[85] On March 13, 2020, a federal district court issued a nationwide injunction blocking the new rule from taking effect until the court decided the case on its merits, and on October 18, the court struck down the rule.[86]
Meanwhile, the Families First Coronavirus Response Act, enacted in March 2020, temporarily suspended the SNAP three-month time limit nationwide as of April 1, 2020. The rapid increase and high levels of unemployment and unemployment claims as a result of the pandemic qualify nearly every state in the country to offer extended unemployment benefits, which also makes states eligible for statewide waivers from the three-month SNAP time limit. This has enabled adults without minor children to continue receiving SNAP benefits during the pandemic.
The Families First provision suspending the time limit is temporary, however. A longer-term solution is needed, given that the economic downturn’s impact on the job market for workers in low-wage occupations will likely endure for a period beyond the end of the pandemic.
Policymakers Should Eliminate or Significantly Revise Time Limit
Low-income adults not living with minor children, who generally have limited education, skills, and employment prospects even in normal economic times, aren’t well served by the nation’s system of economic and health supports. While most who can work do so, many remain extremely poor and struggle to meet basic needs. SNAP is one of the few forms of support available to them. But attempts at the federal and state levels to restrict states’ ability to protect unemployed adults from SNAP’s severe three-month time limit have caused serious hardship.
SNAP was created to protect the well-being and food security of low-income individuals and families by helping them afford a more nutritious diet. By restricting access to food assistance benefits, the time limit increases the risk of food insecurity and hunger for adults not living with minor children. The best course would be for Congress to eliminate the three-month time limit and restore access to food assistance benefits for these individuals on the same basis as applies to other non-elderly or disabled participants.
At a minimum, Congress should revise this rule to better accomplish its stated goal of testing individuals’ willingness to work. For example, Congress could make the three-month limit in a given state contingent on the state offering a qualifying job or training position to all non-disabled adults not living with minor children subject to the limit who don’t otherwise find work. This would establish a principle that indigent individuals shouldn’t be deprived of basic nutritional assistance simply because they can’t find a job or a place in a qualifying training or work program.
| APPENDIX TABLE 1 | ||||||
|---|---|---|---|---|---|---|
| Characteristics of Adult SNAP Participants Not Living With Minor Children Monthly averages | ||||||
| Adult SNAP Participants 18 to 64 Years Old Not Living With Minor Children | Adult SNAP Participants 18 to 49 Years Old Potentially Subject to the Time Limit | Adult SNAP Participants 50 to 64 Years Old Not Living With Minor Children | ||||
| Number (in millions) | Share | Number (in millions) | Share | Number (in millions) | Share | |
| Total | 4.9 | 100% | 2.8 | 100% | 2.1 | 100% |
| Sex: | ||||||
| Male | 2.5 | 50% | 1.5 | 53% | 1.0 | 46% |
| Female | 2.4 | 50% | 1.3 | 47% | 1.1 | 54% |
| Age: | ||||||
| 18-29 | 1.2 | 24% | 1.2 | 42% | - | - |
| 30-39 | 0.8 | 15% | 0.8 | 26% | - | - |
| 40-49 | 0.9 | 18% | 0.9 | 31% | - | - |
| 50-59 | 1.7 | 34% | - | - | 1.7 | 81% |
| 60-69 | 0.4 | 8% | - | - | 0.4 | 19% |
| Race/Ethnicity:* | ||||||
| White, not Latino | 2.3 | 46% | 1.2 | 43% | 1.1 | 46% |
| Black, not Latino | 1.2 | 25% | 0.8 | 27% | 0.5 | 25% |
| Latino (any race) | 1.0 | 19% | 0.6 | 21% | 0.4 | 19% |
| Asian, not Latino | 0.2 | 4% | 0.1 | 4% | 0.1 | 4% |
| Other, not Latino | 0.2 | 5% | 0.2 | 6% | 0.1 | 5% |
| Education:* | ||||||
| Less than high school | 1.1 | 25% | 0.6 | 24% | 0.5 | 25% |
| High school diploma or GED | 2.7 | 59% | 1.6 | 60% | 1.1 | 59% |
| Some college or college degree | 0.7 | 16% | 0.4 | 16% | 0.3 | 17% |
| Individuals with Income From: | ||||||
| Earnings | 1.3 | 25% | 0.8 | 27% | 0.5 | 24% |
| More than 20 hours a week*** | 0.7 | 15% | 0.5 | 16% | 0.3 | 14% |
| Less than 20 hours a week | 0.5 | 10% | 0.3 | 11% | 0.2 | 10% |
| TANF | ** | - | ** | 1% | ** | - |
| Social Security | ** | 1% | ** | - | ** | 1% |
| Supplemental Security Income | ** | - | ** | - | ** | - |
| Unemployment Insurance | 0.1 | 1% | ** | 1% | ** | 1% |
| Veterans Affairs | ** | - | ** | - | ** | - |
| Workers’ compensation | ** | - | ** | - | ** | - |
| Other governmental assistance, including General Assistance and energy assistance | 0.3 | 6% | 0.2 | 6% | 0.1 | 6% |
| Contributions and charity | 0.1 | 2% | 0.1 | 2% | 0.1 | 3% |
| Earned Income Tax Credit | ** | - | ** | - | - | - |
| Other non-governmental assistance, including child support and other unearned income | 0.2 | 4% | 0.1 | 3% | 0.1 | 5% |
| State diversion payments | ** | - | ** | - | - | - |
| Educational loans and grants | ** | - | ** | - | - | - |
| Deemed income | ** | - | ** | - | ** | - |
| No individual income, but other household members have income | 0.6 | 11% | 0.3 | 11% | 0.2 | 12% |
| Individuals with Household Gross Income as a Percentage of the Poverty Level: | ||||||
| Zero | 2.5 | 51% | 1.5 | 52% | 1.0 | 49% |
| 1 to 50% | 1.0 | 20% | 0.6 | 20% | 0.4 | 21% |
| 51 to 100% | 0.8 | 17% | 0.5 | 16% | 0.4 | 17% |
| More than 100% | 0.6 | 13% | 0.4 | 13% | 0.3 | 12% |
| Labor Force Status:* | ||||||
| Not in labor force | 2.0 | 40% | 1.0 | 36% | 0.9 | 45% |
| Unemployed and looking for work | 1.6 | 34% | 1.0 | 36% | 0.6 | 30% |
| Employed | 1.3 | 26% | 0.8 | 28% | 0.5 | 25% |
Inadequate Funding Prevents Federal Rental Assistance From Reaching Most Low-Income Adults Who Need It
By Alicia Mazzara, Erik Gartland, and Will Fischer
Some 2 million non-elderly adults without minor children at home receive federal rental assistance, which helps people with low incomes afford stable, decent-quality housing. But rental assistance is not an entitlement, meaning it is not available to everyone who is eligible. While a household must be “low income” — defined as having an income at or below 80 percent of the local median income — to begin receiving rental assistance, inadequate funding means that more than 4 in 5 households consisting of low-income, non-elderly adults without children who need rental assistance don’t get it. There are significant demographic differences between those who receive assistance and those who do not: rental assistance programs reach higher shares of people with disabilities, older non-elderly adults, people of color, and women compared to other non-elderly adults without children at home.
For those who do receive it, rental assistance is highly effective at reducing homelessness and housing instability. In addition, by lowering rental costs, it allows low-income people to spend more on other basic needs like food and clothing, research shows (although some of the research findings noted here are from studies of families with children; there is not always specific evidence that they apply to adults living without children). It can be an important support for low-paid workers, providing them with stable housing and freeing up resources for work expenses such as transportation. Rental assistance can also sharply reduce psychological distress among adults in homeless households, studies find, likely in part by easing the stress related to the risk of eviction, homelessness, and other housing instability. In addition, when rental assistance enables households to move to lower-poverty neighborhoods, adults can experience significant health improvements, such as lower rates of diabetes and extreme obesity and better mental health. Rental assistance is often a key component of supportive housing programs, which have been shown to reduce health care costs for some people who experience homelessness or frequent, ongoing institutionalization in nursing homes, mental health facilities, or jails.[87]
Many non-elderly adults without children at home have lost earnings and are struggling to afford rent due to COVID-19 and the accompanying recession. In addition, homeless adults and those residing in overcrowded housing or shelters face particular difficulties maintaining social distancing during the pandemic, making it even more urgent to help them afford safe, adequate housing. Because federal rental assistance programs are not entitlements, however, they do not automatically expand to assist more people when the need grows. Unless policymakers act to provide large-scale supplemental rental assistance funding, the number of people who need assistance but do not receive it will likely increase well above the figures reported in this analysis, which are based on pre-COVID data.
Background
People with rental assistance generally pay about 30 percent of their income toward rent and utilities — a widely used standard for the amount a household can reasonably be expected to pay for housing — and a federal subsidy covers the remaining cost. Most assisted households participate in one of three main programs:
(1) Housing Choice Vouchers help people rent modest units of their choice in the private market. Vouchers are administered by state and local housing agencies, which receive funding from the federal government to cover participants’ rent subsidies and the agencies’ administrative costs.
(2) Public housing, which provides affordable homes in buildings typically owned and managed by the local housing agency. The federal government each year provides agencies with operating subsidies to cover the cost of managing and maintaining the buildings (beyond the amount covered by the tenants’ rental payments) as well as capital subsidies to occasionally renovate them, although in both cases these amounts regularly fall short of the funds needed.
(3) Section 8 Project-Based Rental Assistance (PBRA), which provides long-term subsidies to largely private owners of rental housing who agree to keep rents affordable.
In each of these programs, the federal government only subsidizes a limited number of housing developments or units or — in the case of the voucher program — provides sufficient funds to assist a limited number of households. The number of eligible households far exceeds the total number assisted by all federal rental assistance programs combined, leaving many eligible households without assistance.
Federal law requires that 75 percent of households admitted to the voucher program and 40 percent of new public housing and voucher tenants be “extremely low-income” households (defined as those with incomes below the federal poverty level[88] or 30 percent of the area median income, whichever is higher), so most assistance goes to people well below the overall income limit of 80 percent of local median income. Some vouchers and developments are set aside for certain groups (such as people with disabilities, seniors, and veterans). Beyond that, state and local housing agencies have broad flexibility to determine which types of households on their waiting lists receive priority for assistance. In addition, some income-eligible people are not permitted to receive assistance, including some immigrants, people with histories of certain types of criminal activity, and full-time students living on their own (unless they are over 25 or meet certain other exceptions).
While the number of households struggling to afford housing has grown in recent decades, the number with rental assistance has been largely stagnant. Policymakers provide some added funding each year, but nearly all this goes toward increased per-household subsidies to cover the growing gap — due to inflation and other factors — between the cost of housing and the amount of rent assisted households can afford to pay. A small number of new vouchers are typically funded each year, mainly targeted on particular groups such as people with disabilities or chronically homeless veterans. This modest expansion is largely offset, however, by the loss each year of some units from public housing (as underfunding causes some buildings to deteriorate to the point where they must be demolished or sold) and from PBRA (as owners leave the program when they reach the end of their contracts).
Non-Elderly Adults Using HUD Rental Assistance Tend to Be Older, Women, People of Color, and Have a Disability
About 1 in 5 people receiving rental assistance through the Department of Housing and Urban Development (HUD) — around 2 million people — are non-elderly adults (aged 18 to 61) without minor children at home.[89]
Most of these adults have received HUD rental assistance for several years, and some previously had minor children in the home. Over 60 percent of these adults have been assisted for the past five years. Among adults receiving rental assistance between 2012 and 2017, about a third previously lived with children under 18 while assisted.[90] Some of these children may have grown up and moved out to attend school or start their own households while the parent remained in a HUD program.
Disability. Close to half (48 percent) of assisted non-elderly adults without children have a disability.[91] This is partly by design, as several HUD rental assistance programs are specifically designated for people with disabilities, such as HUD’s Supportive Housing for People with Disabilities. The Housing Choice Voucher program also sets aside a certain number of vouchers for people with disabilities and homeless veterans (many of whom have disabilities). HUD’s initiatives on ending chronic homelessness also target rental assistance to people with disabilities, as participating individuals must have a disability, among other criteria, in order to meet the definition of experiencing chronic homelessness. Finally, state and local housing authorities administering the voucher and public housing programs may also choose to prioritize people with disabilities when admitting renters from a waiting list for assisted housing.
Age. HUD-assisted non-elderly adults without children tend to be older. Nearly half (49 percent) of these adults are over age 49, and a third are over age 54.
Work status. Given that these adults are more likely to have a disability that could limit their ability to work, it is not surprising that this group is less likely to be employed than the HUD-assisted population overall. Among non-elderly adults without children and without a disability, 48 percent were either in school full-time, working, or had recently worked (defined as receiving Unemployment Insurance).[92]
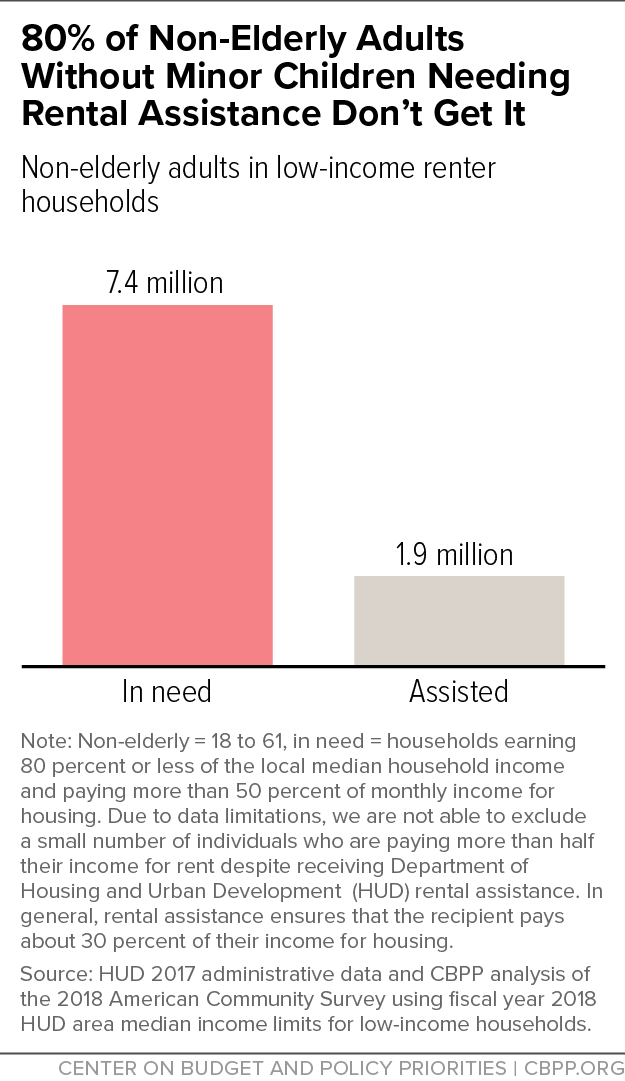
Sex, race, and ethnicity. Like most people receiving HUD rental assistance, these adults are disproportionately women and people of color. Sixty percent of HUD-assisted non-elderly adults without minor children identify as female. Two-thirds identify as a person of color, including 43 percent who identify as Black, non-Hispanic; 18 percent as Hispanic of any race; 3 percent as Asian or Pacific Islander, non-Hispanic; and 1 percent as Native American, non-Hispanic (see Table 1).[93]
Those receiving targeted assistance through smaller programs. At least 332,000 households also receive rental assistance through smaller federal rental assistance programs targeting specific populations, but data limitations prevent us from precisely identifying non-elderly adults without children in these households. The Department of Agriculture’s (USDA) Section 521 Rural Rental Assistance program targets cost-burdened renters (those paying more than 30 percent of their income in rent and utilities) in rural areas; it assisted 267,000 households in 2019, 65 percent of which were single-person households.[94] Housing Opportunities for Persons With AIDS (HOPWA) served 31,000 households in 2018, providing rental assistance and supportive services for low-income people living with HIV/AIDS.[95] The Indian Housing Block Grant (IHBG) provides funding to Indian tribes or their tribally designated housing entities to use for affordable housing activities benefiting low-income members of federally recognized tribes. This includes allocations to operate and maintain approximately 34,000 rent-assisted units and the option to provide additional tenant-based rental assistance, but there are no publicly available data on the number of households receiving IHBG-funded rental assistance or the share who are adults without children at home.[96]
Most Non-Elderly Adults Who Need Rental Assistance Don’t Get It Due to Inadequate Funding
The vast majority of unassisted[97] low-income[98] renter households do not receive it due to insufficient funding.[99] This is especially true for low-income renter households headed by non-elderly adults without children: over 80 percent of these households in need of assistance do not receive it.[100] (See Figure 12.) Some 7.4 million low-income working-age adults not living with minor children pay more than half of their income for rent.[101] This estimate is likely an undercount as it pre-dates the economic downturn caused by the COVID-19 pandemic; the number of people paying too much for housing will grow during this economic downturn, as it did during the Great Recession.[102] When housing costs too much, households spend less on food and health care.[103] And with little money left to cover other basic needs, these renters are often one financial emergency away from eviction or homelessness.[104]
Age and disability. Those with unmet housing needs are, in some ways, the demographic opposite of their counterparts receiving HUD rental assistance. The low-income adults with
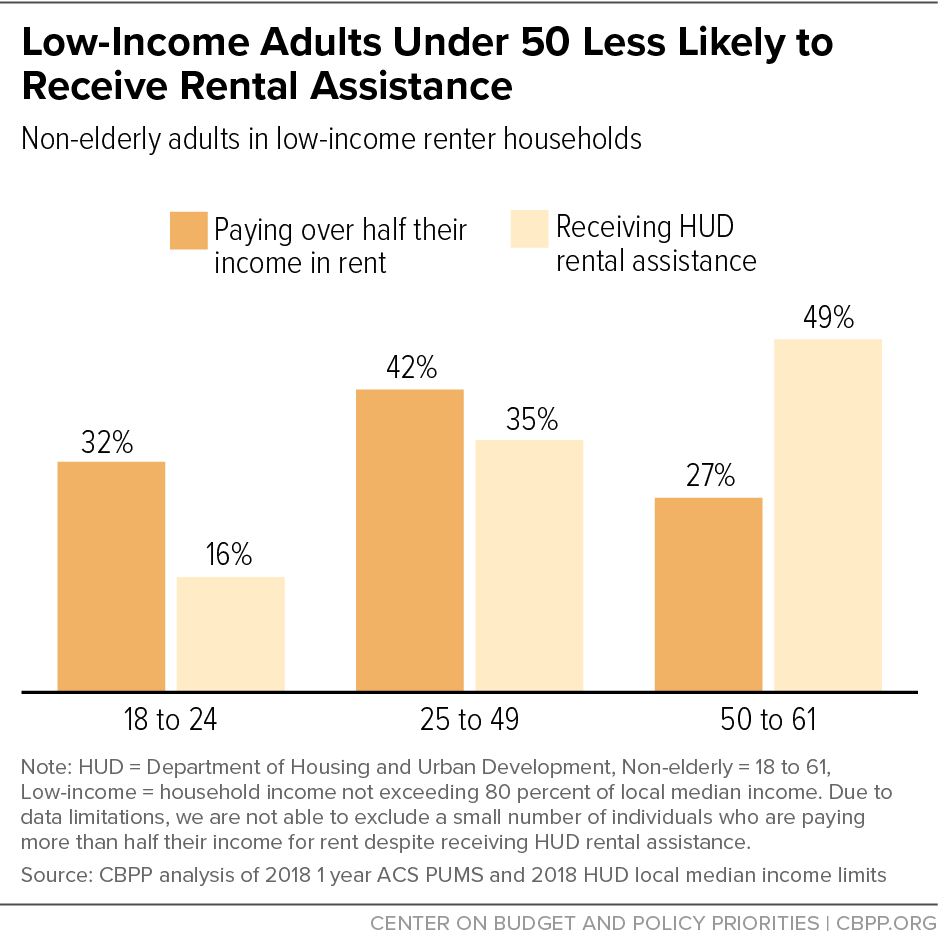
unmet housing needs tend to be much younger — over half (53 percent) are under age 35, and 32 percent are between the ages of 18 to 24. (See Figure 13.) This group has far lower incidence of disability — 20 percent — than the assisted population. As a result, these adults are more likely to work, though in jobs that do not pay enough to cover their housing costs. Among those without a disability, over 60 percent reported working in the last year;[105] these individuals lived in households with an annual income of roughly $16,600 in 2018. Work varies by age, with 70 percent of adults in their 20s working in the prior year, compared to 32 percent of adults in their early 60s.[106]
Sex, race, and ethnicity. Unassisted low-income, non-elderly adults without children are more evenly split by sex and are more likely to identify as white, as compared to those who receive rental assistance, the most recent Census data show. However, these data predate the COVID-19 pandemic, which is hitting Black, Latino, Indigenous, and immigrant renters especially hard, due in no small part to harsh inequities that often stem from structural racism.[107]
In 2018, slightly over half (52 percent) of unassisted low-income non-elderly adults without children identified as female. Nearly half identified as white, non-Hispanic (48 percent), 21 percent as Black, non-Hispanic, 18 percent as Hispanic of any race, 8 percent as Asian or Pacific Islander, and 1 percent as Native American.[108] See Table 1 for a comparison of those assisted and not assisted by race and ethnicity. Regardless of race or ethnicity, funding limitations prevent most unassisted working-age adults from receiving help.
| TABLE 1 | ||||
|---|---|---|---|---|
| Due to Funding Scarcity, Most Non-Elderly Adults Without Minor Children Do Not Receive Any Rental Assistance | ||||
| Adult Lives in a Low-Income Household That Is… | ||||
| Receiving HUD Rental Assistance | Paying More Than Half Its Income for Rental Housing | |||
| Race/Ethnicity | Total Adults | Share of Total | Total Adults | Share of Total |
| Asian, non-Hispanic | 52,000 | 3% | 623,000 | 8% |
| Black, non-Hispanic | 817,000 | 43% | 1,580,000 | 21% |
| Hispanic, any race | 342,000 | 18% | 1,360,000 | 18% |
| Multiracial, non-Hispanic | 13,000 | 1% | 197,000 | 3% |
| Native American, non-Hispanic | 13,000 | 1% | 45,000 | 1% |
| Pacific Islander, non-Hispanic | 6,000 | .3% | 15,000 | .2% |
| Some other race, non-Hispanic | 4,000 | .2% | 30,000 | .4% |
| White, non-Hispanic | 648,000 | 34% | 3,521,000 | 48% |
| Total | 1.9 million | 100% | 7.4 million | 100% |
People Experiencing Homelessness
As noted above, renters facing unsustainably high housing costs may be one financial emergency away from losing their home. Of the nearly 570,000 people who experienced homelessness on a given night in 2019, 400,000 (70 percent) were individuals who weren’t part of a family with children.[109] Due to data limitations, we are unable to estimate rates of homelessness among non-elderly adults without minor children, so we use individuals experiencing homelessness to approximate their experience.[110] While some of these individuals experiencing homelessness do receive shelter and housing support, they remain overrepresented in the overall population experiencing chronic homelessness, 91 percent of whom are individuals not living with minor children. They similarly are overrepresented among those experiencing unsheltered homelessness, 93 percent of whom are individuals not living with minor children.[111] In 2019, about half of the individuals experiencing homelessness were unsheltered — living in the streets, in cars, or in other places not designed for habitation. Another 40 percent were staying in shelters, while the remainder were in temporary forms of housing.[112]
People of color are more likely to experience homelessness, reflecting longstanding inequities that often stem from structural racism in education, employment, housing, and health care. As a result of those inequities, people of color often have fewer assets to fall back on during hard times, putting them at increased risk of housing instability, eviction, and homelessness. In particular, individuals who are Black, Native American, or Pacific Islander or identify as multiracial make up a disproportionate share of the overall homeless population. For example, Black individuals make up 13 percent of the U.S. population but more than 40 percent of the overall homeless population.[113] Overall, slightly more than half of individuals experiencing homelessness who are not living with minor children identified themselves as white (53 percent), while 34 percent identified as Black, 19 percent as Hispanic, 4 percent as Native American, 2 percent as Asian and Pacific Islander, and 6 percent as multiracial.[114]
Individuals experiencing homelessness were more likely to identify as male (70 percent), with 1 percent identifying as either transgender or nonbinary. Due to the stigma and discrimination they face, LGBTQ people are more likely than non-LGBTQ people to experience poverty, housing instability, and homelessness. These negative outcomes are often compounded by other forms of discrimination, leading to higher prevalence of housing instability among people of color and transgender people within the LGBTQ population.
While research on housing instability specifically among LGBTQ adults is limited, a recent study showed that transgender adults experience homelessness at far higher rates than cisgender adults.[115] Shelter access is particularly difficult for gender-diverse individuals, who are more likely to be unsheltered than cisgender individuals. Service providers often fail to meet the needs of LGBTQ people experiencing homelessness, many times lacking appropriate facilities and adequate sensitivity training for staff. As a result, transgender and gender-diverse individuals face potential discrimination based on gender identity, such as exclusion from single-gender shelters.[116]
Policymakers Should Expand Federal Rental Assistance to Address Large Unmet Need
Rental assistance helps millions of low-income, non-elderly adults without children at home afford decent, stable housing, but funding limitations leave many others without assistance they urgently need. These unassisted adults often cannot afford adequate housing without paying very high shares of their incomes for rent. As a result, many must divert funds from basic needs like food or clothing to pay the rent or live in overcrowded or unsafe housing, in shelters, or on the streets.
Due to our country’s long history of explicitly and implicitly racially discriminatory government housing policies, combined with ways in which racism has limited employment and wealth-accumulation opportunities for generations, these hardships fall most heavily on Black, Latino, and Indigenous people. Federal rental assistance has a good track record of serving renters of color, helping a larger share of those in need among renters of color than among white renters. Yet because the underlying need is so great, people of color still make up a disproportionate share of non-elderly adults without children who pay more than half their income for housing. With more resources, rental assistance could do much more to address racial inequity.
One important benefit of extending rental assistance to more non-elderly adults without children at home would be to provide added support to the large share of those adults who are working but struggling to make ends meet. Rental assistance would help protect these workers from eviction and other housing instability, and stable housing can make it much easier to hold a job or to find a new one. In addition, by reducing the amount workers must pay toward rental assistance, rental assistance can free up resources for employment-related expenses such as work clothing or transportation.
Policymakers should provide emergency vouchers and other rental assistance to help people struggling to afford housing during the pandemic and recession.[117] But it is also crucial that they prioritize permanent steps to extend assistance to a larger share of eligible low-income people, including the more than 7 million adults without children at home who need rental assistance but don’t receive it.
The most effective way to assist large numbers of additional households would be to expand the Housing Choice Voucher program, which can be scaled up quickly and cost-effectively because people use it to rent existing homes in the private market. For example, the Bipartisan Policy Center’s Housing Commission called in a 2013 report for extending the program to all households with incomes below 50 percent of the local median.[118] A major expansion of the voucher program also could be combined with the creation of a federal renters’ tax credit that states could allocate to property owners who agree to reduce rents for extremely low-income households to amounts they can afford.[119]
| TABLE 2 | ||||
|---|---|---|---|---|
| Low-Income, Non-Elderly Adults Without Children Receiving or in Need of Federal Rental Assistance | ||||
| State | Receiving HUD Rental Assistance | In a Low-Income Household Paying More than Half Their Income for Housing | Experiencing Homelessness | Share of Those Experiencing Homelessness Who Are Unsheltered |
| Alabama | 30,500 | 102,800 | 2,500 | 43% |
| Alaska | 3,300 | 14,100 | 1,400 | 19% |
| Arizona | 14,400 | 131,400 | 7,500 | 59% |
| Arkansas | 19,200 | 62,200 | 2,300 | 58% |
| California | 199,200 | 1,182,400 | 128,800 | 80% |
| Colorado | 21,600 | 145,100 | 7,300 | 28% |
| Connecticut | 32,400 | 74,700 | 2,100 | 22% |
| Delaware | 4,200 | 21,900 | 600 | 13% |
| District of Columbia | 14,900 | 30,900 | 3,900 | 16% |
| Florida | 64,000 | 482,400 | 21,300 | 53% |
| Georgia | 44,200 | 220,000 | 7,900 | 47% |
| Guam | 900 | - | - | - |
| Hawai’i | 7,600 | 32,900 | 4,400 | 72% |
| Idaho | 4,500 | 26,000 | 1,500 | 45% |
| Illinois | 85,400 | 280,100 | 6,500 | 28% |
| Indiana | 31,600 | 135,000 | 3,800 | 16% |
| Iowa | 14,400 | 55,800 | 1,600 | 11% |
| Kansas | 12,400 | 57,300 | 1,700 | 26% |
| Kentucky | 32,900 | 81,200 | 3,100 | 23% |
| Louisiana | 31,700 | 113,300 | 2,400 | 40% |
| Maine | 10,600 | 22,000 | 1,200 | 7% |
| Mariana Islands | 100 | - | - | - |
| Maryland | 38,300 | 116,100 | 4,700 | 26% |
| Massachusetts | 82,500 | 164,100 | 6,300 | 13% |
| Michigan | 52,200 | 197,700 | 5,200 | 11% |
| Minnesota | 34,300 | 101,700 | 4,600 | 32% |
| Mississippi | 19,400 | 65,100 | 1,000 | 50% |
| Missouri | 32,500 | 127,000 | 4,200 | 21% |
| Montana | 5,100 | 21,700 | 900 | 31% |
| Nebraska | 9,500 | 38,100 | 1,700 | 6% |
| Nevada | 8,800 | 78,700 | 6,600 | 57% |
| New Hampshire | 8,200 | 23,400 | 800 | 18% |
| New Jersey | 62,300 | 187,300 | 5,900 | 25% |
| New Mexico | 8,600 | 40,200 | 2,500 | 48% |
| New York | 274,700 | 625,000 | 42,100 | 10% |
| North Carolina | 42,100 | 205,200 | 6,900 | 29% |
| North Dakota | 4,700 | 19,500 | 400 | 1% |
| Ohio | 86,600 | 230,700 | 7,000 | 20% |
| Oklahoma | 19,000 | 70,000 | 3,100 | 36% |
| Oregon | 22,600 | 97,400 | 12,400 | 66% |
| Pennsylvania | 76,300 | 273,200 | 8,400 | 19% |
| Puerto Rico | 47,400 | - | 2,300 | 78% |
| Rhode Island | 14,500 | 20,800 | 700 | 9% |
| South Carolina | 19,900 | 97,500 | 3,300 | 43% |
| South Dakota | 5,000 | 16,500 | 700 | 30% |
| Tennessee | 38,100 | 136,200 | 5,600 | 38% |
| Texas | 86,300 | 559,300 | 19,600 | 56% |
| Utah | 7,500 | 50,900 | 1,900 | 21% |
| Vermont | 5,000 | 14,700 | 700 | 16% |
| Virgin Islands | 2,100 | - | - | - |
| Virginia | 36,800 | 171,500 | 3,700 | 23% |
| Washington | 38,100 | 181,800 | 16,000 | 56% |
| West Virginia | 14,400 | 39,600 | 1,100 | 20% |
| Wisconsin | 27,000 | 122,800 | 2,500 | 11% |
| Wyoming | 2,300 | 10,400 | 400 | 25% |
| Total* | 1.96 million | 7.38 million | 397,300 | 50% |
Strengthening the EITC for Low-Income, Non-Elderly Working Adults Would Boost Incomes and Reduce Poverty
By Kris Cox, Sam Waxman, Harjot Sodhi, and Stephanie Hingtgen
Non-elderly working adults not raising children in the home[120] are the lone group that the federal tax code taxes into or deeper into poverty, in part because they are excluded from the federal Earned Income Tax Credit (EITC). For low-income working families with children, the EITC encourages work, boosts income, and offsets federal payroll and income taxes. The EITC for non-elderly working adults not raising children, by contrast, is so small that it does these things to only a very limited degree. Today, in fact, the federal tax code taxes about 5.8 million of these adults aged 19 through 65 into or deeper into poverty.[121]
The EITC for non-elderly working adults not raising children was established in 1993 and has remained essentially unchanged since then. Congress has voted to expand the EITC for families with children several times since enactment of the tax credit, but has not approved any expansions for working adults not raising children. Under the current credit, many of these non-elderly working adults are left out of the credit completely, and for many of those who receive it, their credit is less than the federal payroll taxes (and federal income taxes, if any) they owe. As a result, the federal tax code drives the after-tax income of many of these adults below, or further below, the official poverty line.
During the current recession and public health crisis, federal policymakers should enact policies to minimize any increase in poverty, alleviate hardship, and boost economic activity. One way to minimize the number of people pushed into poverty by a recession is to stop taxing people in ways that drive their after-tax income below the official poverty line. To extend the benefits of the EITC for working adults not raising children to more such adults and to make its benefits more adequate, policymakers can consider increasing the rate at which the credit phases in, raising the maximum credit amount, and increasing the income level at which the credit phases out — as well as broadening the credit’s eligibility age range so adults somewhat younger than 25 and somewhat older than 64 can qualify for it. Doing so would also produce another positive result: it would supplement the limited earnings of several million low-wage working adults in jobs deemed “essential” during the pandemic, including people who prepare food, provide in-home health services, and handle, package, or transport goods, among other essential services.[122]
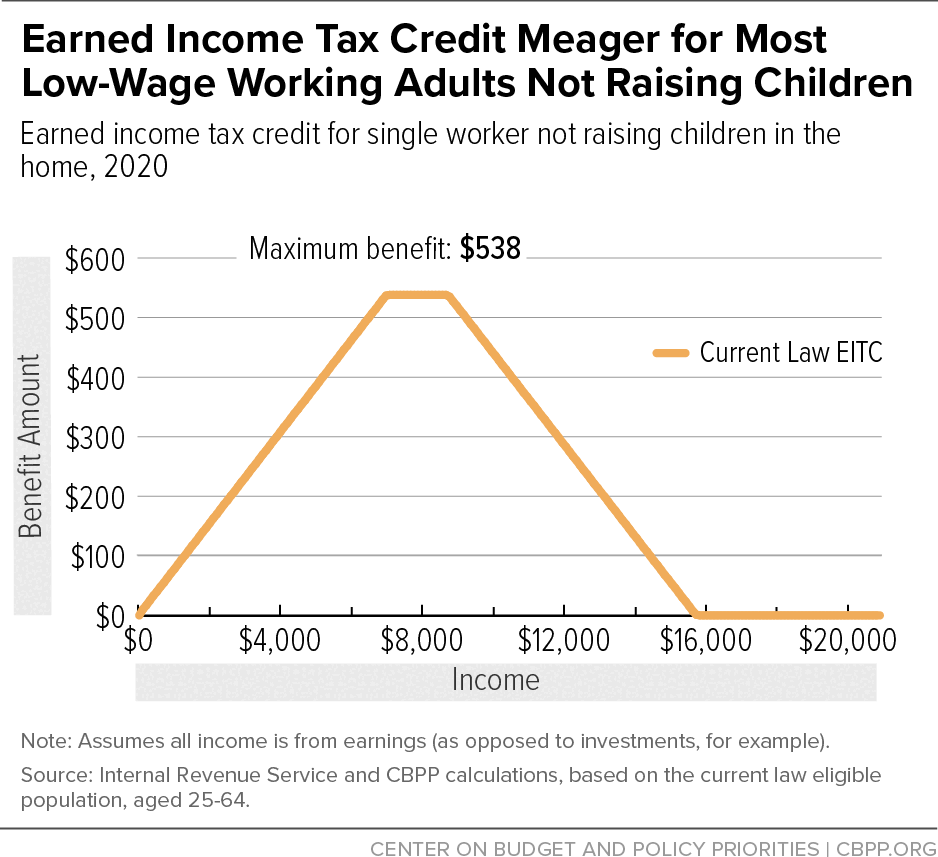
Background
The EITC is a federal tax credit for low- and moderate-income working people. Some states also provide a state EITC. The federal credit amount depends on a tax filer’s earnings, marital status, number of children, and age.[123] (Currently, adults must be between the ages of 25 and 64 to be eligible for the component of the EITC for working adults not raising children.) Working adults receive the credit beginning with their first dollar of earned income; the amount of the credit rises with earned income until it reaches a maximum level and then begins to phase out at somewhat higher income levels than that. (See Figure 14.) The EITC is “refundable,” which means that if the credit amount exceeds the amount of income tax a person owes, the IRS will “refund” the balance (i.e., will send the filer a check or a direct deposit for the balance amount).
An estimated 6.6 million low-wage working adults not raising children are eligible for the credit.[124] During the 2018 tax year, the average EITC for these filers was just $302. This is less than one-tenth the average $3,208 EITC for tax filers with children.[125] In part due to the disparate values of the credit, only about 65 percent of eligible tax filers without children claim the credit, compared to almost 85 percent of eligible tax filers with children.[126]
In contrast to the EITC for families with children, the EITC for working adults not raising children remains so small that people working full-time, year-round at the federal minimum wage — and making about $14,500 annually — receive hardly any EITC. (Such adults would receive the maximum EITC if they had children.)
Those working adults not raising children who are eligible for the credit are disproportionately people of color, largely due to historical discrimination and barriers to opportunity that have resulted in people of color being overrepresented in lower-wage occupations. Among current EITC-eligible adults not raising children, 20 percent are Black, 23 percent are Latino, and 48 percent are white. By comparison, Black, Latino, and white individuals represent 12 percent, 19 percent, and 60 percent, respectively, of the overall U.S. population. Working adults eligible for this component of the EITC are also more likely to have lower levels of education: 54 percent have a high school education or less, compared with 30 percent of the overall adult population.[127]
Several million working adults who are eligible for the tax credit work in essential jobs earning low pay, including as cashiers, cooks, janitors and cleaners, personal and home care aides, truck and delivery drivers, and child care workers (See Table 1.) These roles have been especially important during the pandemic and are central to everyday life during normal times as well.
| TABLE 1 | |
|---|---|
| Many Essential Workers Are Among Those Eligible for the EITC for Working Adults Not Raising Children at Home | |
| Occupation | Number of working adults |
| Cashiers | 369,000 |
| Cooks | 265,000 |
| Janitors and building cleaners | 232,000 |
| Laborers and hand freight, stock, and material movers | 211,000 |
| Retail salespersons | 208,000 |
| Personal and home care aides | 191,000 |
| Truck and delivery drivers | 177,000 |
| Nursing, psychiatric, and home health aides | 170,000 |
| Stock clerks and order fillers | 149,000 |
| Child care workers | 101,000 |
| Subtotal, essential workers | 2,073,000 |
| Total, All Occupations | 6,640,000 |
5.8 Million Non-Elderly Adults Not Raising Children Are Taxed Into or Deeper Into Poverty
Since enactment of the Tax Reform Act of 1986, federal income tax parameters have generally been designed to ensure that federal income and payroll taxes don’t tax people into or deeper into poverty. The glaring exception to this principle is non-elderly working adults not raising children in the home. Roughly 5.8 million of such workers aged 19 to 65 are taxed into or deeper into poverty, and they are disproportionately people of color — about 18 percent are Black and 26 percent are Latino, while 48 percent are white.[128]
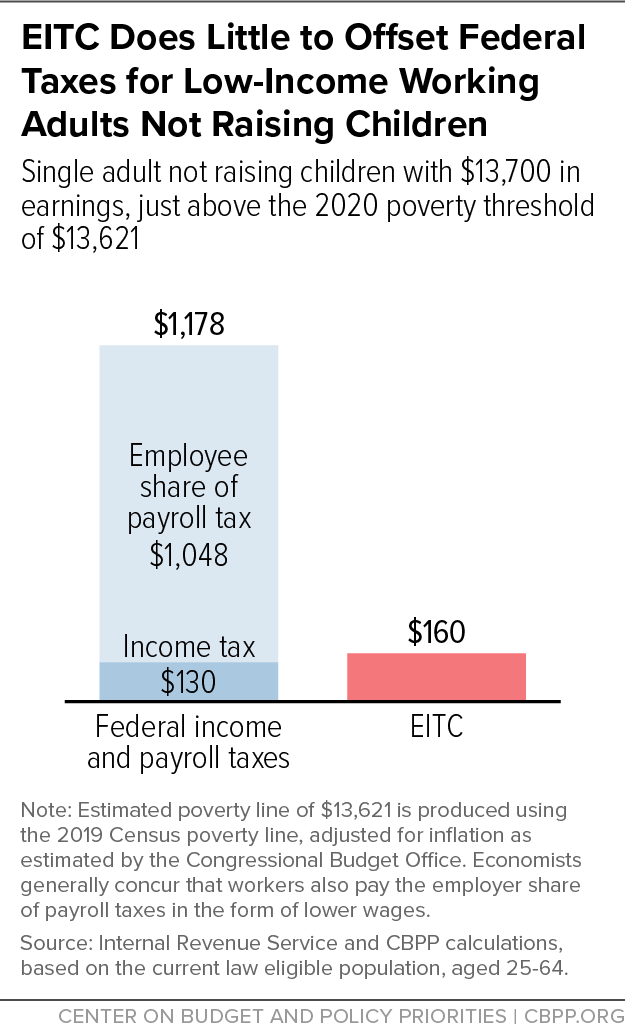
The standard deduction in the federal tax code is generally set at a level to ensure that families with children (as well as low-income seniors who receive most of their income from Social Security) don’t start owing federal income tax until their earnings exceed the official poverty line.[129] In addition, low-income working families with children generally can qualify for a substantial EITC and Child Tax Credit that offset their payroll tax liabilities and supplement their earnings. In contrast, single non-elderly adults not raising children begin owing federal income taxes when their earnings reach just $12,400 in 2020, some $1,220 below the official poverty line for a single adult.[130]
Consider, for example, a 21-year-old just starting out in the workforce as a manual laborer, earning just above poverty-level wages of about $13,700. This working adult has $1,048 in payroll taxes deducted from their paycheck and pays $130 in federal income taxes. Because they are under 25 and are thus ineligible for the EITC, they are taxed nearly $1,100 into poverty — that is, the taxes leave them nearly $1,100 below the official poverty line. A 30-year-old person making the same low wages in a retail store owes the same taxes, and while they do qualify for an EITC (they are age 25 or older), their credit is only $160 — with the result that they, too, are taxed into poverty. (See Figure 15.)
In large part due to its meager size and its eligibility limitations for working adults not raising children, the EITC does far less to lift families without children out of poverty than it does with respect to families with children. The EITC lifts about 21 percent of otherwise-poor families with children out of poverty, according to the Congressional Research Service. It lifts about 1 percent of households without children out of poverty.[131] (See Figure 16.)
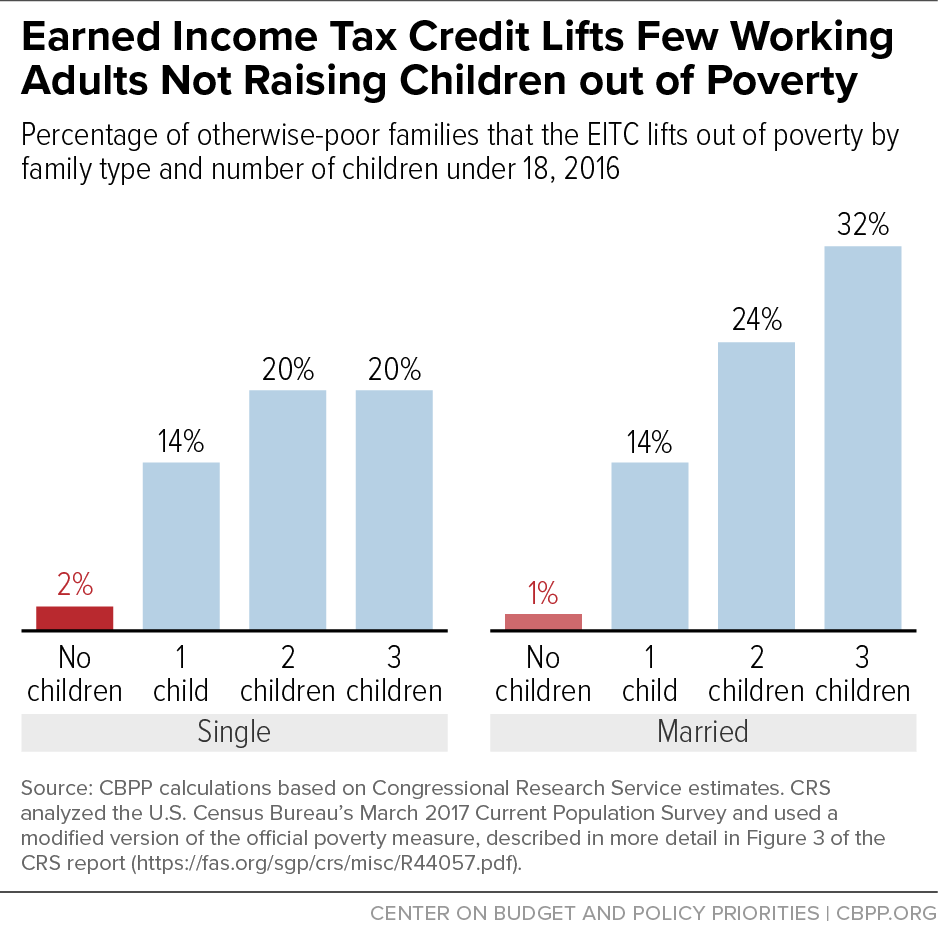
State EITCs Further Boost Incomes, Offset State and Local Taxes, and in Some Places Expand Eligibility
Twenty-nine states plus the District of Columbia and Puerto Rico have enacted their own version of the federal EITC, which tax filers can claim in addition to the federal tax credit.[132] State EITCs build on the success of the federal credit by helping people make ends meet, reducing hardship, pushing against racial, ethnic, and gender inequities, and keeping money flowing through local economies.
State EITCs are straightforward to administer and to claim. Most state EITCs are modeled directly on the federal EITC: they use federal EITC eligibility rules and are set at a specified percentage of the federal credit. Most are also refundable, helping to offset the state and local taxes that low-income households pay. In almost all states, lower-income households pay more as a share of their income in state and local taxes than do upper-income families (see Figure 17). This imbalance reflects states’ heavy reliance on sales, excise, and property taxes, all of which fall more heavily on families with lower incomes.[133]
Recognizing the small size of the federal EITC and its age restrictions for working adults not raising children, a number of states have made their state EITCs more inclusive than the federal EITC by extending the EITC for working adults not raising children to more of those adults or by increasing its size.[134] In the following states, policymakers have expanded eligibility for the state EITC to include these additional groups:
- California: Working adults aged 18-24 and working adults aged 65 and older.
- New Jersey: Working adults aged 21-24.
- Maine: Working adults aged 18-24. This credit is 25 percent of the federal credit (the credit size for families with children is 12 percent).
- Maryland: Working adults aged 18-24.
- Minnesota: Working adults aged 21-24.
- New York: Non-custodial parents of all ages.
- Washington, D.C.: The District’s expanded EITC for working adults not raising children phases in following federal guidelines, but the maximum credit extends to 150 percent of the official poverty line (for an individual), and the credit phases out entirely at twice the poverty line. This credit is set equal to 100 percent of the federal EITC. (The credit size for families with children is 40 percent.) D.C. also offers an EITC to non-custodial parents.
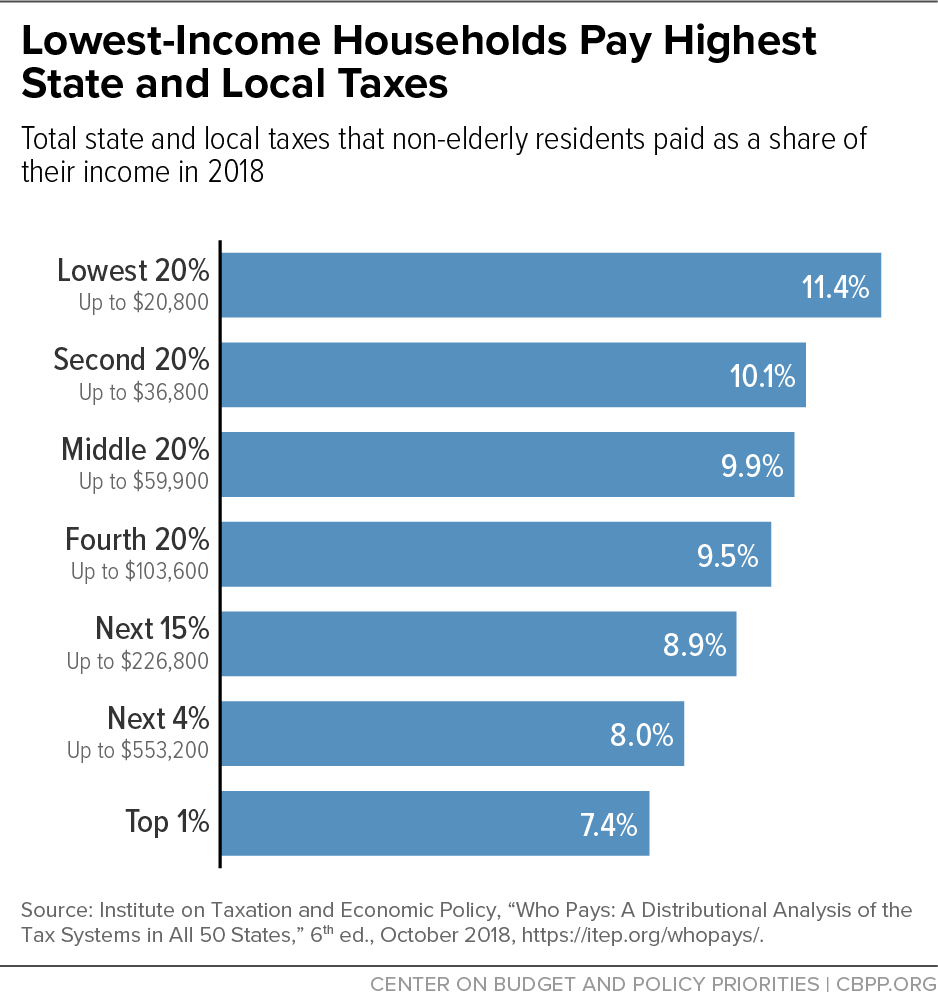
Various Proposals to Expand the EITC Would Benefit More Working Adults
A growing number of federal policymakers have come to recognize the problems of taxing non-elderly adults not raising children into (or deeper into) poverty and of failing to extend to them the stronger income boosts that the EITC provides for parents raising children. Proposals to strengthen the federal EITC for working adults not raising children also would have the benefit of improving state EITCs in most states, since most state-level credits build off of the federal credit. Various proposals to expand the federal EITC for these adults generally include the following elements:
An increase in the phase-in rate and a boost in the maximum tax credit. Under current law, the EITC for working adults not raising children phases in at a rate of 7.65 percent: a working adult receives an EITC equal to 7.65 cents for each dollar of their first $7,000 in earnings (in 2020). Several proposals would increase the phase-in rate to 15.3 percent and also raise the $7,000 threshold. That would enable the credit to fully offset a person’s payroll taxes (including both the employee and employer shares; most economists have concluded that the employer share of these taxes is largely passed on to employees in the form of lower wages than they would otherwise receive).
It also would result in an increase in the maximum credit. As a result of changes such as these, the maximum EITC for non-elderly adults not raising children, which today is $538, would rise under various of these proposals to levels such as $1,500 or $2,000.
- A modest increase in the income levels at which the EITC begins to phase down and then phases out. The current EITC for single, non-elderly adults not raising children phases out entirely at an income of $15,820 in 2020. Consequently, a single adult not raising children working full-time at the federal minimum wage receives hardly any EITC. Many proposals would raise the income level at which the EITC begins to phase out to roughly $11,500 and the level at which it phases and entirely to roughly $21,000.
- Expand age eligibility. Currently, adults must be between the ages of 25 and 64 to be eligible for the EITC for working adults not raising children. Various proposals would expand the age range to include younger and older working adults, particularly adults aged 19-24 (with some proposals extending the EITC to adults starting at age 18 if they are former foster youth) and adults age 65 or 66.[135]
State General Assistance Programs Provide Cash Aid to Few Low-Income Adults
By Liz Schott
State or local General Assistance (GA) programs provide basic cash assistance to very poor individuals who do not have minor children, are not disabled enough to qualify for (or do not yet receive) Supplemental Security Income (SSI), and are not elderly. There is no federally supported cash assistance program for this group. Thus, state or local General Assistance programs are generally the only cash assistance for which they might qualify. Yet only half the states provide any type of general assistance, and often it is available only to a very limited slice of those in need. Nationally, fewer than 500,000 individuals received GA support as of the end of 2019.
There are no national eligibility criteria because states or localities determine whether to provide GA and which groups of individuals to serve. Of the 25 states[136] with GA programs, only 11 provide benefits to individuals who do not have some disability or barrier to employment; the others only serve individuals the state has deemed “unemployable,” generally due to a physical or mental condition.[137] (See Figure 18.)
States, and sometimes counties or localities, set the level of GA benefits, which are extremely modest. In nearly all states with GA programs, the maximum benefit is below half of the poverty line, that is, below $532 a month for an individual; in half of those states, it is below one-quarter of the poverty line. In many states, benefit levels have not changed in decades and thus have shrunk significantly in inflation-adjusted terms. Some states have cut benefits further, reducing them in nominal dollars. Some other states have raised benefits at some point over the last 25 years, but generally not by enough to restore the lost purchasing power.
Moreover, the number of states offering GA programs has fallen considerably, from 38 to 25 since 1989, and many of the remaining programs are much weaker. Over the past three decades, some states have eliminated their General Assistance programs altogether, and others have cut funding, restricted eligibility, imposed time limits, and/or cut benefits.
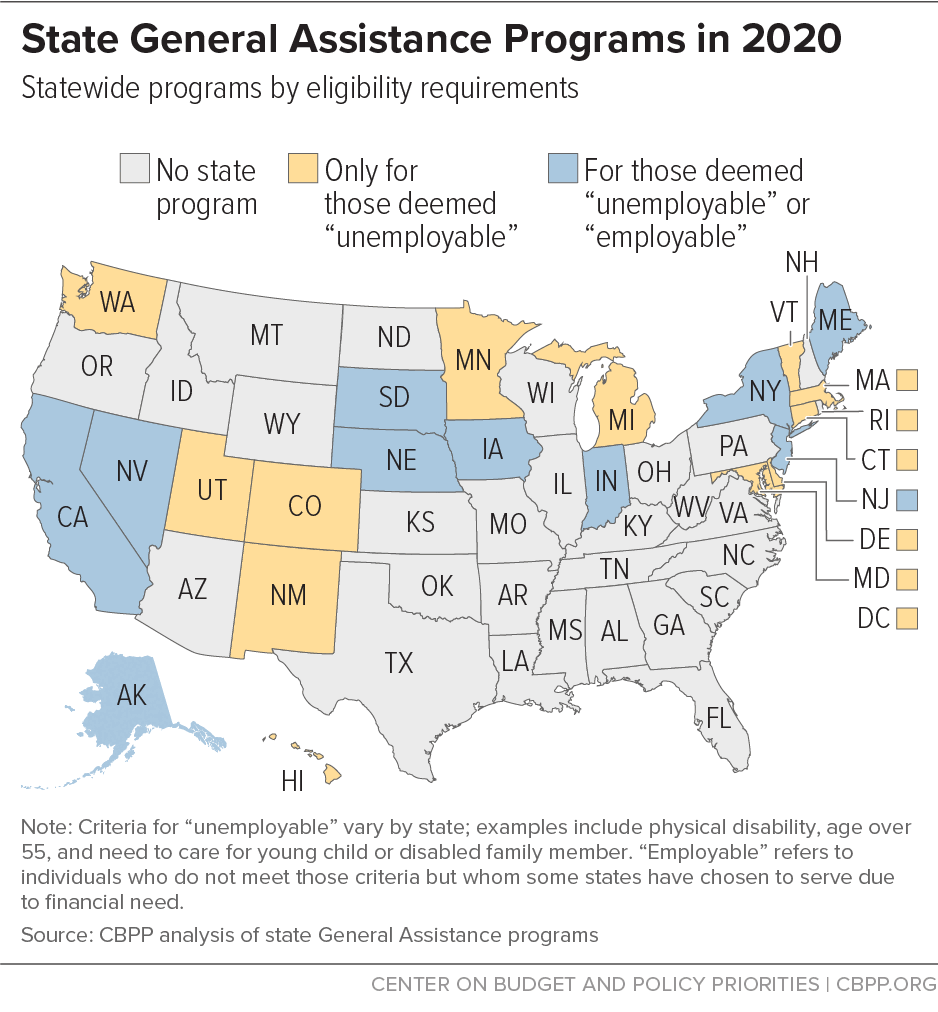
As the nation faces its most serious economic crisis since the Great Depression, General Assistance for people experiencing great need is unavailable in many states and very limited in most others. Amid the COVID-19 pandemic and the resulting recession, existing state-funded General Assistance programs are likely to face increased demand, yet they also are at risk of cuts due to the state fiscal crises triggered by the pandemic and recession.
Background
As of April 1, 2020, 25 states had a GA program that either operated statewide or was mandated and governed by statewide guidelines. (See Figure 18.) This section reviews key eligibility provisions for these states; see Appendix Table 2 for more details.[138]
Eligibility Groups
Every state General Assistance program assists individuals with disabilities. Some also assist other individuals.
Individuals with a disability. The GA programs in 25 states serve poor individuals who are unable to work due to incapacity or disability but are not receiving SSI. Some of these programs assist people deemed “employable” and people with a disability alike, based solely on financial need. Most, however, only serve individuals who have a disability or are otherwise deemed “unemployable.”
Programs limited to individuals with a disability require some type of medical documentation of incapacity. Most states require a minimum duration of disability — that is, the disability must be expected to last for anywhere from at least 30 days to at least 48 months, depending on the state. State policies also vary in the severity of the disability that qualifies an individual for General Assistance, ranging from a temporary inability to work due to incapacity to the much more severe SSI disability standard (a disability expected to last at least 12 months or to cause death). Some of the states using the SSI disability standard require GA recipients to apply for SSI, often requiring them to sign an interim assistance agreement to repay the state once they begin receiving SSI. Claims for SSI are often denied, and claimants face often long delays for SSI benefits as they pursue appeals.
- Other individuals deemed “unemployable.” In addition to individuals with a disability, seven states serve other categories of individuals who are deemed “unemployable” because they are, for example, over age 55, have a learning disability or limited literacy that prevents employment, or are needed at home to care for a young child or a family member with a disability.[139]
- Individuals deemed “employable.” Some 11 states assist individuals whom the state considers “employable” but who are ineligible for other cash public assistance programs, though benefits are very limited. (These states also serve those deemed “unemployable” in the same program or a separate one; some states have different eligibility criteria, benefit levels, or administrative structures for the two groups. For example, in New Jersey, maximum benefits are $185 per month for an “employable” recipient and $277 for an “unemployable” recipient.)
Time Limits
Seven of the 25 states with GA programs have statewide limits on how long an individual can receive aid, ranging from one month out of a year to five years total in a lifetime. Some of these states impose time limits on individuals whom the state has deemed “unemployable.” The length, nature, and application of time-limit policies vary across and within states.
- Who is subject to time limits? Maryland, Utah, and New Jersey apply time limits to all GA recipients. California, Colorado, Delaware, and Nevada apply different time-limit policies based on eligibility category. For example, in Los Angeles County, California, those deemed “employable” are subject to a time limit, while those deemed “unemployable” have no limit.[140]
- What is the duration of the time limits? Colorado, Delaware, and New Jersey impose cumulative time limits over an individual’s lifetime. For example, New Jersey has a lifetime limit of five years. California, Maryland, Nevada, and Utah have intermittent time limits; for example, in Maryland, individuals may receive benefits for 12 out of every 36 months.
Benefit Levels
General Assistance benefit levels are very low. Most state or county guidelines set maximum standard benefit levels. These maximum levels are below half of the federal poverty level for an individual in all but two states and below one-quarter of the federal poverty level in half of the programs.
Some of the states with the lowest benefits only serve individuals meeting the state’s criteria for disabilities or other specified work-limiting conditions, even though such individuals are, by definition, unable to supplement their benefits with earnings. (See Figure 19). For example, Delaware and Maryland, which serve only those deemed “unemployable,” set the maximum monthly benefit level at $79 and $185, respectively.
Some states provide benefits to recipients either in cash or through vouchers; others make all payments directly to landlords or service providers. GA benefits are intended to help recipients meet basic needs such as shelter and utilities, though the specific needs covered vary by state.
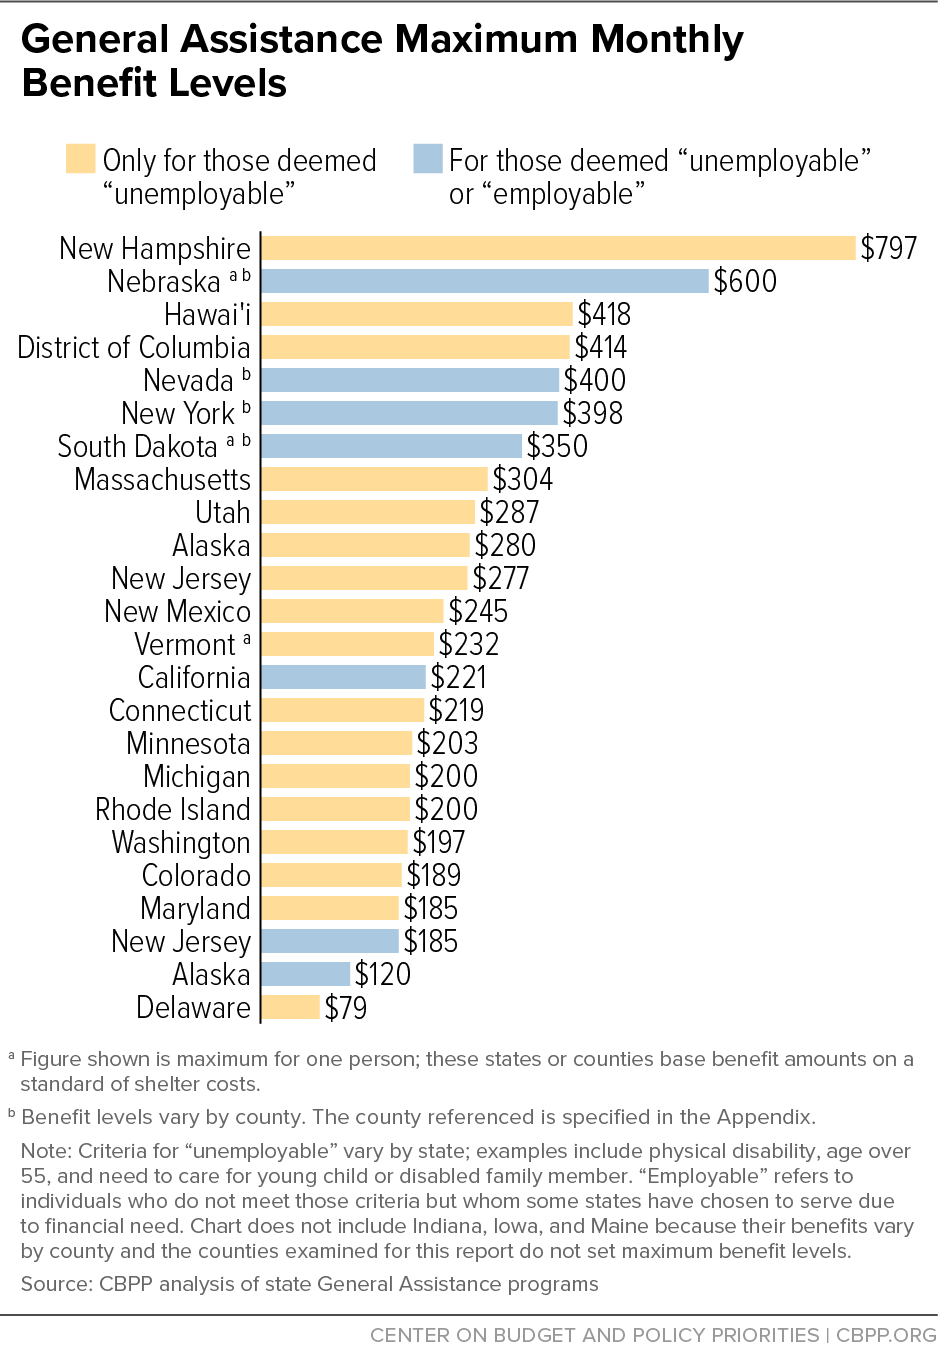
General Assistance Serves Few in Need
As a result of these limited programs, a very small slice of individuals in poverty who aren’t raising children receive General Assistance. Based on limited available information, we estimate that General Assistance reaches fewer than 500,000 individuals nationwide in a month.[141]
We have incomplete data on GA’s reach because no national reporting of cases is available, and states with county or local programs may not compile a statewide number. Based on the information we have collected for the states that provide a statewide GA program:
- For 17 of the 18 states that operate statewide uniform General Assistance programs, the combined GA caseload in December 2019 was about 255,000.[142] (See Appendix Table 2.) New York alone represents the majority of these, serving 136,058 cases as of December 2019.[143]
- With the exception of California, we do not have statewide caseload data for the seven states that have a statewide mandate for counties or localities to provide General Assistance but allow county or local variability. Given its population, California would account for a large number and share of these states’ GA recipients. In December 2019, California counties combined served 104,145 General Assistance cases.
- For the 26 states with no statewide GA program or mandate, a few may provide aid through a local or county program, although these do not appear to be common. We do not have information on the extent of such programs, their eligibility criteria, or their caseload numbers.
General Assistance Has Eroded Severely
General Assistance has become a much weaker element of the safety net over the years. Many states have eliminated their programs or scaled them back by reducing funding; imposing tighter eligibility restrictions, time limits, or both; and/or reducing benefits.
The last three decades show a gradual crumbling of access to state General Assistance, including during and after the Great Recession, despite high unemployment and a rise in the number of jobless workers who exhausted their unemployment insurance benefits. GA programs dropped from 38 in 1989 to 25 in 2020, and programs that include those deemed “employable” dropped from 25 to 11 over this same time period.
Almost all the states that did not eliminate their programs over the last two decades provide lower benefits now than in 1998, after adjusting for inflation, as Figure 20 shows. Among the 18 states for which we have comparable data, only in Maryland and the District of Columbia do benefits exceed the 1998 level, and Maryland’s benefits are extremely small: less than one-quarter of the federal poverty level.
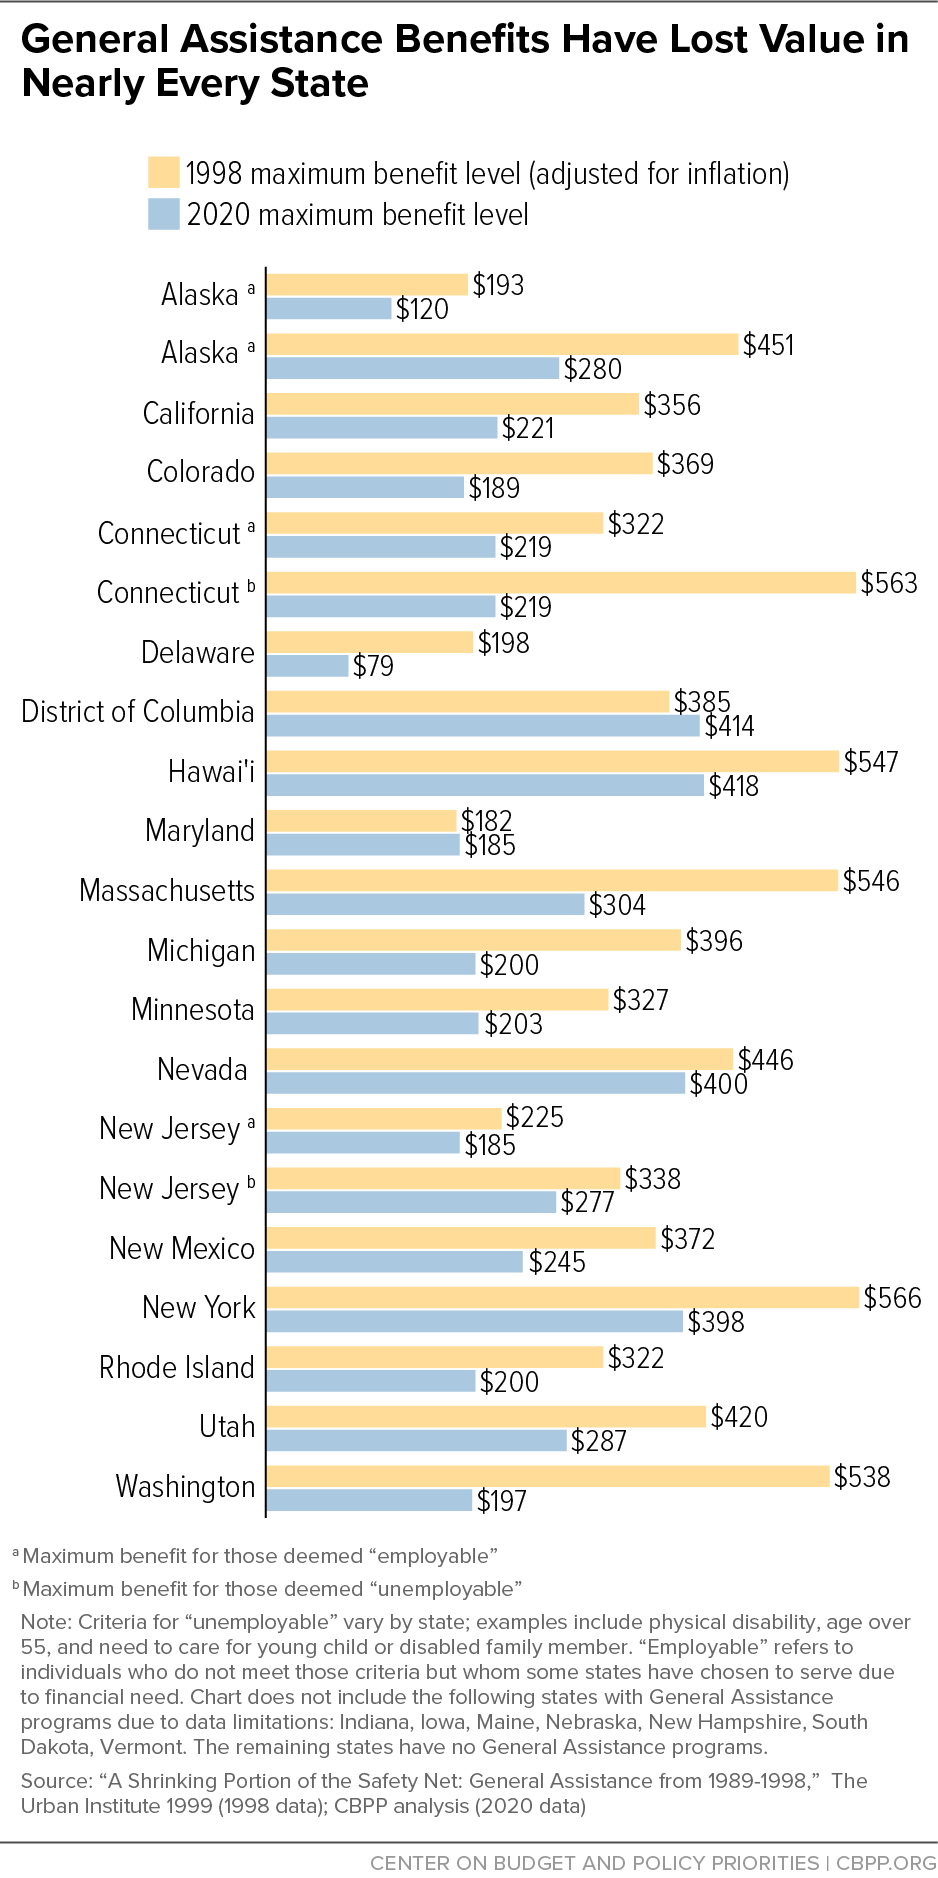
Since 2011, eight states have raised benefits in nominal terms (Colorado, Connecticut, District of Columbia, Nebraska, New Hampshire, New Jersey, New York, and Utah), while four states have cut them in nominal terms (Delaware, Michigan, South Dakota, and Washington).
Current Crisis Puts General Assistance Programs at Risk
General Assistance programs are likely to face two competing pressures as the nation continues to experience a high and prolonged period of unemployment as a result of COVID-19. First, particularly in states that serve those who are considered “employable,” caseloads are likely to increase as need remains high and unemployed workers lose or exhaust Unemployment Insurance benefits that have kept them from needing to rely on General Assistance.
At the same time, the remaining GA programs are at risk now, as states may cut these programs further in light of the health and economic crisis, which has caused a drop in state and local revenues. Because General Assistance benefits are solely funded with state or local dollars, they are particularly vulnerable to cuts during state fiscal crises. The likelihood of such cuts depends in part on the extent to which the federal government provides ample fiscal relief to states and localities to help them cope with the current crisis. The serious risk of cuts to these programs puts at risk economic security for the hundreds of thousands of individuals who rely on these benefits each month.
Appendix
Not all state programs are named “General Assistance.” We included state-funded programs available to individuals who are ineligible for other forms of cash public assistance, including programs such as Interim Assistance, State Disability Assistance, and Local Welfare (see Appendix Tables 1 and 2).
This report focuses on the 25 states with a statewide program or statewide mandate for county or local programs. Some counties in some other states may operate their own programs; Appendix Table 2 provides the information we collected but is not necessarily comprehensive. (We did not otherwise collect information on specific county programs.) In some cases, historical data from the Urban reports indicate that a county operated a program in the past but we were unable to determine whether it still does.
| APPENDIX TABLE 1 | ||||
|---|---|---|---|---|
| Summary of State General Assistance Programs as of April 2020 | ||||
| State Program Name | Uniform Statewide Program | State Mandate and Guidelines: Program Varies by County | No State Program or State Mandate for County Programs | |
| Alabama | N/A | X | ||
| Alaska | General Relief Assistance | X | ||
| Interim Assistance | X | |||
| Arizona | N/A | X | ||
| Arkansas | N/A | X | ||
| California | General Assistance or General Relief (GA/GR) | X | ||
| Colorado | Aid to the Needy Disabled | X | ||
| Connecticut | State Administered General Assistance (SAGA) | X | ||
| Delaware | General Assistance | X | ||
| District of Columbia | Interim Disability Assistance (IDA) | X | ||
| Florida | N/A | X | ||
| Georgia | N/A | X | ||
| Hawai’i | General Assistance | X | ||
| Aid to the Aged, Blind, and Disabled (AABD) | X | |||
| Idaho | N/A | X | ||
| Illinois | N/A | X* | ||
| Indiana | Township Poor Relief | X | ||
| Iowa | General Assistance | X | ||
| Kansas | N/A | X | ||
| Kentucky | N/A | X | ||
| Louisiana | N/A | X | ||
| Maine | Municipal General Assistance | X | ||
| Maryland | Temporary Disability Assistance Program (TDAP) | X | ||
| Massachusetts | Emergency Aid to the Elderly, Disabled, and Children (EAEDC) | X | ||
| Michigan | State Disability Assistance (SDA) | X | ||
| Minnesota | General Assistance (GA) | X | ||
| Mississippi | N/A | X | ||
| Missouri | N/A | X | ||
| Montana | Indigent Assistance or General Assistance | X* | ||
| Nebraska | General Assistance | X | ||
| Nevada | Financial Assistance | X | ||
| New Hampshire | Local Welfare | X | ||
| Aid to the Permanently and Totally Disabled | X | |||
| New Jersey | General Assistance (Work First NJ) | X | ||
| New Mexico | General Assistance | X | ||
| New York | Safety Net Assistance (SNA) | X | ||
| North Carolina | N/A | X | ||
| North Dakota | N/A | X | ||
| Ohio | N/A | X | ||
| Oklahoma | N/A | X | ||
| Oregon | N/A | X | ||
| Pennsylvania | N/A | X | ||
| Rhode Island | General Public Assistance (GPA) | X | ||
| South Carolina | N/A | X | ||
| South Dakota | County Poor Relief | X | ||
| Tennessee | N/A | X | ||
| Texas | N/A | X | ||
| Utah | General Assistance (GA) | X | ||
| Vermont | General Assistance (GA) | X | ||
| Virginia | General Relief | X* | ||
| Washington | Aged, Blind, and Disabled (ABD) | X | ||
| Housing and Essential Needs (HEN) | X | |||
| West Virginia | N/A | X | ||
| Wisconsin | N/A | X* | ||
| Wyoming | N/A | X | ||
| APPENDIX TABLE 2 | |||||||
|---|---|---|---|---|---|---|---|
| Details on State General Assistance Programs | |||||||
| State Program | Eligibility Criteria (in addition to financial need) | Duration of Incapacity | Benefit Levels (Max. for One Person) | Time Limits | December 2019 Caseload | ||
| Alaska | General Relief Assistance | Eligibility based solely on financial need | N/A | $120 | None; eligibility redetermined each month | 304 | |
| Interim Assistance | Elderly, blind, disabled, and awaiting SSI determination | Expected to last for at least 12 months or terminal | $280 | None, but eligibility ends upon final SSI determination | |||
| California (Los Angeles County) | General Assistance or General Relief (GA/GR) | Employable | N/A | $221 | 9 months in a 12-month period if employable. None for unemployable individuals | 104,145 | |
| Temporary Unemployable: temporary physical and/or mental incapacity preventing employment | Less than 12 months | ||||||
| Unemployable: physical and/or mental incapacity preventing employment | Expected to last for at least 12 months or is terminal | ||||||
| Colorado | Aid to the Needy Disabled | Age 18 – 59 with a disability that precludes working | 6 months or more | $189 | If the diagnosis is alcoholism or drug abuse, 12 cumulative months in a lifetime | 5,100* | |
| Connecticut | State Administered General Assistance (SAGA) | Unemployable: 1) severe physical and/or mental incapacity preventing employment, or 2) over 65; over age 55 and no recent work history; full-time high school student; needed at home to care for child under 2 or incapacitated spouse or child; or pending receipt of state or federal means-tested program | 6 months or more | $219 | None | 6,794* | |
| Short-term Transitional: physical and/or mental incapacity preventing employment | 2 to 6 months (must have recent work history) | $219 if applicant has a rental obligation; $55 if living rent-free | |||||
| Long-term Transitional: physical and/or mental incapacity preventing employment | 6 months or more | ||||||
| Delaware | General Assistance | 1) ill or incapacitated, preventing employment, or 2) appealing SSI or SSA decision (not to exceed 2 months); needed at home to care for child under 6 or an ill or incapacitated household member; over age 55; or full-time high school student | None specified | $79 | 2 months if appealing SSI/SSA decision; 24 months for high school students. None otherwise | 4,271 | |
| District of Columbia | Interim Disability Assistance (IDA) | Permanently and totally disabled and awaiting SSI determination | 12 months or more | $414 | None, but eligibility ends upon final SSI determination | 908 | |
| Hawai’i | General Assistance (GA) | Physically and/or mentally disabled (including drug abuse); unable to work more than 30 hrs/week; doesn't meet SSI requirements | 60 days or more | $348 | None | 5,949 | |
| Aid to the Aged, Blind, and Disabled | 65 or older; blind; or physically or mentally disabled and unable to work; or unable to work and has a terminal condition; or on Social Security or SSI but getting too little money; or living with and caring for an individual receiving AABD. | Expected to last for at least 12 months or terminal | $418 | None | |||
| Indiana (Center Township of Marion County) | Township Poor Relief | Based solely on financial need. Must seek and accept employment unless individual is disabled, a minor, over 65, or caring for incapacitated spouse or child | None | No overall maximum | None (each application is for one month's assistance) | N/A | |
| Iowa (Polk County) | General Assistance | Eligibility based solely on financial need | N/A | Varies widely by county. Annual maximum determined by Board of Supervisors in Polk County. | Varies by county. No time limit in Polk County; other counties have limits as low as one month out of each year. | N/A | |
| Maine | Municipal General Assistance | Eligibility based solely on financial need | N/A | Varies by locality (municipal ordinance) | None, but must renew application for assistance every 30 days | N/A | |
| Maryland | Temporary Disability Assistance Program (TDAP) | Physical and/or mental incapacity preventing employment | 3 months or more | $185 | 12 months out of a 36-month period unless pursuing or appealing SSI. If disabled 12 months or more, must file SSI application | 11,989 | |
| Massachusetts | Emergency Aid to the Elderly, Disabled, and Children (EAEDC) | 1) physical and/or mental incapacity preventing employment, or 2) over 65 years old and waiting for SSI payments; participating in a Massachusetts Rehabilitation Commission program; or needed at home to care for a child not related to the individual or an incapacitated individual | 60 days or more | $303.70 | None | 19,266 | |
| Michigan | State Disability Assistance (SDA) | 1) unable to work due to mental or physical disability, or 2) receiving disability-based Medicaid or reside in a special facility (such as a licensed Adult Foster care Home) | 90 days or more | $200 | None | 2,998 | |
| Minnesota | General Assistance (GA) | 1) has, or takes care of someone with, an illness or disability, or 2) awaiting determination for SSI or SSDI, or 3) in a mental, physical or drug rehabilitation facility or domestic violence shelter, or 4) unemployable, has a drug or alcohol dependency, has a learning disability, is over 55, is a displaced homemaker who is a full-time student, a high school student over 18 for whom English is not the first language, or under 18 and not living with family | 45 days or more | $203 | None | 22,244 | |
| Nebraska (Douglas County) | General Assistance | Eligibility based solely on financial need | N/A | Varies by county Douglas County (vendor payments only): Rent: $600 Non-food items: $25 | None for most counties (during last review, one county had a lifetime limit of 12 months; another had a limit of 6 months in 12-month period) | N/A | |
| Nevada (Clark County) | Financial Assistance | Employable | N/A | $400 | 1 month in 12- month period | N/A | |
| Employable with employment barrier | N/A | 3 months in 12- month period | |||||
| Unemployable: physical and/or mental incapacity preventing employment; or age 62 or older | Expected to last for at least 12 months or terminal | 6 months in 12- month period | |||||
| New Hampshire (City of Manchester) | Local Welfare | Eligibility based solely on financial need | N/A | Varies by county; City of Manchester provides vendor payments only | None | N/A | |
| Aid to the Permanently and Totally Disabled | Physical and/or mental incapacity preventing employment | Expected to last for at least 48 months or terminal | $797 | ||||
| New Jersey | General Assistance (Work First NJ) | Employable: single adults and couples without dependent children | None | $185 | 60-month lifetime limit | 9,925 | |
| Unemployable: individual doesn't need to meet work requirement if physical and/or mental disability prevents employment | 6 months or more | $277 | |||||
| New Mexico | General Assistance | 1) physical and/or mental incapacity preventing employment, or 2) dependent children who are ineligible for TANF and in financial need | 30 days or more | $245 | None | 2,501 | |
| New York | Safety Net Assistance (SNA) | Eligibility based on financial need for: single adults; couples without dependent children; children living apart from any adult relative; families of persons abusing drugs or alcohol; persons who have exceeded the 60-month limit for TANF; immigrants who are eligible for temporary assistance but not eligible for federal reimbursement | N/A | Varies by county New York City: $398 | None | 136,058 | |
| Rhode Island | General Public Assistance (GPA-Bridge) | Age 18-64; must have an illness, injury, or medical condition that precludes any working; must be applying for / awaiting SSI (with few exceptions for recipients of set-aside “Hardship Fund”); must have already been approved for Medicaid. Cannot be pregnant or live with a child under 18. | 30 days or more | $200 | None, but must renew eligibility after 6 months and reapply after 12 months | 148 | |
| South Dakota (Minnehaha County) | County Poor Relief | Eligibility based solely on financial need | N/A | $350 for housing | None; each request a one-time request | N/A | |
| Utah | General Assistance (GA) | Single individuals and married couples who have no dependent children residing with them 50% or more of the time and have a physical or mental impairment that prevents employment | 60 days or more | $287 | 12 months out of rolling 60-month period | 611 | |
| Vermont | General Assistance (GA) | 1) age 65 or older or has a dependent child under age 18, or 2) is not able bodied, or 3) is younger than 65, able-bodied, and the spouse or civil union partner of an SSI/AABD recipient or applicant who meets criterion 1 or 2 above, or 4) is younger than 65, able-bodied, but has two or more of the following employment barriers: 55 or older; illiterate or has no more than an 8th grade education; employed and/or full-time student for fewer than 6 months in the past 5 years; released from a mental health institution in the last 6 months; participating in a state or federally funded drug or alcohol treatment program | 30 days or more | Permanent housing: Chittenden County: $232 Other counties: $198 Groceries and personal needs: $56 for 28 days | None; each request a one-time request | 1,572 | |
| Washington** | Aged, Blind and Disabled (ABD) | 1) - age 65 or older, or 2) - blind, or 3) - has a long-term medical condition that is likely to meet SSA disability criteria Must be at least 18 years old or, if under 18, a member of a married couple | At least 12 months or terminal | $197 | None | 20,099 | |
| Housing and Essential Needs (HEN) | 1) - at least 18 years old or, if under 18, legally emancipated or a member of a married couple; and 2) - unable to work for at least 90 days due to a physical/mental incapacity | At least 90 days | Administered by local service providers such as community action agencies and aid is subject to funding | 3,845 | |||
Methodology
Poverty Measures
This paper makes extensive use of three poverty measures.
The first is the Census Bureau’s official poverty measure (OPM). Under this measure, a person is considered poor if their family’s annual cash income before taxes is below a set of official poverty thresholds, often referred to as the official poverty line, which vary by the family’s size and age composition. In the introductory chapter, we use these official poverty thresholds to define adults with low incomes when we discuss demographic and employment characteristics. We also use the official poverty thresholds in the Earned Income Tax Credit chapter to determine the number of people in poverty after accounting for taxes and tax credits.
We also use the Census Bureau’s Supplemental Poverty Measure (SPM), a more comprehensive measure of poverty. To better measure family resources, the SPM counts cash income as well as non-cash benefits such as food and rental assistance, accounts for taxes paid (or tax credits received), and subtracts from income certain non-discretionary expenses such as out-of-pocket medical costs. In setting its poverty thresholds, the SPM also makes other adjustments to factor in differences in housing costs across the country. We use the SPM poverty thresholds to analyze poverty trends in the overview chapter and the Supplemental Nutrition Assistance Program (SNAP) chapter.
Lastly, we use the Department of Health and Human Services’ poverty guidelines. These poverty guidelines, also referred to as the federal poverty level, are a simplified version of the Census Bureau’s official poverty thresholds; these guidelines are used for administrative purposes such as in determining program eligibility and/or benefit levels in many health care, nutrition, and other basic assistance programs. We utilize the federal poverty level when we reference the eligibility guidelines established for Medicaid, SNAP, federal rental assistance, and General Assistance.
Medicaid
The Affordable Care Act (ACA) gives states the option to expand Medicaid eligibility to low-income, non-elderly adults who do not have children of their own living in the home and who do not otherwise qualify for Medicaid for reasons such as having a federally recognized disability. We use the Kaiser Family Foundation’s state policy tracking efforts to identify the 36 states and the District of Columbia that had implemented the ACA Medicaid expansion option by October 2020.[144]
We then use the Census Bureau’s American Community Survey (ACS) data to identify Medicaid expansion adults and to provide demographic information for this group. Data limitations prevent us from reporting demographic breakdowns by sexual orientation or gender identity. For states that have expanded Medicaid to low-income adults under the ACA, we define Medicaid expansion adults as Medicaid enrollees who are aged 19 to 64, with family income at or below 138 percent of the federal poverty line, who are not living with children of their own in the home, do not receive Supplemental Security Income, are not enrolled in Medicare, and have not given birth to a child within the past year. For states that have not expanded Medicaid under the ACA, we define Medicaid expansion adults as those who are uninsured and otherwise meet the criteria described above. These are low-income adults who would be eligible for Medicaid coverage were their state to expand eligibility under the ACA option.
SNAP
We obtained SNAP participation data for 2019 from the U.S. Department of Agriculture’s administrative data. Data on the composition of SNAP households in 2018 were obtained from the U.S. Department of Agriculture’s 2018 SNAP Quality Control (QC) public-use data. These data are a nationally representative sample of SNAP case reviews, with detailed information on nearly 44,000 SNAP units and are used to assess the accuracy of state SNAP agencies’ eligibility and benefit determinations. Data limitations prevent us from reporting demographic breakdowns by sexual orientation or gender identity.
Disability. The QC data are limited in their ability to precisely define the universe of non-elderly adults between the ages of 18 to 64 who are not living with children and without severe disabilities, because the data do not directly identify the disability of individuals. The QC data identify individuals below the age of 60 who have a disability through combinations of receipt of Supplemental Security Income (SSI), veteran or workers’ compensation benefits, exemption from work registration due to a disability, or work of less than 30 hours a week. Furthermore, the QC data do not define disability statuses for individuals 60 years and older. As a result, the QC data likely underestimate the number of SNAP participants with disabilities. In our analysis, we retained the original QC disability variable for the individuals below the age of 60. For individuals 60 to 64 years of age in the QC data, we defined them as disabled if they receive SSI, Social Security, veteran or workers’ compensation benefits, or are federally exempted from work due to a disability. As with the QC data, our analysis likely underestimates the number of SNAP participants in the 18 to 64 age group who are disabled.
Adults subject to the time limit. Our analysis likely overestimates the number of non-elderly adults aged 18 to 49 not living with children and without severe disabilities who are potentially subject to the time limit. This is because the QC data do not identify all of the possible exemptions from the time limit for this group, such as pregnancy, the inability to work due to a physical or mental limitation, or a state grant of a discretionary exemption. The limitations in the QC data on identifying disability status apply to this group as well.
Education and labor status. In Appendix Table 1 of the SNAP chapter, the shares of education and labor force status were calculated using the individuals in the QC data for which this information was known: for the larger group of adults aged 18 to 64 not living with children and without disabilities, the group of adults aged 18 to 49 potentially subject to the time limit, and the group of adults aged 50 to 64 not living with children and without disabilities. In the QC data, the education status was unknown for about 7 percent of individuals in each group, and the labor force status was unknown for fewer than 0.05 percent of individuals in each group.
Work status. To determine the level of work among adults potentially subject to the time limit, we used the Census Bureau’s 2014 Panel of the Survey of Income and Program Participation (SIPP). We replicated this group in the SIPP and analyzed their working hours using March 2015 as the reference month of SNAP receipt.
Race and ethnicity. In the QC data, the race and ethnicity data are unreported for 13 percent of the larger group of adults aged 18 to 64 not living with children and without disabilities, 12 percent of the group of adults aged 18 to 49 potentially subject to the time limit, and 14 percent of the group of adults aged 50 to 64 not living with children and without disabilities. To compensate, we replicated all three groups in the 2019 American Community Survey (ACS) 1-year Public Use Microdata and calculated the shares for each group by race and ethnicity using that dataset. We then applied these shares to the total numbers of SNAP recipients obtained from the QC data for each group. The resulting estimates by race and ethnicity are shown in Appendix Table 1 of the SNAP chapter.
Federal Rental Assistance
Individuals Receiving Federal Rental Assistance
We relied on non-public administrative datasets for 2012 and 2017 from the Department of Housing and Urban Development (HUD) (available through a research agreement); HUD’s 2018-2019 National Housing Opportunities for Persons with AIDS Performance Profile; HUD’s FY 2020 Indian Housing Block Final Allocation Summaries; and USDA’s 2019 Multi-Family Fair Housing Occupancy Report to calculate the number of non-elderly (age 18-61) adults without minor children at home receiving federal rental assistance. We used the non-public administrative dataset to analyze demographic characteristics of households using HUD rental assistance. We report the sex, race, and ethnicity categories HUD uses in its data but acknowledge that these terms may not accurately describe how all assisted people would self-identify. Data limitations prevent us from reporting any demographic breakdowns by sexual orientation or gender identity.
Federal rental assistance programs use a somewhat more expansive definition of disability than programs that require that a person receive SSI or Social Security Disability Insurance to qualify as having a disability. Federal rental assistance programs consider a person to have a disability if they have one or more of the following:
- a disability as defined in Section 223 of the Social Security Act;
- a physical, mental, or emotional impairment that is expected to be of long-continued and indefinite duration, substantially impedes their ability to live independently, and is of such a nature that such ability could be improved by more suitable housing conditions;
- a developmental disability as defined in Section 102 of the Developmental Disabilities Assistance and Bill of Rights Act; and/or,
- Acquired Immune Deficiency Syndrome (AIDS) or any condition that arises from the etiologic agent for AIDS.
For this analysis, we looked at individuals using HUD rental assistance over the past six years of available data (2012-2017). Individuals in older HUD administrative records do not have a unique identifier, so we matched individuals in the 2012 administrative records to individuals in the 2017 records using a unique identifier for the household, plus the individual’s date of birth and sex. We were unable to match records for approximately 50,000 individuals who appeared to be sets of twins; most of these individuals were children under 18 and were therefore dropped from the analysis.
Individuals Likely Unassisted and in Need of Rental Assistance
We relied on the 2018 American Community Survey Public Use Microdata Sample, 2018 HUD area median incomes for counties and metropolitan areas, 2018 HHS federal poverty guidelines, and 2019 HUD Point-in-Time Count data to estimate the number of low-income, non-elderly adults who are likely unassisted and in need of rental assistance. We consider people experiencing homelessness and people in low-income households paying more than half their income for housing to need rental assistance. In general, rental assistance ensures that recipients pay about 30 percent of their household income for housing. Due to data limitations, we are not able to exclude a small number of individuals and households who are paying more than half their income for rent despite receiving HUD rental assistance.
We use HUD’s definition of low income, which refers to households earning less than 80 percent of the local county or metropolitan area median income, adjusted for household size. We report the sex, race, and ethnicity categories the Census Bureau uses in its data but acknowledge that these terms may not accurately describe how all individuals would self-identify. We consider someone to have a disability if they meet one of the six American Community Survey disability criteria: https://www.census.gov/topics/health/disability/guidance/data-collection-acs.html.
EITC
We estimate the number and characteristics of people who are eligible for the EITC using data from the U.S. Census Bureau’s March 2019 CPS, based on 2020 tax parameters and adjusting incomes to 2020 dollars using the CPI-U. We use the CPS data rather than IRS administrative data chiefly because the CPS contains data on characteristics such as race, education, and occupation, whereas IRS administrative data on people who claim the EITC do not. Because the CPS does not ask individuals about their income taxes, we identify people likely eligible for the EITC under 2020 IRS rules using income, age, family relationship, school enrollment, and disability status data provided by Census. We construct tax filing units — i.e., the group of people who would file taxes and claim the EITC together — using survey information about spouses and likely dependents, drawing in part on tax dependency relations identified by Census. When identifying people taxed into (or deeper into) poverty, we use Census estimates of survey respondents’ federal income taxes (after the EITC) and payroll taxes. We limit all estimates to working adults with one or more weeks of work in the year.
One limitation to using CPS data is that our estimates are based on eligibility rather than the actual number of claimants. These estimates may not align with IRS figures on actual EITC claims for a number of reasons. Not all filers claim tax credits for which they are eligible; some families may claim credits for which they are not eligible (for example, because of confusion about the credit’s complex eligibility rules); and some eligible EITC filers may be misclassified as ineligible in our calculations because, for example, the survey data list a qualifying child of a divorced parent as living with their other parent, who shares legal custody. Income definitions may differ in IRS and Census data and people may also recall income amounts differently when asked in a survey. (Our estimates also do not take into consideration potential shifts in eligibility due to the COVID-19 recession; the March 2019 CPS data that we use are the most recent CPS data available.) Data limitations prevent us from reporting demographic breakdowns by sexual orientation or gender identity.
We use administrative data from the IRS Compliance Data Warehouse to obtain the average EITC amounts claimed by filers with and without children. These are unpublished IRS data as of September 29, 2020, after IRS math error corrections (such as immediate checks for valid Social Security numbers) and before other adjustments associated with errors in claims (which take longer to process), by state, filing status, and number of qualifying children, for tax year 2018.
Estimates of non-elderly working adults not raising children in the home who are eligible for the EITC under current law count those aged 25 to 64 (or with a spouse in that age range), reflecting current age eligibility criteria. Estimates of those who are taxed into, or deeper into, poverty count all workers aged 19 to 65 (excluding full-time students aged 19 to 23) for whom federal income tax liability (if any) and the employee share of the payroll tax reduce their tax unit’s estimated cash income after taxes from above to below (or from below to further below) the Census Bureau poverty thresholds. Full-time students aged 19 to 23 are excluded because they can be claimed by their parents as qualifying children for the larger EITC for families with children. Poverty status is determined at the level of the tax filing unit. We use the 2019 Census official poverty threshold appropriate for the tax unit based on the number and age of the tax unit members, inflated to 2020 dollars using CPI-U.
General Assistance
We collected information on General Assistance current policies for 2020 by checking state and county public assistance agency websites (including manuals and rules) and, where needed, directly contacting agencies in states to seek or confirm information. We looked at policies and benefit levels as of April 2020. In a similar manner, we collected data on caseloads as of December 2019 in order to have a common point in time for which data are available.
Not all state programs are named “General Assistance.” We included state-funded programs available to individuals who are ineligible for other forms of cash public assistance, including programs such as Interim Assistance, State Disability Assistance, and Local Welfare (see Appendix Tables 1 and 2 of the General Assistance chapter).
For historical information, we relied on reports from the Urban Institute, which include information for 1998 and comparative information back to 1989. Urban has published several comprehensive national surveys of General Assistance programs; its most recent published data are from a 1998 survey of states and a shorter policy brief. [145] Because we compared 2020 program information to Urban’s 1998 and 1989 data, we generally followed Urban’s classifications for states with county variability and gathered information for the same county used for the earlier Urban reports (which was, and often still is, the county with the largest population). In some cases, we included different information or classified it differently than in the earlier Urban reports.[146]
This report focuses on the 25 states with a statewide program or statewide mandate for county or local programs. Some counties in some other states may operate their own programs; Appendix Table 2 of the General Assistance chapter provides the information we collected but is not necessarily comprehensive. (We did not otherwise collect information on specific county programs.) In some cases, historical data from the Urban reports indicate that a county operated a program in the past but we were unable to determine whether it still does.
Acknowledgements
The authors could not have developed and presented the analyses and recommendations in this report without the advice and assistance of many CBPP colleagues. Many thanks to Robert Greenstein, Founder and President Emeritus, and Sharon Parrott, President, for graciously providing insight and guidance. Thanks, too, to Aviva Aron-Dine, Peggy Bailey, Ed Bolen, Eleanor Bragg, Jesse Cross-Call, Stacy Dean, Joel Friedman, Chuck Marr, Laura Meyer, Ann Oliva, LaDonna Pavetti, and John Wancheck for their critical input. Arloc Sherman, Claire Zippel, and Matt Saenz provided high-quality data and information on general characteristics and poverty trends. The authors also wish to express gratitude to Michele Vaughn and John Springer for their invaluable editorial assistance and to Liv Garahan for her graphic design expertise.
Finally, we are deeply grateful to the Bill & Melinda Gates Foundation for its generous support that has made this report possible.
End Notes
[1] In this chapter and the other chapters of this report, depending on the policy area or data available, we distinguish between the presence in the family unit of a non-elderly adult’s own children (or other children who are the adult’s dependents) and the presence of any children regardless of their relationship to the non-elderly adult. We use “low-income, non-elderly adults who don’t have minor children in the family” to broadly describe the group, irrespective of the specific program area. We use “low-income, non-elderly adults without children” in subsequent references.
[2] This paper makes extensive use of three poverty measures. The first is the Census Bureau’s official poverty measure (OPM). Under this measure, a person is considered poor if their family’s annual cash income before taxes is below a set of official poverty thresholds, often referred to as the official poverty line, which vary by the family’s size and age composition. We also use the Census Bureau’s Supplemental Poverty Measure (SPM), a more comprehensive measure of poverty. To better measure family resources, the SPM counts cash income as well as non-cash benefits such as food and rental assistance, accounts for taxes paid (or tax credits received), and subtracts from income certain non-discretionary expenses such as out-of-pocket medical costs. In setting its poverty thresholds, the SPM also makes other adjustments to factor in differences in housing costs across the country. Lastly, we use the Department of Health and Human Services’ poverty guidelines. These poverty guidelines, also referred to as the federal poverty level, are a simplified version of the Census Bureau’s official poverty thresholds; these guidelines are used for administrative purposes such as in determining program eligibility and/or benefit levels in many health care, nutrition, and other basic assistance programs. In this chapter, we use the official poverty thresholds to define adults with low incomes when we discuss demographic and employment characteristics. We use the SPM poverty thresholds to analyze poverty trends. Finally, we utilize the federal poverty level when we reference the eligibility guidelines established for Medicaid, the Supplemental Nutrition Assistance Program, federal rental assistance, and General Assistance.
[3] This is compared to an uninsured rate of 7 percent for children. Medicaid income eligibility limits for children are considerably higher than those for non-elderly adults without disabilities — including non-elderly adults living with children — especially in states that haven’t adopted the ACA’s Medicaid expansion. The minimum Medicaid income limit for children is 138 percent of the federal poverty level, and in most states the income limit is substantially higher than that, especially when eligibility for the Children’s Health Insurance Program (CHIP) is taken into account. By contrast, in states that haven’t adopted the Medicaid expansion, the Medicaid income limit for non-elderly, non-disabled parents who live with children is only 41 percent of the federal poverty level in the median such state.
[4] Sharon Parrott et al., “More Relief Needed to Alleviate Hardship: Households Struggle to Afford Food, Pay Rent, Emerging Data Show,” CBPP, July 21, 2020, https://www.cbpp.org/research/poverty-and-inequality/more-relief-needed-to-alleviate-hardship.
[5] Analyses in this report using the U.S. Census Bureau’s Survey of Income and Participation (SIPP) exclude those receiving income from SSI or SSDI, while analyses using the CPS Annual Social and Economic Supplement exclude those who receive income from Social Security or SSI due to data limitations. When calculating the number of adults who do not receive Social Security and SSI, we also exclude those who receive early Social Security retirement benefits at ages 62, 63, and 64.
[6] CBPP analysis of U.S. Census Bureau’s March 2018 Current Population Survey (accessed via IPUMS-CPS). The weighted average official poverty threshold in 2017 for a one-person household is $12,752. We multiply this by 2 to estimate 200 percent of the poverty threshold in 2017 ($25,504).
[7] The SPM poverty rate is different from the official poverty line. See footnote 2.
[8] The SPM poverty rate for non-elderly adults with children cited here does not include non-elderly adults who do not have children in their SPM family unit but are living in a home that includes children.
[9] The figures in this paragraph use the Census Bureau’s Supplemental Poverty Measure. See footnote 1. While the analysis is for 2017, it uses anchored 2019 poverty thresholds. In 2019, the SPM poverty threshold for a two-adult, two-child family renting in an average-cost community was $28,881. In 2019, the SPM poverty threshold for a one-adult family with no children renting in an average-cost community was $13,386.
[10] CBPP analysis of U.S. Census Bureau’s March 2018 Current Population Survey (accessed via IPUMS-CPS). The figures in this paragraph use the Census Bureau’s official poverty thresholds. See footnote 2.
[11] “Policy Basics: Supplemental Security Income,” CBPP, February 6, 2020, https://www.cbpp.org/research/social-security/policy-basics-supplemental-security-income.
[12] “Policy Basics: Social Security Disability Insurance,” CBPP, July 29, 2020, https://www.cbpp.org/research/retirement-security/policy-basics-social-security-disability-insurance.
[13] It is not uncommon for an individual to be considered to have a disability under one set of disability criteria but not under another. For more, see Danielle M. Taylor, “Americans with Disabilities: 2014,” U.S. Census Bureau, Current Population Reports, P70-152, November 2018, Table A-3, https://www.census.gov/content/dam/Census/library/publications/2018/demo/p70-152.pdf.
[14] The Census Bureau’s Survey of Income and Participation (SIPP) is a large-scale, national survey that collects information about household and individual income, program participation, labor force activity, and demographics. It is a longitudinal survey conducted over a multi-year period. Each panel of survey respondents lasts for four years, with each year referred to as a “wave.” The reference month for the analysis we conducted of the SIPP data is March 2015 (Wave 3 of the 2014 Panel). Our analysis is restricted to individuals who are aged 18-64, have no children in the family, and do not receive SSI or SSDI. We define low-income as below 200 percent of the U.S. Census Bureau’s official poverty thresholds.
[15] Chad Stone, “Jobs Report: Improvements Slowing, Jobs Hole Remains Deep,” CBPP, October 2, 2020, https://www.cbpp.org/blog/jobs-report-improvements-slowing-jobs-hole-remains-deep.
[16] “Tracking the COVID-19 Recession’s Effects on Food, Housing, and Employment Hardships,” CBPP, updated January 21, 2021, https://www.cbpp.org/research/poverty-and-inequality/tracking-the-covid-19-recessions-effects-on-food-housing-and.
[17] For a review of the literature, see Brynne Keith-Jennings, Joseph Llobrera, and Stacy Dean, “Links of the Supplemental Nutrition Assistance Program With Food Insecurity, Poverty, and Health: Evidence and Potential,” American Journal of Public Health, Vol. 109, Issue 12, December 2019, https://ajph.aphapublications.org/doi/full/10.2105/AJPH.2019.305325.
[18] CBPP, “Chart Book: The Far-Reaching Benefits of the Affordable Care Act’s Medicaid Expansion,” August 6, 2020, https://www.cbpp.org/research/health/chart-book-the-far-reaching-benefits-of-the-affordable-care-acts-medicaid.
[19] Will Fischer, Douglas Rice, and Alicia Mazzara, “Research Shows Rental Assistance Reduces Hardship and Provides Platform to Expand Opportunity for Low-Income Families,” CBPP, December 5, 2019, https://www.cbpp.org/research/housing/research-shows-rental-assistance-reduces-hardship-and-provides-platform-to-expand.
[20] CBPP analysis of U.S. Census Bureau’s March 2018 Current Population Survey (accessed via IPUMS-CPS). Corrections for underreported benefits from Department of Health and Human Services/Urban Institute Transfer Income Model (TRIM).
[21] The Department of Homeland Security and the Department of State issued immigration rules in 2019 that would make it much more difficult for people with low or modest means to emigrate to the United States and for people already here to gain permanent resident status or extend or modify their temporary status. The rule is in effect in most of the country for people applying for an immigration status. These complicated rules, along with other Trump Administration policies, have led many families that include immigrants to forgo Medicaid and other assistance programs for which they’re eligible despite the fact that a number of these immigrants and their families would not actually be affected by the rule.
[22] Federal rental assistance programs use a somewhat more expansive definition of disability than programs that require that a person receive SSI or SSDI to qualify as having a disability.
[23] Additionally, Missouri and Oklahoma have adopted the Medicaid expansion through voter ballot initiatives with plans to implement the expansion in 2021.
[24] “State Health Facts, Medicaid Expansion Enrollment,” Kaiser Family Foundation, accessed October 2020, https://www.kff.org/health-reform/state-indicator/medicaid-expansion-enrollment/?currentTimeframe=0&sortModel=%7B%22colId%22:%22Location%22,%22sort%22:%22asc%22%7D. These data reflect maximum enrollment in June 2019. 12 million of these Medicaid enrollees are newly eligible for Medicaid because of the ACA and about 3 million of those now covered through the ACA expansion are eligible through Medicaid expansions that some states enacted prior to the ACA.
[25] Michael Simpson, “The Implications of Medicaid Expansion in the Remaining States: 2020 Update,” Urban Institute, June 2020, https://www.urban.org/sites/default/files/publication/102359/the-implications-of-medicaid-expansion-in-the-remaining-states-2020-update.pdf.
[26] CBPP, “Chart Book: The Far-Reaching Benefits of the Affordable Care Act’s Medicaid Expansion,” August 6, 2020, https://www.cbpp.org/research/health/chart-book-the-far-reaching-benefits-of-the-affordable-care-acts-medicaid.
[27] “Medicaid — CBO’s Baseline as of March 6, 2020,” Congressional Budget Office, March 6, 2020, https://www.cbo.gov/system/files/2020-03/51301-2020-03-medicaid.pdf.
[28] Tricia Brooks et al., “Medicaid and CHIP Eligibility, Enrollment and Cost Sharing Policies as of January 2020: Findings from a 50-State Survey,” Georgetown University Center for Children and Families, and Kaiser Family Foundation, March 2020, http://files.kff.org/attachment/Report-Medicaid-and-CHIP-Eligibility,-Enrollment-and-Cost-Sharing-Policies-as-of-January-2020.pdf.
[29] Martha Heberlein et al., “Getting Into Gear for 2014: Findings from a 50-State Survey of Eligibility, Enrollment, Renewal, and Cost-Sharing Policies in Medicaid and CHIP, 2012-2013,” Kaiser Family Foundation and Georgetown Center for Children and Families, January 2013, https://www.kff.org/wp-content/uploads/2013/05/8401.pdf. In January 2013, low-income adults without children living in the home were eligible for Medicaid in six states — Connecticut, Delaware, Hawaii, Minnesota, New York, and Vermont — and the District of Columbia.
[30] “Employer Health Benefits 2019 Annual Survey,” Kaiser Family Foundation, 2019, http://files.kff.org/attachment/Report-Employer-Health-Benefits-Annual-Survey-2019. Only 66 percent of workers in firms with many low-wage workers are eligible for employer-sponsored health insurance coverage, as compared to 81 percent of workers in firms with few low-wage workers. Furthermore, only 51 percent of eligible workers opt into coverage in firms with many low-wage workers, as compared to 78 percent of eligible workers in firms with few low-wage workers.
[31] Based on CBPP analysis using the Census Bureau’s 2013 American Community Survey. We explore the health insurance coverage status of adults who meet the following criteria: aged 19 through 64, family income at or below 138 percent of the poverty line, not living with children of their own in the home, do not earn Supplemental Security Income, are not enrolled in Medicare, and have not had a child within the past year.
[32] Federal requirements bar people with lawful permanent resident status (green card holders) from getting Medicaid in their first five years with that status. People with undocumented status are ineligible from participating in Medicaid.
[33] “U.S. Federal Poverty Guidelines Used to Determine Financial Eligibility for Certain Federal Programs,” United States Department of Health and Human Services, Office of the Assistant Secretary for Planning and Evaluation, January 8, 2020, https://aspe.hhs.gov/poverty-guidelines. CBPP multiplies these figures by 1.38 to determine 138 percent of the federal poverty guideline for a single individual and a two-person family in 2020.
[34] “State Health Facts — Status of State Action on the Medicaid Expansion Decision,” Kaiser Family Foundation, October 2020, https://www.kff.org/health-reform/state-indicator/state-activity-around-expanding-medicaid-under-the-affordable-care-act/?currentTimeframe=0&sortModel=%7B%22colId%22:%22Location%22,%22sort%22:%22asc%22%7D.
[35] Jesse Cross-Call and Matt Broaddus, “States That Have Expanded Medicaid Are Better Positioned to Address COVID-19 and Recession,” CBPP, July 14, 2020, https://www.cbpp.org/research/health/states-that-have-expanded-medicaid-are-better-positioned-to-address-covid-19-and.
[36] Gary Claxton et al., “Pre-Existing Condition Prevalence for Individuals and Families,” Kaiser Family Foundation, October 4, 2019, https://www.kff.org/health-reform/issue-brief/pre-existing-condition-prevalence-for-individuals-and-families/.
[37] Here, we define “low income” as family income at or below 138 percent of the federal poverty line.
[38] CBPP analysis using the Census Bureau’s 2013 and 2018 American Community Survey data.
[39] CBPP, “Chart Book: The Far-Reaching Benefits of the Affordable Care Act’s Medicaid Expansion,” updated October 21, 2020, https://www.cbpp.org/research/health/chart-book-the-far-reaching-benefits-of-the-affordable-care-acts-medicaid.
[40] Aviva Aron-Dine, Kyle Hayes, and Matt Broaddus, “With Need Rising, Medicaid Is at Risk for Cuts,” CBPP, July 22, 2020, https://www.cbpp.org/research/health/with-need-rising-medicaid-is-at-risk-for-cuts.
[41] Bowen Garrett and Anuj Gangopadhyaya, “How the COVID-19 Recession Could Affect Health Insurance Coverage,” Urban Institute, May 2020, https://www.urban.org/sites/default/files/publication/102157/how-the-covid-19-recession-could-affect-health-insurance-coverage_0.pdf.
[42] States submit Medicaid enrollment data to the federal government each month. June 2019 Medicaid enrollment data are the most recent publicly available. Since 2019, Idaho, Nebraska, and Utah have implemented Medicaid expansion and Missouri and Oklahoma have adopted but not implemented Medicaid expansion.
[43] This is based on CBPP’s analysis using the Census Bureau’s 2018 American Community Survey data and Medicaid eligibility information from the Kaiser Family Foundation. See Tricia Brooks et al., “Medicaid and CHIP Eligibility, Enrollment, Renewal and Cost Sharing Policies as of January 2018: Findings from a 50-State Survey,” Kaiser Family Foundation and the Georgetown University Center for Children and Families, March 2018, http://files.kff.org/attachment/Report-Medicaid-and-CHIP-Eligibility-Enrollment-Renewal-and-Cost-Sharing-Policies-as-of-January-2018.
[44] Simpson, op. cit. The Urban Institute estimates that 6.5 million adults would be expected to gain Medicaid coverage were the 15 states that had not adopted Medicaid expansion for low-income adults by January 2020 to expand Medicaid coverage in 2020. CBPP uses 2018 American Community Survey data to estimate the share of these adults who would be adults without children living in the home.
[45] This chapter provides estimates of the demographic characteristics of the Medicaid expansion adult group based on Census Bureau survey data. While the Census data are the best source of information collected in a comparable way across all the states, the data and our analysis have some limitations. For example, Medicaid participation is underreported in surveys. In addition, it is likely that some people who report annual income exceeding 138 percent of the federal poverty line in fact had monthly income qualifying them for Medicaid and were enrolled through the expansion. We anticipate that discrepancies should generally balance out at the national level and these data should still provide a broadly accurate picture of the Medicaid expansion population.
[46] Based on CBPP’s analysis using the Census Bureau’s 2018 American Community Survey data. In the 32 states (including the District of Columbia) that had expanded Medicaid coverage to low-income adults by 2018, we identify Medicaid enrollees who meet the following criteria: are aged 19 through 64, have income at or below 138 percent of the federal poverty line, do not have a child of their own living in the home, do not receive Supplemental Security Income, are not also enrolled in Medicare, and have not given birth to a child in the previous year. In the 19 states that had not expanded Medicaid coverage to low-income adults by 2018, we identify those without health insurance coverage who meet the criteria listed above. Collectively, these are identified as Medicaid expansion adults for the purpose of this analysis.
[47] MaryBeth Musumeci, “The Affordable Care Act’s Impact on Medicaid Eligibility, Enrollment, and Benefits for People with Disabilities,” Kaiser Family Foundation, April 8, 2014, https://www.kff.org/health-reform/issue-brief/the-affordable-care-acts-impact-on-medicaid-eligibility-enrollment-and-benefits-for-people-with-disabilities/.
[48] Susan Dorr Goold and Jeffrey Kullgren, “Report on the 2016 Healthy Michigan Voices Enrollee Survey,” University of Michigan Institute for Healthcare Policy and Innovation, January 17, 2018, https://www.michigan.gov/documents/mdhhs/2016_Healthy_Michigan_Voices_Enrollee_Survey_-_Report__Appendices_1.17.18_final_618161_7.pdf.
[49] Jean Hall et al., “Medicaid Expansion as an Employment Incentive Program for People with Disabilities,” American Journal of Public Health, September 2018, https://ajph.aphapublications.org/doi/10.2105/AJPH.2018.304536.
[50] Rachel Garfield et al., “Understanding the Intersection of Medicaid and Work: What Does the Data Say?” Kaiser Family Foundation, August 8, 2019, https://www.kff.org/medicaid/issue-brief/understanding-the-intersection-of-medicaid-and-work-what-does-the-data-say/.
[51] All education-related estimates are based on the population aged 25 to 64, as opposed to all other estimates in this chapter, which are based on the population aged 19 to 64.
[52] Note, these estimates are derived from CBPP analysis using the Census Bureau’s March supplement to the Current Population Survey because this survey data includes a variable that indicates whether an individual lives in a metropolitan area or a non-metropolitan area. The Census Bureau’s American Community Survey, which we use for all other analysis, does not include such a variable.
[53] CBPP, “Medicaid Works for People in Rural Communities,” January 2018, https://www.cbpp.org/research/health/medicaid-works-for-people-in-rural-communities.
[54] Jennifer Haley et al., “Veterans and Their Family Members Gain Coverage Under the ACA, but Opportunities Remain for More Progress,” Urban Institute, September 2016, http://www.urban.org/sites/default/files/publication/84441/2000947-Veterans-and-Their-Family-Members-Gain-Coverage-under-the-ACA-but-Opportunities-for-More-Progress-Remain.pdf.
[55] CBPP, “Suit Challenging ACA Legally Suspect but Threatens Loss of Coverage for Tens of Millions,” updated August 21, 2020, https://www.cbpp.org/research/health/suit-challenging-aca-legally-suspect-but-threatens-loss-of-coverage-for-tens-of.
[56] Linda Blumberg et al., “The Potential Effects of a Supreme Court Decision to Overturn the Affordable Care Act: Updated Estimates,” Urban Institute, October 2020, https://www.urban.org/sites/default/files/publication/103072/the-potential-effects-of-a-supreme-court-decision-to-overturn-the-affordable-care-act-updated-estimates_01.pdf.
[57] Benjamin Sommers et al., “Medicaid Work Requirements — Results from the First Year in Arkansas,” New England Journal of Medicine, September 12, 2019, https://www.nejm.org/doi/full/10.1056/NEJMsr1901772.
[58] Jennifer Wagner, “New Arkansas Data Contradict Claims That Most Who Lost Medicaid Found Jobs,” CBPP, March 19, 2019, https://www.cbpp.org/blog/new-arkansas-data-contradict-claims-that-most-who-lost-medicaid-found-jobs.
[59] Samantha Artiga, Petry Ubri and Julia Zur, “The Effects of Premiums and Cost Sharing on Low-income Populations: Updated Review of Research Findings,” Kaiser Family Foundation, June 1, 2017, https://www.kff.org/medicaid/issue-brief/the-effects-of-premiums-and-cost-sharing-on-low-income-populations-updated-review-of-research-findings/.
[60] Matt Broaddus and Aviva Aron-Dine, “Medicaid Expansion Has Saved at Least 19,000 Lives, New Research Finds,” CBPP, November 6, 2019, https://www.cbpp.org/research/health/medicaid-expansion-has-saved-at-least-19000-lives-new-research-finds.
[61] In the context of SNAP, these individuals are known as “able-bodied adults without dependents.” This chapter uses the phrase “adults potentially subject to the time limit” to acknowledge the variety of definitions adopted in the research literature to identify this at-risk group of non-elderly, non-disabled adults not living with minor children. Not everyone in this group is actually subject to the time limit, as some may meet certain other exceptions from the time limit, live in areas with waivers from the time limit, work at least 20 hours a week, or be exempt from general SNAP work requirements. For more information, see www.fns.usda.gov/snap/able-bodied-adults-without-dependents-abawds. This chapter uses the phrase “adults not living with minor children” to refer to broader group of individuals aged 18 to 64 who aren’t living with minor children and don’t have severe disabilities.
[62] For a review of the literature, see Brynne Keith-Jennings, Joseph Llobrera, and Stacy Dean, “Links of the Supplemental Nutrition Assistance Program With Food Insecurity, Poverty, and Health: Evidence and Potential,” American Journal of Public Health, Vol. 109, Issue 12, December 2019, https://ajph.aphapublications.org/doi/full/10.2105/AJPH.2019.305325.
[63] Ibid.
[64] The USDA reported that 35.7 million individuals participated in SNAP in an average month of 2019. This figure understates SNAP participation, however, because of the partial federal government shutdown that year. As a result of the shutdown, most February 2019 SNAP benefits were issued in the month of January 2019. The February data reflect only the participation and issuance that were not part of the early issuance. If we assume that the change in SNAP participation between December 2018 and March 2019 was evenly distributed across January and February, then we estimate that average monthly SNAP participation in 2019 was closer to 38 million.
[65] Some categories of people are not eligible for SNAP regardless of their income or assets, such as individuals who are on strike, unauthorized immigrants, and certain lawfully present immigrants. In general, lawfully present immigrant children, refugees, and asylees, and qualified legal immigrant adults who have been in the United States for at least five years, can qualify for SNAP. In some cases, the income and resources of the immigrant’s sponsor count in determining the immigrant’s eligibility. For detailed information on legal immigrants’ eligibility for SNAP, see http://www.fns.usda.gov/snap/snap-policy-non-citizen-eligibility.
[66] Patrick Canning and Rosanna Mentzer Morrison, “Quantifying the Impact of SNAP Benefits on the U.S. Economy and Jobs,” USDA, Economic Research Service, July 18, 2019, https://www.ers.usda.gov/amber-waves/2019/july/quantifying-the-impact-of-snap-benefits-on-the-us-economy-and-jobs/.
[67] “Tracking the COVID-19 Recession’s Effects on Food, Housing, and Employment Hardships,” CBPP, updated December 18, 2020, https://www.cbpp.org/research/poverty-and-inequality/tracking-the-covid-19-recessions-effects-on-food-housing-and.
[68] These 1.7 million individuals lived in households with an average of one member and average gross income of $385 a month. They received average monthly benefits of $188 in 2018.
[69] See https://www.fns.usda.gov/snap/eligibility/elderly-disabled-special-rules. These individuals lived in households with an average of one member and average gross income of $576 a month, and average monthly benefits of $176.
[70] These 400,000 individuals lived in households with an average of one member and average gross income of $372 a month. They receive an average monthly SNAP benefit — in the months in which they could receive the benefits — of $185.
[71] The statistics on age, gender, education level, and household composition are based on CBPP analysis of USDA administrative data for fiscal year 2018. The statistic on metropolitan status is based on CBPP calculations of March 2020 Current Population Survey (CPS) data for adults aged 18-49 who do not have children in the household, are not receiving disability benefits, and do not report working more than 20 hours a week.
[72] We estimate that 9,000 low-income adults potentially subject to the time limit who receive SNAP are veterans. This statistic is based on CBPP analyses of 2019 American Community Survey 1-year Public Use Microdata Sample files.
[73] For a discussion of some of these disparities and inequities, see LaDonna Pavetti and Peggy Bailey, “Boost the Safety Net to Help People With Fewest Resources Pay for Basics During the Crisis,” CBPP, April 29, 2020, https://www.cbpp.org/research/poverty-and-inequality/boost-the-safety-net-to-help-people-with-fewest-resources-pay-for.
[74] Alisha Coleman-Jensen et al., “Household Food Security in the United States in 2019,” USDA Economic Research Service, September 2020, https://www.ers.usda.gov/webdocs/publications/99282/err-275.pdf?v=8008.
[75] CBPP analysis of the U.S. Census Bureau’s 2019 American Community Survey (ACS) 1-year estimates, 2019 ACS 1-Year Public Use Microdata Sample files and the Agriculture Department’s fiscal year 2018 SNAP Quality Control data (QC).
[76] These figures are for a typical month while adults potentially subject to the time limit are receiving SNAP. As discussed below, many of these adults cycle in and out of jobs and have more income over the year.
[77] See, for example, Joel Cuffey, Elton Mykerezi, and Timothy Beatty, “Food Assistance and Labor Force Outcomes of Childless Adults: Evidence from the CPS,” paper presented at the 2015 Agricultural & Applied Economics Association and Western Agricultural Economics Association Annual Meeting, July 2015, http://ageconsearch.umn.edu/bitstream/205821/1/Mykerezi_Beatty_Cuffey_ABAWDWorkIncentives_r.pdf.
[78] This range reflects a difference in data sources. CBPP analyses of USDA’s administrative data show that 27 percent of adults participating in SNAP who are potentially subject to the time limit worked in a typical month of 2018. In addition, CBPP analyses of the Census Bureau’s 2014 Panel of the Survey of Income and Program Participation (SIPP) show that 51 percent of these adults worked in 2015 in the month that they received SNAP. There are reasons for the differences in the results between the USDA data and the Census SIPP data. SIPP is a household survey, which means that respondents must have a fixed residence, but SNAP reaches many homeless households and other more transient households, who may be less likely to be employed while receiving SNAP. These people may show up in the USDA data but not the SIPP data. At the same time, work that households are not required to report for SNAP purposes may be captured by the SIPP data, but not by USDA’s. (Some work may not be required to be reported for SNAP either because it is irregular or isn’t expected to continue or because, under SNAP’s “simplified reporting” rules, changes in circumstances need only be reported at six-month intervals unless they raise household income above 130 percent of the poverty level.)
[79] See Stephen Bell and Jerome Gallagher, “Prime-Age Adults without Children or Disabilities: The ‘Least Deserving of the Poor’—or Are They? Assessing the New Federalism Policy,” Urban Institute, February 2001, https://www.urban.org/sites/default/files/publication/61286/310269-Prime-Age-Adults-without-Children-or-Disabilities.PDF. Although USDA’s administrative data may not be sufficiently reliable to draw firm conclusions, they suggest that, in a typical month in 2018, half (50 percent) of all adults subject to the time limit who were not working were looking for work.
[80] There are certain other exemptions from the time limit. For more information, see www.fns.usda.gov/snap/able-bodied-adults-without-dependents-abawds.
[81] The number of hours of workfare required to maintain benefits is equivalent to the household’s SNAP allotment divided by the minimum wage.
[82] Job search can only count toward the 20-hour requirement if it is funded by either the Workforce Innovation and Opportunity Act (WIOA) or the Trade Adjustment Act (TAA) or makes up less than half of a more comprehensive SNAP Employment & Training program. Most job search activities for SNAP participants are stand-alone programs administered by the state human services agency, however, and are not funded through WIOA or TAA — and hence don’t count toward the 20-hour requirement.
[83] Elizabeth Dagata, “Assessing the Self-Sufficiency of Food Stamp Leavers,” Economic Research Service, USDA, September 2002, https://www.ers.usda.gov/publications/pub-details/?pubid=46645. The studies included people who had left SNAP because of the three-month time limit or for other reasons, such as because they found a job or mistakenly believed they were no longer eligible. Even though the studies were not able to isolate the individuals who left SNAP because of the time limit, the studies showed that individuals who left SNAP in the four states included in the studies reported high levels of material hardship, including difficulty paying for housing, utilities, or food. Food insecurity “with hunger” was how USDA then referred to the most severe form of food insecurity, where households had to skip or reduce the size of their meals or otherwise disrupt their eating patterns at times during the year because they couldn’t afford sufficient food.
[84] Nearly every state qualified for a statewide waiver during and after the Great Recession based on regulations that allow states qualifying for Extended Benefits in the Unemployment Insurance program to qualify for a statewide waiver in SNAP. The Bush Administration clarified in 2008 that states that qualified for the temporary Emergency Unemployment Compensation program enacted in 2008, and extended through 2013, also would qualify for a statewide waiver from the SNAP time limit. A separate provision of the 2009 American Recovery and Reinvestment Act temporarily suspended the time limit in all states from April 2009 through September 2010, but nearly every state would have qualified for a statewide waiver at some point during this period without this provision, because of their high levels of unemployment.
[85] Robert Greenstein, “New SNAP Rule Would Cost Many of Nation’s Poorest Their Food Aid,” CBPP, December 4, 2019, https://www.cbpp.org/press/statements/new-snap-rule-would-cost-many-of-nations-poorest-their-food-aid.
[86] Ed Bolen, “Court Decision Against Trump Rule Preserves SNAP for 700,000 Jobless,” CBPP, October 20, 2020, https://www.cbpp.org/blog/court-decision-against-trump-rule-preserves-snap-for-700000-jobless.
[87] Will Fischer, Douglas Rice, and Alicia Mazzara, “Research Shows Rental Assistance Reduces Hardship and Provides Platform to Expand Opportunity for Low-Income Families,” CBPP, December 5, 2019, https://www.cbpp.org/research/housing/research-shows-rental-assistance-reduces-hardship-and-provides-platform-to-expand.
[88] Eligibility is determined using the Department of Health and Human Services’ federal poverty guidelines by household size. See https://aspe.hhs.gov/poverty-guidelines.
[89] CBPP analysis of 2017 HUD administrative data. We relied on a non-public dataset from HUD’s Office of Policy Development and Research (available through a research agreement) to analyze demographic characteristics of households using HUD rental assistance.
[90] CBPP analysis of 2012 and 2017 HUD administrative data. Individuals in older HUD administrative records do not have a unique identifier, so we matched individuals in the 2012 administrative records to individuals in the 2017 records using a unique identifier for the household, plus the individual’s date of birth and sex. We were unable to match records for approximately 50,000 individuals who appeared to be sets of twins; most of these individuals were children under 18 and were therefore dropped from the analysis.
[91] CBPP analysis of 2017 HUD administrative data. Federal rental assistance programs use a somewhat more expansive definition of disability than programs that require that a person receive Supplemental Security Income or Social Security Disability Insurance to qualify as having a disability. Federal rental assistance programs consider a person to have a disability if they have one or more of the following:
- a disability as defined in Section 223 of the Social Security Act;
- a physical, mental, or emotional impairment that is expected to be of long-continued and indefinite duration, substantially impedes their ability to live independently, and is of such a nature that such ability could be improved by more suitable housing conditions;
- a developmental disability as defined in Section 102 of the Developmental Disabilities Assistance and Bill of Rights Act; and/or
- Acquired Immune Deficiency Syndrome (AIDS) or any condition that arises from the etiologic agent for AIDS.
[92] Ibid.
[93] CBPP analysis of 2017 HUD administrative data. We report the sex, race, and ethnicity categories HUD uses in its data but acknowledge that these terms may not accurately describe how all assisted people would self-identify. Additionally, data limitations prevent us from reporting any demographic breakdowns by sexual orientation or gender identity.
[94] US Department of Agriculture, 2019 Multi-Family Fair Housing Occupancy Report, December 5, 2019, https://www.rd.usda.gov/sites/default/files/RDUL-MFHannual1.pdf.
[95] HUD, 2018-2019 National HOPWA Performance Profile, https://files.hudexchange.info/reports/published/HOPWA_Perf_NatlComb_2018.pdf.
[96] HUD, FY 2020 IHBG Final Allocation Summaries, https://www.hud.gov/program_offices/public_indian_housing/ih/codetalk/onap/ihbgformula.
[97] We consider low-income households paying more than half their income on housing to need rental assistance. In general, rental assistance ensures that recipients pay about 30 percent of their household income on housing. Due to data limitations, we are not able to exclude a small number of individuals and households who are paying more than half their income for rent despite receiving HUD rental assistance.
[98] We use HUD’s definition of low income, which refers to households earning less than 80 percent of the local county or metropolitan area median income, adjusted for household size. In the United States, 80 percent of the median household income for a single adult household was $40,250 in 2018.
[99] CBPP, “Three Out of Four Low-Income At-Risk Renters Do Not Receive Federal Rental Assistance,” August 2017, https://www.cbpp.org/three-out-of-four-low-income-at-risk-renters-do-not-receive-federal-rental-assistance.
[100] CBPP analysis of HUD custom tabulations of the 2017 American Housing Survey; 2017 HUD administrative data; FY2018 McKinney-Vento Permanent Supportive Housing bed counts; 2017-2018 Housing Opportunities for Persons with AIDS grantee performance profiles; and the USDA FY2018 Multi-Family Fair Housing Occupancy Report.
[101] CBPP analysis of the 2018 American Community Survey Public Use Microdata Sample (PUMS).
[102] Barbara Sard, “More Households Facing Unaffordable Housing Costs Than Before Recession,” CBPP, February 9, 2015, https://www.cbpp.org/blog/more-households-facing-unaffordable-housing-costs-than-before-recession.
[103] Will Fischer, Douglas Rice, and Alicia Mazzara, “Research Shows Rental Assistance Reduces Hardship and Provides Platform to Expand Opportunity for Low-Income Families,” CBPP, December 5, 2019, https://www.cbpp.org/research/housing/research-shows-rental-assistance-reduces-hardship-and-provides-platform-to-expand.
[104] Relatively small, unexpected expenses can be a hardship for many people. Nearly 40 percent of adults surveyed said they would have difficulty covering a $400 emergency expense. Board of Governors of the Federal Reserve System, “Report on the Economic Well-Being of U.S. Households in 2019 - May 2020,” May 21, 2020, https://www.federalreserve.gov/publications/2020-economic-well-being-of-us-households-in-2019-dealing-with-unexpected-expenses.htm.
[105] Data limitations prevent us from creating an analogous measure of working, recently worked, or in school full time, as used in the section on assisted individuals.
[106] CBPP analysis of the 2018 American Community Survey Public Use Microdata Sample (PUMS), 2018 HUD area median incomes for counties and metropolitan areas, and 2018 HHS federal poverty guidelines. We report the sex, race, and ethnicity categories the Census Bureau uses in its data but acknowledge that these terms may not accurately describe how all individuals would self-identify. We consider someone to have a disability if they meet one of the six American Community Survey disability criteria: https://www.census.gov/topics/health/disability/guidance/data-collection-acs.html.
[107] Sharon Parrott et al., “More Relief Needed to Alleviate Hardship,” CBPP, July 21, 2020, https://www.cbpp.org/research/poverty-and-inequality/more-relief-needed-to-alleviate-hardship.
[108] Ibid.
[109] CBPP analysis of 2019 HUD Point-in-Time Count data, January 2020, https://www.hudexchange.info/resource/5948/2019-ahar-part-1-pit-estimates-of-homelessness-in-the-us/.
[110] HUD defines these “individuals” as persons who are not part of a family with children during an episode of homelessness, including single adults, multiple-adult households, unaccompanied youth under 18, and seniors ages 62 and older. Unaccompanied youth under 18 accounted for about 1 percent of all such individuals. The 2017 Annual Homelessness Assessment Report (AHAR) Part 2 reported that of all sheltered individuals, 8 percent were 62 and older. See: 2017 AHAR Part 2, HUD, October 2018, https://www.hudexchange.info/resource/5769/2017-ahar-part-2-estimates-of-homelessness-in-the-us/.
[111] CBPP analysis of 2019 HUD Point-in-Time Count data, January 2020, https://www.hudexchange.info/resource/5948/2019-ahar-part-1-pit-estimates-of-homelessness-in-the-us/.
[112] 10 percent were in transitional housing and less than 1 percent were in supportive housing.
[113] National Alliance to End Homelessness, “Racial Inequalities in Homelessness by the Numbers,” June 2020, https://endhomelessness.org/resource/racial-inequalities-homelessness-numbers/
[114] Due to data limitations, we are unable to separate HUD Point-in-Time Count data into Hispanic and non-Hispanic race categories. Consequently, race and ethnicity categories for people experiencing homelessness are not mutually exclusive.
[115] Bianca D.M. Wilson et al., “Homelessness Among LGBT Adults in the US,” UCLA School of Law – Williams Institute, May 2020, https://williamsinstitute.law.ucla.edu/publications/lgbt-homelessness-us/.
[116] Adam P. Romero et al., “LGBT People and Housing Affordability, Discrimination, and Homelessness,” UCLA School of Law – Williams Institute, April 2020, https://williamsinstitute.law.ucla.edu/publications/lgbt-housing-instability/.
[117] Peggy Bailey and Douglas Rice, “Pandemic Relief Must Include Comprehensive Housing Assistance for People Experiencing the Most Severe Hardship,” CBPP, July 27, 2020, https://www.cbpp.org/research/housing/pandemic-relief-must-include-comprehensive-housing-assistance-for-people.
[118] Bipartisan Policy Center, “Housing America’s Future: New Directions for National Policy,” February 2013, https://bipartisanpolicy.org/report/housing-americas-future-new-directions-national-policy/.
[119] For additional information on this proposed renters’ tax credit, see https://www.cbpp.org/topics/renters-credit.
[120] This group of working adults includes non-custodial parents who are not claiming dependents for purposes of the EITC.
[121] CBPP estimate based on the U.S. Census Bureau’s March 2019 Current Population Survey, using 2020 tax parameters and incomes adjusted to 2020 dollars. The estimate includes all workers aged 19-65 who are taxed into, or deeper into, poverty for whom federal income tax liability (if any) and the employee share of the payroll tax push them below the poverty line, or further below the poverty line by those taxes. It excludes full-time students aged 19-23, who under current law can be claimed by their parents as qualifying children for the larger EITC for families with children. Poverty status is determined at the level of the tax filing unit. We use the 2019 Census official poverty line appropriate for the tax unit based on the number and age of the tax unit members, inflated to 2020 dollars.
[122] Chuck Marr et al., “Temporarily Expanding Child Tax Credit and Earned Income Tax Credit Would Deliver Effective Stimulus, Help Avert Poverty Spike,” CBPP, July 21, 2020, https://www.cbpp.org/research/federal-tax/temporarily-expanding-child-tax-credit-and-earned-income-tax-credit-would.
[123] Tax filers must have valid Social Security numbers for themselves and any other eligible people on their EITC claim (e.g., spouses or children).
[124] CBPP estimates based on the U.S. Census Bureau’s March 2019 Current Population Survey, using 2020 tax parameters and incomes adjusted to 2020 dollars, and including those aged 25-64 who are eligible under current law. These estimates are based on 2019 data and do not take into account shifts in eligibility due to the recession.
[125] Tax year 2018 EITC Table in the IRS Compliance Data Warehouse, as of September 29, 2020, unpublished data provided by IRS.
[126] “Making the EITC Work for Taxpayers and the Government,” Taxpayer Advocate Report for 2020, Appendix Figure A7, July 19, 2019, https://www.taxpayeradvocate.irs.gov/wp-content/uploads/2020/08/JRC20_Volume3.pdf.
[127] CBPP estimates based on the U.S. Census Bureau’s March 2019 Current Population Survey, using 2020 tax parameters and incomes adjusted to 2020 dollars, and including those aged 25-64 who are eligible under current law. These estimates are based on 2019 data and do not take into account shifts in eligibility due to the recession. We use the CPS to estimate the EITC-eligible population because the dataset contains demographic data on race, education, and occupation, whereas IRS administrative data on people who claim the EITC do not include such demographic information. Note that racial and ethnic categories used here to describe the EITC do not overlap; thus, figures for Black or other races exclude individuals who also identify as Latino.
[128] CBPP estimates based on the U.S. Census Bureau’s March 2019 Current Population Survey, using 2020 tax parameters and incomes adjusted to 2020 dollars, and including those aged 19-65. Racial and ethnic categories are mutually exclusive.
[129] The “poverty line” here refers to the official poverty line, not the Supplemental Poverty Measure.
[130] Their standard deduction for 2020 is $12,400. The estimated poverty threshold for one person, however, is $13,621 in 2020, so an individual at the poverty line must pay income tax on $1,221 in wages. Thus, single taxpayers not raising children must pay income tax while earning below-poverty-line wages.
[131] CBPP calculations of figures in Margot L. Crandall-Hollick and Joseph S. Hughes, “The Earned Income Tax Credit (EITC): An Economic Analysis,” Congressional Research Service, August 13, 2018, https://fas.org/sgp/crs/misc/R44057.pdf. CRS analyzed the U.S. Census Bureau’s March 2017 Current Population Survey and used a modified version of the official poverty measure, described in more detail in Figure 3 of the CRS report.
[132] Families residing in Puerto Rico are not eligible for the federal EITC. The Puerto Rico EITC is a local tax credit that provides a maximum credit of between $300 and $2,000, depending on family size and configuration. It is available to working people on the island making less than about $34,000 (or $42,000 for a married couple), with the highest benefits provided to people with incomes between $6,000 and $18,000, depending on family size.
For more on state EITCs, see Erica Williams, Samantha Waxman, and Juliette Legendre, “States Can Adopt or Expand Earned Income Tax Credit to Build a Stronger Future Economy,” CBPP, updated March 9, 2020, https://www.cbpp.org/research/states-can-adopt-or-expand-earned-income-tax-credits-to-build-a-stronger-future-economy.
[133] The figures we cite on the number of working adults not raising children who are taxed into or deeper into poverty account only for federal income and payroll taxes. If we also accounted for state and local taxes, more working adults would be taxed into or deeper into poverty.
[134] California and Colorado have also expanded eligibility for their state EITCs to working adults who file their taxes using an Individual Tax Identification Number (ITIN) rather than a Social Security number, including some working adults without children in the home. These individuals are not eligible for the federal EITC. Our estimates of the number of working adults taxed into, or deeper into, poverty do not include workers who file taxes using an ITIN.
[135] Congress set the eligibility age at 25 when establishing the EITC for workers not raising children in 1993 to avoid providing access to the EITC to college and graduate students from middle-income families who may currently have low incomes but depend primarily on their parents for support. In 1993, the IRS had no way to identify tax filers who were students. Today, it does.
[136] These 25 states include the District of Columbia, which this chapter treats as a state. Some offer uniform statewide programs; others have mandatory state guidelines but allow county programs to adopt varying eligibility standards. (See the Appendix for greater detail.) The remaining 26 states have no statewide GA program or state mandate for counties to provide such assistance, although some counties may offer a program at the county or local level. Because there is neither a statewide program nor state mandate, we consider these states as having no program in Figure 18. In four of the states labeled as “No State Program” we have identified at least one county with a GA program; those states are identified in Appendix Table 2.
[137] A number of states use the term “unemployable” for the group of persons the state has chosen to serve, generally individuals who have a disability or meet other criteria such as being over age 55. Similarly, some of the 11 states that serve individuals more broadly based on financial need use the term “employable” to describe eligible individuals. (Some states have multiple programs with more limited benefits for those considered “employable.”) This report uses deemed “unemployable” and deemed “employable” to describe the coverage of these two types of programs, reflecting that these are state or county determinations and may not accurately depict a person’s ability to work. In reality, many individuals with disabilities or other health conditions or over age 55 are able to work. Similarly, being deemed “employable” only means that a person does not have a work-limiting disability or other incapacity that meets state or county standards; many individuals deemed “employable” face serious barriers to employment, including homelessness, lack of in-demand job skills, prior involvement with the criminal justice system, or racial discrimination.
[138] This chapter provides an overview of program policies across the 25 states with programs in 2020, based on our updated national survey of General Assistance programs. The Appendix sets forth the programs for which we collected data and how we collected it. It also discusses other studies on which we relied for historical information. This chapter is largely drawn from Liz Schott, “State General Assistance Programs Very Limited in Half the States and Nonexistent in Others, Despite Need,” CBPP, July 2, 2020, https://www.cbpp.org/research/family-income-support/state-general-assistance-programs-very-limited-in-half-the-states-and.
[139] Some state GA programs also serve families that are ineligible for other aid; we have included this information in Appendix Table 2, but the details in this report focus on program features that apply to individuals without dependent children.
[140] The California information cited here is based on the Los Angeles County program. Some other counties have different time limits.
[141] For General Assistance, most cases represent one individual, although a case that includes an eligible couple could represent two individuals without children. Because the information available from states is typically by caseload and does not always include a count of individuals, we use the number of cases rather than individuals in order to present comparable cross-state data for a single point in time.
[142] The missing state is New Hampshire; caseload data for New Hampshire’s statewide Aid to the Permanently and Totally Disabled are not available.
[143] Because each state decides which groups of individuals — and sometimes families — to cover in its General Assistance programs, who is included in the caseload numbers compiled here may vary across states.
[144] “Status of State Action on the Medicaid Expansion Decision,” Kaiser Family Foundation (State Health Facts), accessed December 2020, https://www.kff.org/health-reform/state-indicator/state-activity-around-expanding-medicaid-under-the-affordable-care-act/?currentTimeframe=0&sortModel=%7B%22colId%22:%22Location%22,%22sort%22:%22asc%22%7D.
[145] L. Jerome Gallagher et al., “State General Assistance Programs 1998,” Urban Institute, 1999; L. Jerome Gallagher, “A Shrinking Portion of the Safety Net: General Assistance from 1989 to 1998,” Urban Institute, 1999.
[146] For example, we included New Hampshire’s Aid for Permanently and Totally Disabled program in this report because we concluded that it was comparable to other state General Assistance programs, although the Urban Institute included only New Hampshire’s Local Welfare in its reports.
More from the Authors

Areas of Expertise

Areas of Expertise

Areas of Expertise

Areas of Expertise

Areas of Expertise

Areas of Expertise

Areas of Expertise

Areas of Expertise

Areas of Expertise