More Relief Needed to Alleviate Hardship
Households Struggle to Afford Food, Pay Rent, Emerging Data Show
Executive Summary
"The next package should both extend the relief measures that are working and address the shortcomings and missing elements in the relief efforts to date."As Congress begins considering a new relief package, likely the last before the election, emerging data show that a large and growing number of households are struggling to afford food and that millions of households are behind on rent, raising the specter that evictions could begin to spike as various federal, state, and local moratoriums are lifted. The next package should both extend the relief measures that are working but are slated to end well before the crisis abates and address the shortcomings and missing elements in the relief efforts to date.
Hardship, joblessness, and the health impacts of the pandemic itself are widespread, but they are particularly prevalent among Black, Latino, Indigenous, and immigrant households. These disproportionate impacts reflect harsh inequities — often stemming from structural racism — in education, employment, housing, and health care. Black, Latino,[1] and immigrant workers are likelier to work in industries paying low wages, where job losses have been far larger than in higher-paid industries. Households of color and immigrant families also often have fewer assets to fall back on during hard times. Immigrant households face additional unique difficulties: many don’t qualify for jobless benefits and other forms of assistance, and those who do qualify for help often forgo applying, fearing that receiving help will make it harder for them or someone in their family to attain or retain lawful permanent resident status (also known as “green card” status) in the future.
Emerging Data Show Sharp Rise in Hardship
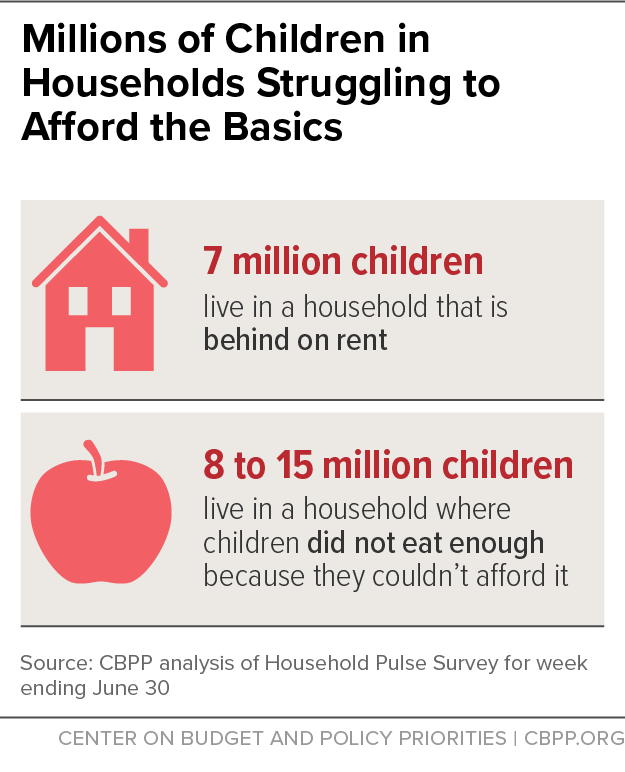
The Census Bureau’s weekly Household Pulse Survey, launched in April, provides nearly real-time data on how the unprecedented health and economic crisis is affecting the nation. Data from this and other sources, such as unemployment data from Census’ Current Population Survey and the Department of Labor, show that tens of millions of people are out of work and struggling to afford adequate food and pay the rent. The impacts on children are large. (See Figure 1.)
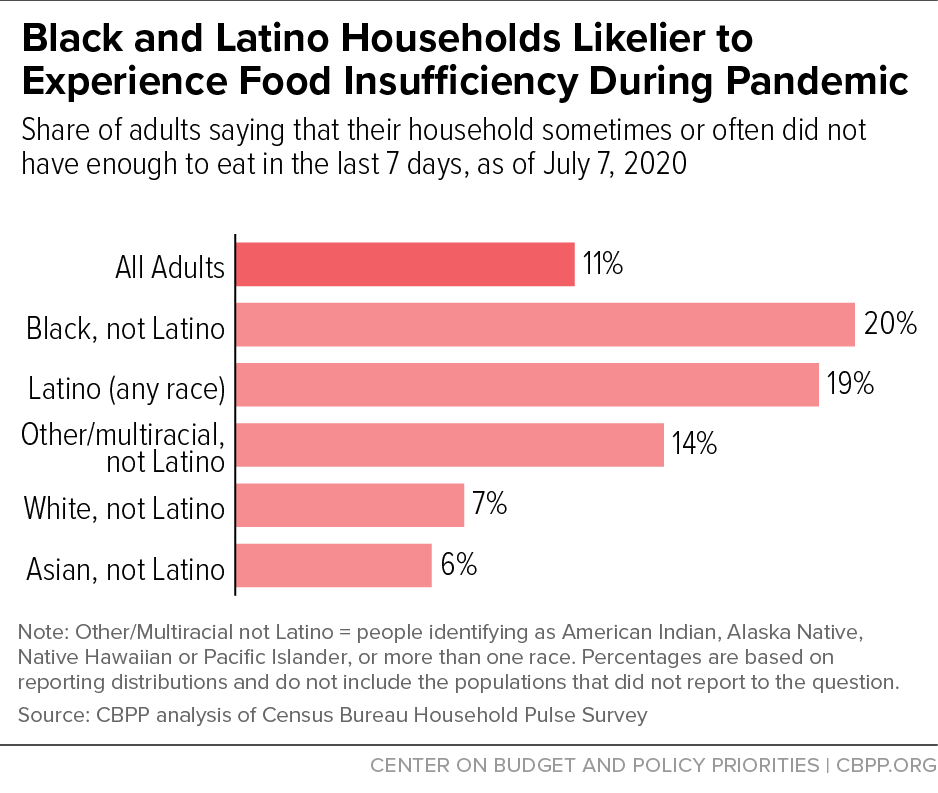
- Difficulty getting enough food. Data from several sources show a dramatic increase in the number of households struggling to put enough food on the table. About 26 million adults — 10.8 percent of all adults in the country — reported that their household sometimes or often didn’t have enough to eat in the last seven days, according to the Household Pulse Survey for the week ending July 7. The rates were more than twice as high for Black and Latino respondents (20 and 19 percent, respectively) as for white respondents (7 percent). And 10 to 19 percent of adults with children reported that their children sometimes or often didn’t eat enough in the last seven days because they couldn’t afford it, well above the pre-pandemic figure. This translates into an estimated 8 to 15 million children who live in a household in which the children were not eating enough because the household couldn’t afford it.
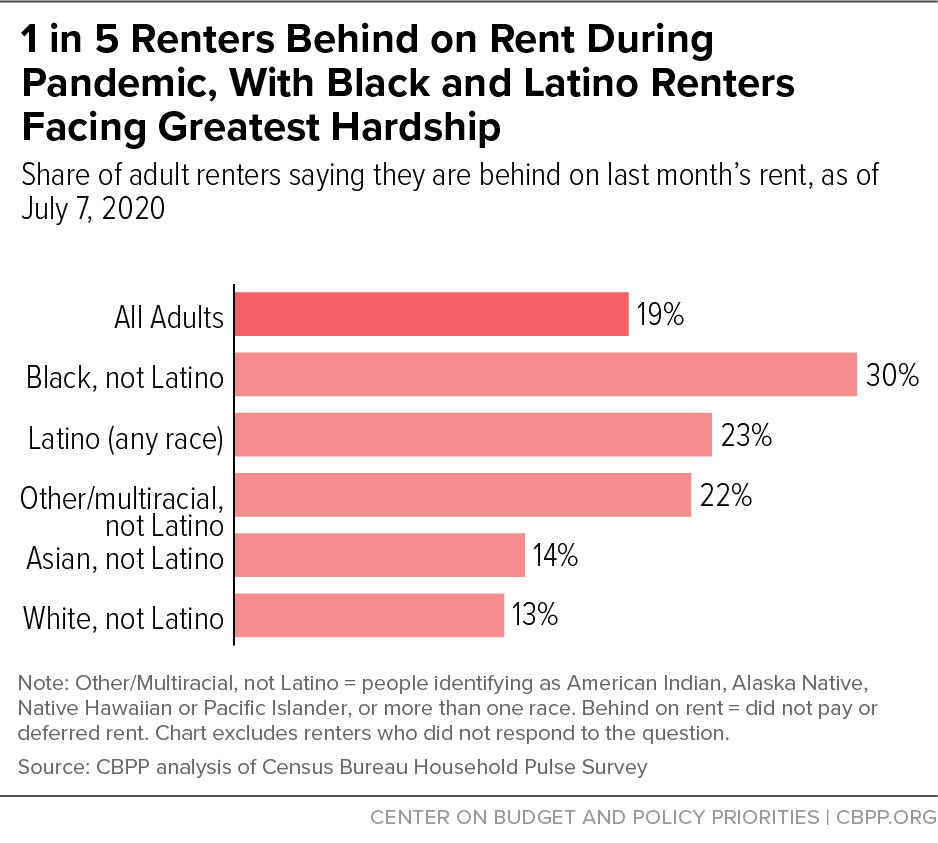
- Inability to pay rent. An estimated 13.1 million adults who live in rental housing — 1 in 5 adult renters — were behind on rent for the week ending July 7. Here, too, the rates were much higher for Black (30 percent) and Latino (23 percent) renters than white (13 percent) renters. Renters who are parents or otherwise live with children are more than twice as likely to be behind on rent compared to adults not living with anyone under age 18. Some 7 million children live in a household that is behind on rent.
- Unemployment. The unemployment rate jumped in April to a level not seen since the 1930s — and still stood at 11.1 percent in June, higher than at any point in the Great Recession. Some 15.4 percent of Black workers and 14.5 percent of Latino workers were unemployed in June, compared to 10.1 percent of white workers. Unemployment has also risen faster among workers who were born outside the United States (this includes individuals who are now U.S. citizens) than U.S.-born workers. The June data predate the sharp rise in COVID-19 cases in recent weeks that has led some states and localities to reimpose selected business restrictions and raised concerns among consumers, employers, and workers about the health risks of many activities.
Hardship is high among families for varied reasons. Many have lost jobs or seen their earnings fall. While many jobless adults qualify for unemployment benefits, some do not. For example, those who were out of work prior to the pandemic often do not qualify for jobless benefits. This includes those who left employment because they were ill or needed to care for a new baby or ill household member and those who lost employment during the normal labor market ups and downs that occur even during good times. It also includes people who recently completed schooling or training and now can’t find a job. Households are also facing rising food prices and higher costs as children are home and missing out on meals at school and in child care and summer programs. And with widespread job losses, getting help from extended family members and friends can be more difficult.
Most Effective Relief Measures Target Struggling Households
Relief measures should be designed to reduce hardship so households can pay rent, put food on the table, and meet other basic needs and to boost the economy by creating a “virtuous cycle” in which consumers can spend more, which helps the businesses where they shop stay in business and keep their workers employed, which in turn helps those workers maintain their own spending.
In a traditional recession, the relief measures most effective at boosting the economy are those that put money into the hands of struggling families — because they are most likely to spend the funds rather than save them — and provide fiscal relief to states and localities so they do not have to cut jobs and spending in areas like education, transportation, services for struggling individuals, and public works, which worsens slowdowns and hurts residents.
In this recession, measures targeted on struggling households are even more essential. That’s partly because the economic fallout from the pandemic is so severe, with the number of private and government jobs falling by nearly 15 million between February and June. Without robust relief, evictions and hunger will increase, with long-lasting health and other impacts for many children and adults. It’s also because consumer demand won’t fully return to pre-pandemic levels until the virus itself is brought under control and people feel that it’s safe to re-engage fully in the economy. The measures that will pump significant resources into the economy overall are those that help struggling families make ends meet.
The Families First Coronavirus Response Act (Families First Act hereafter) and the Coronavirus Aid, Relief, and Economic Security (CARES) Act, both enacted in March, included important measures to shore up household incomes and reduce hardship, including expanded unemployment benefits, direct stimulus payments through the IRS, increased nutrition benefits for some SNAP recipients, and modest fiscal relief to states and localities. Early evidence suggests that these measures have made an important difference in helping lower-income families pay their bills. A study by Harvard economist Raj Chetty and his colleagues at Opportunity Insights, for example, found that while spending fell sharply for both high- and low-income consumers early in the crisis, it rose back to near pre-crisis levels for low-income consumers when various relief measures kicked in. (By contrast, spending remained lower among higher-income households since more of their spending is discretionary and they were limiting their activities due to both the health risks and business closures.)
However, the relief measures enacted so far are temporary even though the economic fallout from the crisis will likely last years. Most notably, the $600-per-week increase in unemployment benefits only is in place through July, while expansions in eligibility for jobless benefits and in the number of weeks workers can receive benefits expire at the end of the year. In addition, the boost in SNAP benefits for some SNAP households and the increase in the federal share of state Medicaid costs are both tied to public health emergency declarations so will very likely end before the economy fully recovers.
The measures also have serious gaps. They exclude many immigrants, for example, and provide only modest assistance to those with the lowest incomes; the SNAP benefit boost now in place entirely misses the poorest 40 percent of SNAP households, including at least 5 million children. And the fiscal relief to date for states, localities, territories, and tribes falls far short of projected revenue shortfalls, leaving states and other governments with little choice but to plan for major budget cuts that will, among other harmful impacts, result in layoffs of teachers and other public sector workers as well as workers in businesses and nonprofit agencies that depend on government for business or for funding.
Next Package Should Include Relief
That Helps Hard-Hit Households
The next relief package should be robust enough, and last long enough, to ensure that families can make ends meet and are ready to re-engage in the economy fully when it is safe to do so. Relief measures must enable households hit hard by the crisis — whether they lost their jobs directly in the crisis or were already struggling to make ends meet and now face greater challenges — to pay their rent, keep food on the table, and meet other basic needs. Targeting relief to those who most need it is also the most effective way to boost the economy. Moreover, given that the crisis is hitting communities of color and immigrants hardest, funding must be dedicated to programs that have a track record of reaching these communities and have the potential to push back against existing disparities.
Thus, the next package should include two broad sets of measures. The first set should help those struggling the most, by:
- Boosting SNAP benefits for all SNAP participants. The House-passed Heroes Act includes a 15 percent SNAP benefit increase that would provide roughly $100 per month more to a family of four and help all SNAP households, including the poorest households who face the greatest challenges to affording food but were left out of the Families First SNAP benefit increase. Studies show that SNAP benefits are too low even during better economic times; this is particularly problematic during downturns because many participants will be out of work or earning very low pay for longer periods and receive less help from their extended families.
- Significantly increasing funding for homelessness services, eviction prevention, and housing vouchers. Substantial additional resources are needed for rental assistance to enable more struggling households to pay rent, including past missed payments, for as long as they need that help. In addition, the homelessness services system needs more resources to quickly secure housing for people evicted from their homes, revamp its services and facilities in order to facilitate social distancing and other health protocols, and provide safe non-congregate shelter options whenever possible.
- Providing emergency grants to states for targeted help to families falling through the cracks. Even well-designed relief measures will miss some households and do too little for others facing serious crises. The next package should include funding for states to provide cash or other help to individuals and families at risk of eviction or other serious hardships and to create subsidized jobs for those with the greatest difficulty finding employment, when it is safe for employment programs to operate.
- Temporarily expanding the Earned Income Tax Credit (EITC) for workers without minor children at home and the Child Tax Credit for poor and low-income children. Expanding the EITC would help millions of low-wage workers not raising children in their homes who are now taxed into, or deeper into, poverty because they receive either no EITC or a tiny EITC that doesn’t offset their payroll (or in some cases, income) taxes. Providing the full Child Tax Credit to the 27 million children who now receive no or only a partial credit because their families don’t have earnings or their earnings are too low would help children in economically vulnerable families and would be particularly beneficial for children of color.
- Extending important expansions in jobless benefits. The CARES Act temporarily expands the group of workers eligible for jobless benefits (through the new Pandemic Unemployment Assistance program), increases unemployment benefit levels, which typically are very low, and increases the number of weeks that workers can receive jobless benefits. These expansions are particularly important for low-paid workers, disproportionately workers of color, who often are ineligible for standard unemployment benefits and receive low benefits when they do qualify. The next package needs to continue both eligibility expansions and benefit improvements and needs to provide access to additional weeks of jobless benefits.
- Providing more help for immigrant families. Immigrant families left out of the stimulus payments should be made eligible for those payments and the package should undo the harmful public charge regulation that is coercing immigrants and their family members to forgo health and nutrition assistance they are eligible for and that could help them weather the economic crisis and access health care during the pandemic.
- Providing relief funding for child care to ensure that providers are available when it is safe to reopen. Like schools, many child care providers shut down in the wake of the pandemic. There is growing concern that without significant relief funding many will go out of business after long closures or periods of sharply reduced enrollment, making it harder for parents to return to work when jobs become available.
The second set of measures should consist of robust fiscal relief for states, localities, tribal nations, and U.S. territories including an increase in the share of Medicaid paid for by the federal government to help meet rising needs for Medicaid and grant-based aid that states and other governments can use to avert deep cuts in education, transportation, and services for struggling households. Even as states’ revenues are plummeting, their costs are rising. More people need help through programs like Medicaid because their earnings are falling or they have lost their jobs and job-based health coverage. Shoring up Medicaid is particularly important for Black and Latino people, who are more likely than white people to get coverage through Medicaid. In addition, public schools and colleges are facing enormous costs to respond to the health crisis, to implement online learning, and (for postsecondary institutions) to cope with reduced tuition revenues.
Without additional aid, states and other governments very likely will cut funding for public services that reduce hardship and increase opportunities, from education to transportation to services for those struggling to get by. That will worsen racial and class inequities that already are growing more acute as a result of the pandemic and recession.[2]
The National Governors Association has called for robust increases in federal Medicaid funding and grant aid to support state and other governments to help address these needs. The House-passed Heroes Act includes robust support in this area.
Economic Fallout From COVID-19 Is Severe and Causing Substantial Hardship
The economic fallout from the pandemic began in earnest in the latter half of March. Since then, job losses have been larger than at any time during the Great Recession and hardship has hit extremely high levels. The health impacts of the virus,[3] job losses, and serious measures of deprivation — difficulty affording food and being behind on rent — are widespread, affecting tens of millions of people.
But the impacts are not affecting all groups evenly, with the crisis hitting Black, Latino, Indigenous,[4] and immigrant households particularly hard. Inequities, driven by racism and discrimination, in education, housing, employment, and health care, among other factors, mean that workers in these communities disproportionately work in low-paid jobs that have been heavily affected by the crisis, households have fewer assets to fall back on in hard times, and individuals are more likely to have underlying health conditions.
The crisis is causing hardship well beyond those who have lost employment or income directly due to the pandemic. Expanded unemployment benefits are helping millions of people get by, but many people hard hit by the crisis are not receiving jobless benefits. This includes many people who were out of work before the crisis who may now face a far longer period of joblessness because jobs are scarce, people newly entering or re-entering the job market, and those who completed temporary jobs but do not meet the eligibility criteria for jobless benefits and are having difficulty finding work.
Even during good economic times, household circumstances change, and people move in and out of poverty. About half of families that exit poverty from one year to the next do so because their earnings rise.[5] A family may fall on hard times for a variety of reasons, such as when an adult leaves a job (or is terminated) because she is ill or needs to care for a new baby or an ill family member or when an employer cuts back a worker’s hours. The family may move out of poverty when an adult is able to go back to work or her employer adds back shifts. With unemployment expected to remain high for a number of years,[6] households that might have exited poverty when a worker was able to find a new job and return to work now may find themselves without enough resources to buy food or pay their rent for an extended period.
There are other reasons that many families are facing difficulty affording the basics. Families that teeter on the line between poverty and just above it have little in the way of savings, and getting help can be harder during a sharp downturn when families and friends are also financially stressed. Children are at home more and not receiving meals through federal nutrition programs at school or child care programs. Prices for food and certain household items are on the rise due to supply chain issues.[7] And relief measures, including nutrition assistance boosts, eviction moratoriums, stimulus payments, and jobless benefits, have gaps in who is eligible, can be difficult for people to navigate, and have sometimes featured implementation delays — such as in unemployment benefits — that have further exacerbated need.
Long lines at food distribution sites in recent months make clear what a host of new data tell us: many people are facing increased difficulty affording the basics. The hardships we are seeing — difficulty affording food and rent — are near-term crises for families that also have serious long-term consequences. Children in families that struggle in these ways suffer extreme stress and have poorer health and educational outcomes.[8] Adults can also face negative long-term impacts, including poorer health outcomes overall and higher incidences of behavioral health conditions like depression, anxiety, and substance misuse.[9]
To be sure, in response to the current crisis, policymakers provided an unprecedented expansion in unemployment benefits, a halt to evictions in most federally subsidized housing,[10] a larger and more broadly available stimulus payment than was provided in 2008, and a temporary expansion in food assistance through SNAP for some households, among other measures. These relief measures have mitigated hardship for millions of individuals and families, but with gaps in relief measures — including, for example, leaving out the poorest households from any increase in SNAP benefits —implementation challenges, and quickly approaching expiration dates, hardship as measured by various surveys is far too high.
The next round of relief legislation — likely the last before the election and perhaps this year — should both extend the relief measures that are working but are temporary and slated to end well before the crisis abates and address the gaps in the relief efforts to date that are worsening hardship.
New Data Document Hardship
We have nearly real-time data on the unfolding economic crisis from several sources. Data are initial — we are, after all, only a few months into this crisis — but they are sobering, indicating that millions of people are facing significant difficulty affording food and paying rent. Caseloads in SNAP are rising sharply, a sign that need is increasing rapidly.
In April, the Census Bureau started its weekly Household Pulse survey of between 40,000 to 130,000 households in an important effort to get a weekly snapshot of how the health and economic crisis is affecting the nation. In addition, the Urban Institute conducts a periodic nationally representative survey, piggybacking on a longer-running health survey it has conducted since 2013, that also provides information on how the crisis is affecting families. And we have monthly data about unemployment from the Census Bureau’s Current Population Survey (the monthly survey used to calculate the national unemployment rate) and weekly information about unemployment benefit claims from the Department of Labor.
Taken together, these data show that, while available relief is helping, millions of people are struggling to put food on the table and pay the rent.
Food Needs Have Risen Sharply
There has been a rapid and dramatic increase in the number of households that struggle to put enough food on the table during the pandemic, data from several sources show. About 26 million adults reported that their household sometimes or often had “not enough to eat” in the last seven days, according to the Census Bureau’s Household Pulse Survey for the week ending July 7. This reflects 10.8 percent of all adults in the country. When asked why, 5 out of 6 (82 percent) said that this was not just because of reasons such as concerns related to shopping during the crisis but that they “couldn’t afford to buy more food.”
Available evidence suggests food needs have increased substantially compared to pre-crisis levels, though comparing rates across different surveys with different methodologies makes the precise degree of increase difficult to determine. In December 2018, the latest available Census Bureau data before the pandemic, 3.7 percent of adults reported they had “not enough to eat” in the household sometimes or often in the last 12 months, according to our analysis using the Current Population Survey. The newer Pulse figure captures such problems only if they occurred in the last seven days, yet it is more than two and a half times higher.[11]
Data from the Household Pulse Survey show wide racial and ethnic disparities in the share of households struggling to afford food, reflecting patterns that have persisted over time and are likely being exacerbated by the pandemic’s disproportionate impact on Black and Latino communities.[12] Black (20 percent) and Latino respondents (19 percent) are more than twice as likely to report that they sometimes or often lacked enough to eat than white respondents. (See Figure 2.)
Particularly alarming is the reported rise of food insecurity among children. (Food insecurity is the limited or uncertain access to food due to lack of financial resources.) Food insecurity among children indicates that food needs have become so severe that parents are no longer able shield their children from disruptions to their food intake.
In the Household Pulse Survey, 10 to 19 percent of adults living with children indicated that the children did not have enough food because of financial problems. Nearly 1 in 5 adults with children (almost 19 percent) reported that “the children were not eating enough because we just couldn’t afford enough food” either sometimes or often in the last seven days (for the week ending July 7). In a separate survey question, some of these same adults characterized their household’s problem as being more about not having kinds of food the household wanted to eat, rather than not having “enough.”[13] (Not having kinds of food that a family wants to eat is another indicator that the federal government uses to help identify food insecurity.) Ten percent of adults with children stated on both questions that the household lacked “enough food.”
This range of estimates translates into approximately 8 to 15 million children who live in a household in which the children were not eating enough because they couldn’t afford enough food. [14]
Food insecurity among children appears to be substantially higher now than before the pandemic. For example, in 2018, at most about 3 percent of adults reported that children were sometimes or often not eating enough at some point in the last 30 days.[15]
While making comparisons over time requires caution due to differences in survey design and implementation, such as survey mode (online, telephone, or in-person survey) or reference period (last 7 days, 30 days, or 12 months), other data sources and researchers have also found evidence that more families with children are struggling to buy enough food.
- Analyses for the Brookings Institution using data from the COVID Impact Survey, the Survey of Mothers with Young Children, and the Household Pulse Survey on families’ ability to afford sufficient food during the pandemic find that “it is clear that young children are experiencing food insecurity to an extent unprecedented in modern times.”[16]
- Food insecurity may have doubled overall and tripled among households with children in April and May 2020, according to estimates by Diane Schanzenbach and Abigail Pitts using data from the COVID Impact Survey, Current Population Survey, and other sources.[17]
The Pulse data allow us to estimate the share of households reporting difficulty getting enough food and the share of households with children in which the children were not eating enough because they couldn’t afford enough, by state. (See Appendix Table 1.) To increase the sample size, we average data from the two most recent weeks of the survey. Given the size of the survey, differences between states may reflect sampling error, so we suggest not drawing strong conclusions from modest differences between states. The data do show, however, that high levels of food need are widespread across the country.
Making matters more difficult for strapped families, food prices have risen in recent months. Due to factors such as supply disruptions, supermarket and grocery store food prices were 5.6 percent higher in June 2020 than in June 2019, compared to just a 0.6 percent rise in overall prices over the same period.[18]
SNAP Is Responding to Rising Need
After unemployment insurance, SNAP (formerly food stamps) has been the program most responsive to rises in need during and after economic downturns, and this crisis is no exception. While national data are not yet available, data from 42 states suggest that the number of people receiving SNAP increased by 17 percent between February and May.[19] If the increases in the states for which data are not available are the same as in the states where we have data, that would translate into an increase of about 6.2 million people receiving SNAP benefits in just three months. These increases are unprecedented: at the onset of the Great Recession it took 17 months to add this number of people to SNAP. While SNAP participation in most states is still substantially lower than during the peak months after the Great Recession, the increase so far due to COVID-19 has been rapid.[20]
Appendix Table 2 shows the increase in SNAP caseloads for the states for which we have data through May. The differences in the increase in caseloads across states in part reflect differences in job losses and the degree to which, in May, businesses were or weren’t operating. They also may reflect how quickly states adapted their SNAP application processes to almost entirely remote communications (i.e., online and telephone). The Families First Act, the first large-scale relief bill enacted in March, allowed Department of Agriculture (USDA) to provide states substantial flexibility in program operations to help them manage their workloads to focus on processing new applications.[21]
The substantial increase in SNAP caseloads indicates both that the need for SNAP benefits has risen rapidly and the program has been able to quickly process new applications as need rose.
Risks of Eviction and Homelessness Are Rising
An estimated 13.1 million adults who live in rental housing — 1 in 5 adult renters — were behind on rent for the week ending July 7, the Pulse survey finds.[22] These figures include those not paying rent (11.6 million) or having their rent deferred (1.5 million).[23]
The Pulse data show wide racial and ethnic disparities in the share of renters behind on rent. (See Figure 3.) The long history of explicitly and implicitly racist government housing policies, combined with ways in which racism has limited employment and wealth-accumulation opportunities for generations, has resulted in Black and Latino people being more likely to be renters, rather than homeowners. These barriers have also created income disparities that put Black and Latino people at higher risk of not being able to afford their rent.[24]
Nearly 1 in 3 Black and about 1 in 4 Latino adults in rental housing (30 percent and 23 percent, respectively), as well as 1 in 7 Asian (14 percent) and non-Hispanic white (13 percent) adults in rental housing, reported being behind on last month’s rent.[25]
- Households with children are facing significant housing affordability challenges. More than 1 in 4 adults who are parents or otherwise live with children (27 percent) is behind on rent, more than double the figure for adults not living with anyone under age 18 (13 percent).[26] Some 7 million children live in a household that is behind on rent.[27]
- Housing hardships show no sign of easing in the Pulse data, even as the data suggest some reduction in unemployment since late April. As of the week ending July 7, 18.8 percent of adults in rental housing reported falling behind on rent in the last month, compared to 17.3 percent from the survey’s first week.[28]
Appendix Table 3 shows the number of adults reporting that they are behind on rent by state.
Unfortunately, a lack of comparable earlier data makes it difficult to tell how much the inability to pay rent has increased overall and by subgroup. The number of households with incomes too low to afford housing has been rising for decades. From 2001 to 2018, median inflation-adjusted rents rose 13 percent, while renters’ median inflation-adjusted incomes were flat.[29] Partly as a result, 10.7 million low-income households, containing 23 million people, paid over half their income for rent in 2018, often forgoing necessities like food or medicine to remain housed.[30] (The federal government considers housing unaffordable if it costs more than 30 percent of a household’s income.) The high cost of housing as compared to households’ incomes is a key reason that many low-income households are facing this crisis with little in savings that they can tap.
While eviction moratoriums are protecting some households for the moment, renters who cannot afford to pay rent continue to accrue debt that may cause a wave of evictions once the moratoriums end. Without adequate relief measures that lift struggling households’ incomes and rental assistance for those who can’t afford housing, we could soon see large numbers of evictions.
Homelessness
The Pulse data don’t provide new information on people experiencing homelessness, but we know that on any given night prior to the pandemic over 500,000 people were without a home. Many are at risk of contracting and dying from COVID-19 because they often have pre-existing chronic health conditions, like diabetes, heart disease, or asthma, or are older adults.[31] Black, Latino, and Native American people are disproportionately represented in the homelessness system, the most recent Department of Housing and Urban Development data show.[32] Estimates are that 40 percent of people experiencing homelessness are Black, while they make up only 13 percent of the general population.[33]
In April, the Centers for Disease Control and Prevention (CDC) conducted an analysis of shelters in four cities — Boston, San Francisco, Atlanta, and Seattle — where they studied almost 1,200 shelter residents and over 300 staff. They found that 25 percent of shelter residents and 11 percent of staff had contracted COVID-19.[34] The nation’s homelessness programs typically feature congregate settings like shelters and soup kitchens, which make social distancing challenging and probably contributed to the spread of the virus.
The CDC analysis and the high risks faced by people experiencing homelessness underscore the importance of helping those experiencing homelessness and those at risk of homelessness to secure stable and safe housing during this crisis.
Unemployment Is High and Hitting Low-Paid Workers Hardest
Job losses and a weak labor market for those who were out of work even before the crisis hit are a key reason that many are struggling to make ends meet. Here, too, the impacts are not evenly shared, with the pain of job losses falling heavily on workers of color and immigrants.
Unemployment insurance claims rose rapidly beginning in March and the official unemployment rate quadrupled between February and April to 14.7 percent — a level not seen since the 1930s, and the Labor Department indicated that the April rate was understated because of measurement issues. Despite subsequent employment gains, unemployment still stood at 11.1 percent in June, which surpasses any point in the Great Recession.
Appendix Table 4 provides state-by-state data on the unemployment rate over the April-June period and data on ongoing unemployment benefit claims.
Note that the June unemployment data predate the latest sharp rise in COVID-19 cases that has led some states and localities to reimpose selected business restrictions and has given pause to many consumers, employers, and workers concerned about the health risks of many activities.
Job losses have been enormous, with 20 million nonfarm jobs lost in April, more than ten times the previous record for monthly job losses with data going back to 1939. While some jobs returned in May and June, there were still 14.7 million fewer jobs on private and government payrolls in June than in February, Labor Department data show.[35]
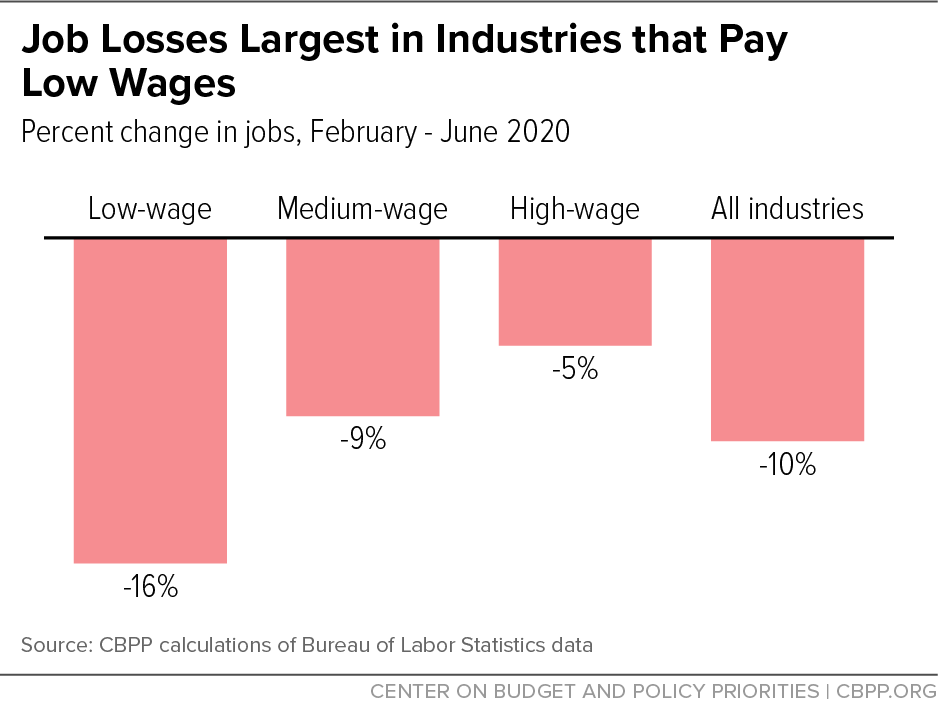
The majority of jobs lost in the crisis have been in industries that pay low average wages, with the lowest-paying industries accounting for 30 percent of all jobs but 52 percent of the jobs lost from February to June, the latest month of Labor Department employment data. Jobs in low-paying industries were down almost twice as much between February and June 2020 (16.3 percent) as jobs in medium-wage industries (8.9 percent) and three times as much as in high-wage industries (5.4 percent). (See Figure 4.)
Barriers to educational and job opportunities substantially influenced by historical and ongoing racist policies and practices have led to Black and Latino workers disproportionately being employed in jobs that pay low wages, which as noted above have seen high rates of job loss. The official unemployment rate in June was 15.4 percent for Black workers, 14.5 percent for Latino workers, and 10.1 percent for white workers. And the job market improvement of the last couple of months has disproportionately benefited white workers. Between April and June, unemployment fell by 4.1 percentage points for white workers but just 1.3 percentage points for Black workers. Unemployment among Latino workers, which is typically between the rate for Black and white workers, rose to become the highest of the three in April, but subsequently fell faster than the Black rate.
Job losses have also been steeper for foreign-born workers (which includes individuals who are naturalized citizens) than for U.S.-born workers. Unemployment increased for foreign-born workers from 3.6 percent in February to 13.8 percent in June, an increase of 10.2 percentage points. The increase among U.S.-born workers, by contrast, was 6.9 percentage points, rising from 3.8 percent to 10.7 percent over the same period.[36]
Workers are experiencing unusual employment instability, with millions of workers laid off as some businesses shrink or fail even as some other businesses are able to reopen and some workers go back to work. Workers filed almost 45 million initial claims for state unemployment benefits between mid-March and the end of June, with an average weekly filing rate that is over 6 times greater than during the Great Recession in 2008 and 2009. (These initial claims data do not account for the millions of initial claims filed for the Pandemic Unemployment Assistance program, a new program that provides jobless benefits to certain workers ineligible for regular state unemployment benefits.)
Most forecasters expect the unemployment rate to remain high for several years. The Congressional Budget Office (CBO) projects the national unemployment rate will be 9.4 percent in the first quarter of 2021 and 7.6 in the fourth quarter of 2021. CBO does not project that unemployment will fall below 6 percent (a level well above the pre-crisis level of 3.5 percent) until 2024.
Recessions Result in High Unemployment for Black Workers That Lasts Longer Than for White Workers
In data back to the 1970s, unemployment rates for Black and Hispanic workers are consistently higher than for white workers. While the gaps narrow when the economy is closing in on full employment, they widen quickly in a recession and narrow much more slowly for some time after the economy begins to recover.
These disparities do not arise primarily from differences in the age structure or other observable characteristics of these populations, Federal Reserve researchers find.a They also find that the salient feature explaining disparities in labor market outcomes is that Black and Hispanic workers are more likely to lose their jobs than white workers, and that the higher risk of losing one’s job is the key driver of racial unemployment gaps over the business cycle.
These facts and the persistence of racial and ethnic disparities in labor market outcomes even in the very low-unemployment period before the pandemic indicate that deeper forces are at play. The United States’ history of structural racism curtails employment opportunities through many policies and practices such as unequal school funding and mass incarceration, as well as outright job discrimination. These forces contribute to a pattern of Black workers tending to be the last hired and first fired.b
While not sufficient to eliminate these disparities, a robust economic recovery and long expansion can contribute substantially to reducing them. If this recession follows the historical pattern, however, with Black unemployment remaining higher and falling more slowly as the economy begins to recover from the recession, then the Black-white unemployment gap will widen in the early stages of the recovery. This highlights the importance of keeping in place relief measures, which also stimulate an economic recovery, until the economy is in much better shape than it is likely to be for some time.
a Tomaz Cajner et al., “Racial Gaps in Labor Market Outcomes in the Last Four Decades and over the Business Cycle,” Federal Reserve Board, June 12, 2017, https://www.federalreserve.gov/econres/feds/racial-gaps-in-labor-market-outcomes-in-the-last-four-decades-and-over-the-business-cycle.htm.
b See Olugbenga Ajilore, “On the Persistence of the Black-White Unemployment Gap,” Center for American Progress, February 24, 2020, https://cdn.americanprogress.org/content/uploads/2020/02/20113909/Unemployment-Gap-1.pdf, and Kenneth A. Couch and Robert Fairlie, “Last Hired, First Fired? Black-White Unemployment and the Business Cycle,” Demography 47 (2010), https://www.ncbi.nlm.nih.gov/pmc/articles/PMC3000014/.
Indigenous Communities Hard Hit by Crisis
Indigenous communities are also disproportionately affected by the current health and economic crisis, though specific impacts are difficult to track because many states and even large federal surveys, including the Pulse Survey, fail to collect data on this population. A legacy of colonialism, broken treaties, and chronic underfunding of education, housing, and health care services have created conditions that make Indigenous people especially vulnerable to the physical and economic impacts of this pandemic.
Tribal members have high levels of COVID-19 infections and deaths, and many live in areas that have incurred severe economic impacts from the pandemic.[37] American Indian and Alaska Native people faced high levels of housing challenges prior to the crisis. For example, American Indian households on tribal lands are nearly four times more likely to lack complete indoor plumbing than all other households in the United States, and emerging research has linked a lack of complete indoor plumbing to higher rates of COVID-19 infection.[38]
Negative Impacts of Hardships Are Long-Lasting
When a household is unable to reliably afford food, or has difficulty remaining stably housed or loses their housing, the impacts are serious and long-lasting for both children and adults.
-
Food insecurity. Food insecurity among children can have long-lasting negative consequences.[39] For infants and young children, inability to afford good nutrition can lead directly to poorer lifelong outcomes, a large body of research finds. For example, children in food-insecure homes are more likely to have iron deficiency serious enough to trigger anemia, a red blood cell disorder.[40] Early iron deficiency (with or without anemia) is linked with long-term neurological damage.[41]
School-aged children who don’t get enough to eat may have more difficulty learning in school, which can translate to worse longer-term outcomes, such as lower high school completion rates and lower earnings potential.[42]
Moreover, being unable to provide food and other basic needs can also impose harmful levels of stress on parents and families that, if sustained, have measurable and long-lasting effects on young children’s health and learning.[43]
Conversely, interventions that provide access to affordable food and reduce food insecurity have been linked to better health for young children as well as long-term improvements in health (such as less heart disease and high blood pressure) and longevity; greater high-school completion; and higher earnings and self-sufficiency in adulthood, whether by improving nutrition or reducing harmful stress.[44]
-
Housing instability and homelessness. Among children, homelessness is associated with increased likelihood of cognitive and mental health problems,[45] physical health problems such as asthma,[46] physical assaults,[47] accidental injuries,[48] and poor school performance.[49] Studies find that children in crowded homes score lower on reading tests[50] and complete less schooling than their peers,[51] perhaps due to lack of space to do homework and higher stress.[52] Also, frequent family moves are linked to attention and behavioral problems among preschool children.[53]
The negative impacts of homelessness are not limited to children. People forced to double up in crowded housing, or sleep in emergency shelters or on the streets, are at increased risk of contracting COVID-19 and exacerbating other health conditions. Moreover, people experiencing homelessness, even if only for a short period of time, have more difficulty securing employment, risk developing mental health or substance use conditions, and may face violence or trauma due to unsafe living conditions.[54]
The harm from food insecurity and housing instability, which fall more heavily on people of color, does not only affect individuals. When children’s prospects are shortchanged and when adults face greater health challenges and more difficulty finding work, the economy as a whole loses out.
Fortunately, there are effective mechanisms for reducing food insecurity and stabilizing housing. The temporary increase in SNAP benefits put in place during the Great Recession was shown both to reduce poverty and reduce food insecurity.[55] And, rental assistance has been shown to be effective at reducing homelessness and improving housing stability, as measured by fewer moves.[56]
Relief Measures Shored Up Low-Income Households’ Budgets
The Families First Act and the CARES Act include important measures that have shored up household incomes and reduced hardship. These include: expanded unemployment benefits; direct stimulus payments through the IRS; increased nutrition benefits for some SNAP recipients (though not the poorest households); replacement benefits for children losing school meals; modest but important fiscal relief to states, territories, tribes, and localities that has reduced the immediate need for them to cut services and jobs and shored up Medicaid programs; and funding for homelessness services and prevention.
Early evidence is that these measures have made an important difference in helping lower-income families pay their bills, though the hardship data discussed above make clear that significant gaps remain for many households.
A study by Harvard economist Raj Chetty and his colleagues at Opportunity Insights examined expenditures by lower- and higher-income households. (This included expenditures made by debit and credit cards, not those made in cash or by check and, thus, did not include certain payments, like rent paid by check.) The study found that in the early weeks of the crisis, both high- and low-income consumers reduced their spending significantly, though the drop in consumption was larger among high-income households. As the crisis continued and various relief measures kicked in, consumption by low-income households returned to near pre-crisis levels. In mid-June, spending among low-income consumers was down only 2.9 percent.[57] By contrast, consumption among higher-income households in mid-June remained 12.7 percent below pre-crisis levels, reflecting that higher-income households continued to curtail their more discretionary-heavy expenditures. Other researchers have reached similar conclusions.[58]
A recent Urban Institute study also offers evidence of the effectiveness of relief measures in reducing hardship. This study looked at the same households twice, in late March/early April and then again in May. It finds that for households that applied for unemployment benefits and received them by the second survey, the rate of food insecurity fell and they expressed fewer worries about paying a range of bills. By contrast, households that applied for unemployment benefits but had not received them by May (either because of backlogs in unemployment benefit processing or because they were found ineligible) experienced no such decline in hardship; in fact, a different sign of hardship (having unmet needs for medical care because of cost) rose for them by more than one-third.[59]
Given the significant increase in unemployment, providing enough relief to lift lower-income households’ consumption on average to close to pre-crisis levels is an important policy achievement. But there are important caveats. First, consumption on average was close to pre-crisis levels, but some households have seen income and consumption losses or faced difficulty paying rent (which the Chetty study does not measure). As we discuss in more detail below, some households were left out of relief measures, some have received far less than they need, and some have faced significant delays in receiving help. This has contributed to the high numbers of households facing difficulties affording food and paying rent, making clear that many need more help. Second, the relief measures that bolstered consumption by low-income consumers are temporary, slated to expire well before unemployment has receded.
Relief Measures Targeted on Those Struggling Are Most Effective at Reducing Hardship and Boosting the Economy
Effective relief measures reduce hardship and shore up the economy. To reduce hardship, measures must be targeted on those who need help, including those hard hit by the downturn and those struggling to make ends meet. To boost the economy, measures must generate demand for goods and services. That’s why providing a tax break or other forms of assistance to higher-income households typically is low bang-for-the-buck in terms of generating demand — when higher-income people get a modest income boost, they tend to save, rather than spend, most of it.[60] This is particularly true in the current crisis, when many high-income people have restricted their activities and spending out of concern for the health risks associated with those activities.
Research from both Mark Zandi of Moody’s Analytics[61] and CBO[62] shows that policies such as unemployment benefits, increased SNAP benefits, tax benefits targeted on low-income households and fiscal relief for states and localities (which helps avert cuts that, in turn, would result in layoffs and reduced spending) are highly effective at stimulating the economy because they help those who are struggling and, thus, quickly spend the assistance they receive. When households spend the relief funds they receive, they help shore up the incomes of the businesses and workers that produced and sold the goods and services. These workers, in turn, will be less likely to cut back on their own spending, shoring up the incomes of still more business and workers. Targeted relief measures result in a chain of events that generates more economic activity than the cost of the relief.
In contrast, wealthier households, which have more of a financial cushion, typically save rather than spend a significant portion of any assistance they receive (usually in the form of tax cuts). This is particularly the case now when high-income people are restricting their spending because of issues related to the pandemic. As a result, such tax cuts do little or nothing to reduce human hardship while also doing little to bolster demand.
Key Relief Measures Are Expiring and Gaps Have Left Some Without Help
Key relief measures enacted so far are temporary; with provisions slated to end well before the labor market has recovered:
- The $600-per-week increase in unemployment benefits only lasts through July while the eligibility expansions and increase in the number of weeks of benefits ends December 31.
- The increase in SNAP benefits for some households that was included in the Families First Act is tied to federal and state public health emergency declarations and will therefore stop before the economy fully recovers and low-income households’ need for additional food assistance subsides.
- The authority for states to provide replacement benefits to children missing out on school meals (known as the Pandemic EBT program or P-EBT) ends in September, even though schools may be closed or operate on a partial schedule and feature significant online education again for the next school year.
- The Families First Act’s increase in the share of Medicaid that the federal government funds is tied to the duration of the federal public health emergency, and it is not clear how long that will last.
- The eviction moratorium in the CARES Act related to federally funded properties — which has not kept households from falling behind on rent and owing substantial arrearages — expires July 25 and the moratoriums put in place by states and localities are starting to expire as well.
If these provisions are allowed to expire, or are extended in ways that provide insufficient help, a significant rise in serious hardships, including hunger and homelessness, almost surely will ensue. And, as noted above, these hardships will have long-lasting negative effects on both adults and children — and the economy as a whole.
The next legislative package should also address limitations to the relief measures enacted so far, which have made them less effective at combatting hardship.
-
Many immigrants have little or no access to help. Immigrants who do not have a documented status are ineligible for unemployment benefits when they lose jobs as well as for nutrition assistance through SNAP and comprehensive health care through Medicaid (though they can access certain emergency services). The CARES Act denies the stimulus payments — payments of $1,200 per adult and $500 per child — to entire families if one of the adults in the family lacks a Social Security number (SSN). This provision has denied help to many struggling families, including families that include adults and children who have SSNs and even are U.S. citizens.
Individuals with lawful immigration statuses also often don’t have meaningful access to assistance. The Trump Administration’s harsh public charge rule has made many immigrants and their family members afraid to access SNAP, Medicaid, and other forms of assistance for fear that receiving assistance for which they are eligible will hurt their ability to become or remain lawful permanent residents (also known as green card holders). Urban Institute surveys of adults in families that include immigrants have documented large numbers of immigrants, and their family members, forgoing benefits such as SNAP and Medicaid for which they are eligible out of fear. More than 1 in 4 (26 percent) adults in low-income immigrant households reported forgoing assistance due to fear of “risking future green card” status, Urban Institute’s researchers found.[63]
Coercing immigrants and their family members to forgo needed health and nutrition assistance can increase hardship and jeopardize health even during normal economic times. During a deep downturn amid a pandemic that is disproportionately affecting immigrants and their families, the public charge rule and the fear that it engenders could result in especially severe impacts.
- Help for the individuals and families with the least income has been modest. Many of the families with the lowest incomes have received modest or no help from important relief measures, yet many of these families are under enormous stress. These shortcomings fall disproportionately on people of color who are more likely to have very low incomes.
-
Nutrition assistance. The Families First Act included a temporary provision that provided increased SNAP benefits (called “emergency allotments”) to many SNAP households, but the Agriculture Department adopted an interpretation of the provision that excluded the poorest households from the SNAP increase. Some 12 million people, including at least 5 million children, were left out of the SNAP increase.[64] These households have very low incomes. For example, among families of three that are excluded from the Families First Act’s emergency allotments, almost half (47 percent) have no monthly cash income and the average income among the others is just 28 percent of the federal poverty line (about $500 for a family of 3 in 2020).
Moreover, with schools closed, many children missed out on two meals each weekday that they normally would receive for free or at a reduced price at school. While almost every state has now launched the temporary Pandemic EBT program to provide resources to households on electronic benefit cards to compensate them for the meals, that program took several months for states to put in place and the replacement benefits are not available for the summer months and will not continue beyond September without an extension.
- Stimulus payments. In theory, households with very low or no income (other than certain immigrant households discussed above) qualify for the stimulus payment, but households that have not filed a tax return in recent years (and do not receive certain federally administered benefits like Social Security) must file a form with the IRS to receive that payment. Many may not understand that requirement and so, to date, have not yet received it.
- Rental assistance. The homelessness-related funding in the CARES Act is less than researchers have said is needed to shore up the homelessness services system to ensure that it can expand to meet demand and revamp shelters and other programs so they are safe during the pandemic.[65] Moreover, there has been very little increased funding for rental assistance. This means that housing agencies don’t have the eviction prevention resources they need to provide either short-term or ongoing rental assistance to households unable to pay the rent.
-
-
Fiscal relief for states and other governments has been too small to stave off significant cuts. The Families First provision increasing the share of Medicaid paid for by the federal government is far too small, providing less help than the federal government provided during the Great Recession, which was not accompanied by a pandemic and where the job losses were smaller than we currently face. Similarly, the grant aid provided by the CARES Act is far less than states, territories, tribes, and localities need to prevent deep cuts in a range of areas that will lead to layoffs of teachers and other workers and cuts in essential services for residents — further dragging down the economy and likely worsening racial and economic inequities.[66]
That’s what happened in the aftermath of the Great Recession. For instance, state cuts to public colleges and universities sent tuition soaring, leaving many students and their families saddled with onerous debt or unable to afford college altogether. That’s especially true for students of color who — due largely to historical racism and ongoing discrimination — have long faced high barriers to attending college.[67] Cash-strapped states and localities also increased their reliance on criminal legal fees and fines, which fall particularly hard on low-income people of color caught up in a discriminatory law enforcement system and often result in people being jailed simply because they cannot pay these fees.[68]
States alone are facing a cumulative revenue shortfall of about $555 billion over the state fiscal years 2020-2022.[69] Local governments also face substantial shortfalls roughly equal to half the shortfalls faced by states.[70] Further, while the CARES Act provides some aid to tribal nations, it was not enough. Tribal government revenues have been particularly hard hit by the pandemic, and Indigenous communities are particularly vulnerable to the virus.[71] Puerto Rico and other U.S. territories also face particularly difficult fiscal challenges and require additional aid.[72]
Next Package Needs to Include Effective Relief Measures That Help Hard-Hit Households
Congress will soon debate the next relief package — likely the last relief package before the election and perhaps until next year. This package will need to be robust enough to ensure that families can make ends meet and are ready to re-engage in the economy fully when it is safe to do so.
To be sure, there are limits to how much policies can affect the overall state of the economy given the ongoing health crisis. Consumption and employment are down because of the dangers associated with the pandemic, which has led people to restrict their activities and some state and local governments to place limitations on certain kinds of businesses. There is emerging evidence that the public’s understanding of the virus’ risks and the steps they are taking to try to stay safe are likely more important than official government actions in curtailing economic activity.[73]
Given this, it is critical that we adopt relief measures that ensure that those hard hit by the crisis — including those who have lost jobs directly because of the crisis and those who were struggling to make ends meet before the crisis and now face greater challenges — can pay their rent, keep food on the table, and meet other basic needs. If we fail to do this, hardship will worsen, with devastating near- and long-term consequences, and the burden will be heaviest on those disproportionately affected by the crisis, including people of color, immigrants, and Indigenous communities. In the near term, people will lack food and evictions and homelessness will rise. This will make it harder for those individuals to re-engage with the labor market when jobs become available and the worst of the health crisis has passed, slowing our eventual recovery. In the longer term, lack of adequate food, housing instability, and homelessness will have negative health consequences for children and adults alike. Such a path would exacerbate the nation’s already glaring inequities, once again making it harder for people of color to benefit from the recovery.
And providing relief targeted to those who need it will boost the economy to a larger degree than providing relief to higher-income people, recognizing that the economy will not fully recover until the health crisis is past.
Thus, the next package should include two sets of measures, designed to continue successful policies and address the shortcomings identified above.
The first set should help those struggling the most. This should include:
-
Increasing SNAP benefit levels and ensuring that all SNAP recipients get the additional help. The House-passed Heroes Act would increase SNAP benefits by a modest 15 percent, providing an additional $25 per person per month, or roughly $100 per month in additional benefits to a family of four. This increase would help all SNAP households, including the poorest households with the greatest challenges affording food.[74] While SNAP benefits are too low even during better economic times, during sharp downturns low benefit levels are particularly problematic because many families will be out of work or earning very low pay for longer periods and with less help available from extended family.[75]
The House bill includes other important changes to SNAP, including a provision that would pause the requirement that states cut off food assistance to certain individuals who cannot find 20 hours per week of employment and another that would prohibit the Administration’s regulatory proposals to cut eligibility and benefits to millions of people.
The fact that SNAP participation has grown by 6.2 million in just three months is evidence of SNAP’s valuable role in quickly reaching a broad cross-section of low-income households. SNAP benefits are well targeted to low-income households who struggle to afford a basic diet, a group that disproportionately includes people of color.[76] Increasing SNAP benefits during the Great Recession reduced food insecurity and poverty.
-
Increasing funding for homelessness services, eviction prevention, and housing vouchers. More resources are needed to shore up the homelessness services system, so that it can revamp its facilities to facilitate social distancing and other health protocols, administer COVID-19 testing and health care, deliver enhanced street outreach services, and provide safe non-congregate shelter options. Substantial additional resources are also needed for rental assistance to ensure that more struggling households get the help they need to pay rent for as long as they may need that help. While short-term assistance, which is also needed in the next package, can help many households, some households — such as people with histories of homelessness, those leaving domestic violence situations, and people with disabilities and housing instability — will likely face housing and employment challenges for several years and need the longer-term assistance provided through housing vouchers.
Vouchers are especially vital to reducing the racial inequities exacerbated by the crisis. Seventy percent of households currently receiving vouchers are people of color,[77] and vouchers have a record of reaching low-income Black renters in need of assistance.[78] Housing vouchers lift more than 1 million people out of poverty[79] and can provide families with the chance to move to neighborhoods with less poverty and crime and better-funded schools that they otherwise would not be able to afford.
- Providing emergency grants to states so they can target help to families falling through the cracks. Even well-designed relief measures will miss some households or be inadequate for those facing serious crises. The next package should include funding for states that will allow them to provide cash or other help to individuals and families at risk of eviction or other serious hardships and, when it is safe to do so, create subsidized jobs that can help those with the greatest difficulty finding employment in a weak labor market an opportunity to work. Versions of this proposal, modeled on the TANF Emergency Fund created during the Great Recession, have been put forward by Senator Wyden and included in the Heroes Act.[80]
- Temporarily expanding the Earned Income Tax Credit (EITC) for workers without minor children at home and the Child Tax Credit targeted toward poor and low-income children. Expanding the EITC would help millions of low-paid workers who are now taxed into, or deeper into, poverty because they receive either no EITC or a tiny EITC that doesn’t offset their payroll taxes (and in some cases, income taxes). Some 19 percent of workers who would be helped by the expansion in the EITC for workers without minor children at home are Black and 25 percent are Latino.[81] Providing the full Child Tax Credit to the 27 million children who now receive a partial credit or no credit at all because their families don’t have earnings or their earnings are too low would help struggling families. A fully available Child Tax Credit would lift out of poverty 1 million Black, 1 million Latino, 850,000 non-Hispanic white, 120,000 Asian and Pacific Islander, and 70,000 Native American individuals, including both children and adults in those families.[82] Temporary expansions in these credits would be well-timed, coming early next year (when people file their tax returns), when unemployment is projected to remain very high.
- Extending important expansions in jobless benefits. The CARES Act expands the group of workers eligible for jobless benefits (through the new Pandemic Unemployment Assistance program), increases unemployment benefit levels, which typically are very low, and increases the number of weeks that workers can receive jobless benefits. These expansions are particularly important for low-paid workers who often are ineligible for standard unemployment benefits and receive low benefits when they do qualify. The next package needs to continue both eligibility expansions and benefit improvements and needs to provide access to additional weeks of jobless benefits.
- Providing more help for immigrant families. Immigrant families left out of the stimulus payments should be made eligible for those payments and the package should undo the harmful public charge regulation that is coercing immigrants and their family members to forgo health and nutrition assistance they are eligible for and that could help them weather the economic crisis and access health care during the pandemic.[83]
- Providing relief funding for child care to ensure that providers are available when it is safe to reopen. Child care is an essential service for parents who are working. But like schools, many child care providers shut down in the wake of the pandemic. There is growing concern that without significant relief funding many will go out of business after long closures or periods of sharply reduced enrollment, making it harder for parents to return to work when jobs become available.[84]
The next package should also include robust fiscal relief for states, localities, tribal nations, and U.S. territories including an increase in the share of Medicaid paid for by the federal government to help meet rising needs for Medicaid and grant-based aid that states can use to avert deep cuts in education, transportation, and services for struggling individuals and families such as treatment for substance use disorders, homelessness services, child care, and adult day programs.
States and other governments are facing plummeting tax revenues at the same time costs are rising as more people need help through programs like Medicaid, public health needs continue, and schools and colleges deal with enormous costs associated with responding to the health crisis, implementing online learning, making up for lost learning time, and coping with reduced tuition (in the case of postsecondary institutions). Without additional aid, states and other governments likely will cut funding for public services that reduce hardship and increase opportunities, thereby worsening racial and class inequities. Shoring up Medicaid is particularly important to protecting health coverage for Black and Latino people, who are about twice as likely to get coverage through Medicaid as white people, putting them at risk if states cut Medicaid.[85] The National Governors Association has called for robust additional temporary increases in federal Medicaid funding and grant aid to address these needs, and the House-passed Heroes Act provides important and substantial support.
Appendix
| APPENDIX TABLE 1 | ||||
|---|---|---|---|---|
| High Shares of Households Report Difficulty Getting Enough Food | ||||
|
Among adults; data collected June 25 to July 7 How to read this table: In the United States, nearly 26 million adults reported that their household sometimes or often didn’t have enough to eat in the last seven days. This represents 11 percent of all adults in the country. Over 17 million adults living with children reported that “the children were not eating enough because we just couldn’t afford enough food.” This represents 19 percent of adults living with children. |
||||
| Adults Reporting Household Didn’t Have Enough to Eat | Adults Saying Children in Household Didn’t Have Enough to Eat Because Couldn’t Afford Enough | |||
| State | Number | As a Percent of Adults | Number | As a Percent of Adults Living with Children |
| United States | 25,842,000 | 11% | 17,418,000 | 19% |
| Alabama | 484,000 | 13% | 293,000 | 20% |
| Alaska | 46,000 | 9% | 27,000 | 14% |
| Arizona | 498,000 | 9% | 431,000 | 20% |
| Arkansas | 254,000 | 12% | 196,000 | 22% |
| California | 3,651,000 | 12% | 2,607,000 | 22% |
| Colorado | 336,000 | 8% | 251,000 | 14% |
| Connecticut | 250,000 | 9% | 163,000 | 17% |
| Delaware | 63,000 | 9% | 36,000 | 13% |
| District of Columbia | 83,000 | 16% | 44,000 | 29% |
| Florida | 1,899,000 | 11% | 1,296,000 | 23% |
| Georgia | 990,000 | 13% | 629,000 | 20% |
| Hawai’i | 83,000 | 8% | 79,000 | 21% |
| Idaho | 109,000 | 8% | 62,000 | 12% |
| Illinois | 939,000 | 10% | 575,000 | 17% |
| Indiana | 524,000 | 11% | 339,000 | 17% |
| Iowa | 134,000 | 6% | 98,000 | 12% |
| Kansas | 159,000 | 8% | 90,000 | 11% |
| Kentucky | 427,000 | 13% | 187,000 | 16% |
| Louisiana | 487,000 | 15% | 351,000 | 25% |
| Maine | 98,000 | 9% | 36,000 | 13% |
| Maryland | 501,000 | 11% | 451,000 | 24% |
| Massachusetts | 254,000 | 5% | 263,000 | 15% |
| Michigan | 488,000 | 7% | 288,000 | 12% |
| Minnesota | 326,000 | 8% | 205,000 | 14% |
| Mississippi | 282,000 | 13% | 197,000 | 23% |
| Missouri | 405,000 | 9% | 263,000 | 14% |
| Montana | 71,000 | 9% | 32,000 | 13% |
| Nebraska | 110,000 | 8% | 70,000 | 13% |
| Nevada | 359,000 | 15% | 188,000 | 21% |
| New Hampshire | 80,000 | 8% | 49,000 | 12% |
| New Jersey | 635,000 | 10% | 425,000 | 16% |
| New Mexico | 182,000 | 12% | 102,000 | 17% |
| New York | 1,371,000 | 10% | 1,204,000 | 23% |
| North Carolina | 713,000 | 9% | 522,000 | 20% |
| North Dakota | 36,000 | 7% | 20,000 | 11% |
| Ohio | 1,117,000 | 13% | 602,000 | 19% |
| Oklahoma | 312,000 | 11% | 139,000 | 12% |
| Oregon | 320,000 | 10% | 129,000 | 12% |
| Pennsylvania | 905,000 | 9% | 548,000 | 15% |
| Rhode Island | 73,000 | 9% | 57,000 | 22% |
| South Carolina | 502,000 | 13% | 355,000 | 23% |
| South Dakota | 73,000 | 12% | 47,000 | 20% |
| Tennessee | 626,000 | 12% | 391,000 | 22% |
| Texas | 2,759,000 | 13% | 1,978,000 | 22% |
| Utah | 210,000 | 9% | 118,000 | 12% |
| Vermont | 29,000 | 6% | 10,000 | 6% |
| Virginia | 607,000 | 10% | 357,000 | 14% |
| Washington | 445,000 | 8% | 261,000 | 13% |
| West Virginia | 157,000 | 12% | 82,000 | 16% |
| Wisconsin | 330,000 | 8% | 243,000 | 17% |
| Wyoming | 48,000 | 11% | 27,000 | 18% |
| APPENDIX TABLE 2 | |||
|---|---|---|---|
| Number of SNAP Participants Has Increased Substantially in Almost All of the 42 States That Have Provided Preliminary Data | |||
| Preliminary and subject to change | |||
| State | February 2020 | May 2020 | % change February to May |
| Alabama | 705,000 | 755,000 | 7% |
| Alaska | 81,000 | 88,000 | 9% |
| Arizona | 801,000 | 915,000 | 14% |
| Arkansas | 318,000 | 393,000 | 24% |
| California | 4,063,000 | 4,698,000 | 16% |
| Colorado | 431,000 | 524,000 | 21% |
| Connecticut | 360,000 | 387,000 | 8% |
| Florida | 2,684,000 | 3,661,000 | 36% |
| Georgia | 1,278,000 | 1,707,000 | 34% |
| Hawai’i | 152,000 | 178,000 | 17% |
| Idaho | 149,000 | 151,000 | 2% |
| Illinois | 1,748,000 | 2,032,000 | 16% |
| Indiana | 617,000 | 715,000 | 16% |
| Iowa | 296,000 | 338,000 | 14% |
| Kansas | 190,000 | 209,000 | 10% |
| Kentucky | 482,000 | 624,000 | 29% |
| Louisiana | 770,000 | 843,000 | 10% |
| Maine | 165,000 | 180,000 | 9% |
| Massachusetts | 729,000 | 890,000 | 22% |
| Michigan | 1,176,000 | 1,528,000 | 30% |
| Minnesota | 370,000 | 424,000 | 14% |
| Mississippi | 424,000 | 479,000 | 13% |
| Missouri | 657,000 | 766,000 | 17% |
| Montana | 106,000 | 110,000 | 4% |
| Nevada | 412,000 | 512,000 | 24% |
| New Jersey | 661,000 | 718,000 | 9% |
| New Mexico | 445,000 | 492,000 | 11% |
| New York | 2,560,000 | 2,749,000 | 7% |
| North Carolina | 1,224,000 | 1,383,000 | 13% |
| Ohio | 1,326,000 | 1,610,000 | 21% |
| Oklahoma | 576,000 | 608,000 | 6% |
| Oregon | 586,000 | 691,000 | 18% |
| Pennsylvania | 1,737,000 | 1,907,000 | 10% |
| South Carolina | 568,000 | 625,000 | 10% |
| South Dakota | 78,000 | 79,000 | 2% |
| Tennessee | 844,000 | 891,000 | 6% |
| Texas | 3,284,000 | 3,899,000 | 19% |
| Utah | 170,000 | 166,000 | -2% |
| Virginia | 680,000 | 767,000 | 13% |
| Washington | 801,000 | 923,000 | 15% |
| West Virginia* | 282,000 | 299,000 | 6% |
| Wisconsin | 598,000 | 697,000 | 17% |
| Total these states | 35,586,000 | 41,614,000 | 17% |
| Extrapolated to U.S. | 36,867,750 | 43,113,000 | 17% |
| APPENDIX TABLE 3 | |||
|---|---|---|---|
| Nearly One-Fifth of Renters Are Behind on Rent | |||
| Among adults in rental housing; data collected June 25 to July 7 | |||
| Did Not Pay Last Month's Rent on Time or Deferred Payment | |||
| Number | Percent | ||
| United States | 13,669,000 | 19% | |
| Alabama | 188,000 | 23% | |
| Alaska | 27,000 | 18% | |
| Arizona | 250,000 | 16% | |
| Arkansas | 134,000 | 24% | |
| California | 1,850,000 | 16% | |
| Colorado | 135,000 | 12% | |
| Connecticut | 165,000 | 23% | |
| Delaware | 21,000 | 16% | |
| District of Columbia | 38,000 | 16% | |
| Florida | 1,001,000 | 20% | |
| Georgia | 563,000 | 26% | |
| Hawai’i | 75,000 | 19% | |
| Idaho | 43,000 | 14% | |
| Illinois | 511,000 | 22% | |
| Indiana | 260,000 | 20% | |
| Iowa | 73,000 | 16% | |
| Kansas | 48,000 | 10% | |
| Kentucky | 144,000 | 18% | |
| Louisiana | 301,000 | 33% | |
| Maine | 29,000 | 14% | |
| Maryland | 416,000 | 31% | |
| Massachusetts | 275,000 | 17% | |
| Michigan | 356,000 | 22% | |
| Minnesota | 133,000 | 16% | |
| Mississippi | 120,000 | 30% | |
| Missouri | 264,000 | 24% | |
| Montana | 29,000 | 15% | |
| Nebraska | 40,000 | 12% | |
| Nevada | 166,000 | 20% | |
| New Hampshire | 25,000 | 13% | |
| New Jersey | 456,000 | 23% | |
| New Mexico | 53,000 | 14% | |
| New York | 1,352,000 | 24% | |
| North Carolina | 422,000 | 20% | |
| North Dakota | 25,000 | 19% | |
| Ohio | 432,000 | 18% | |
| Oklahoma | 141,000 | 18% | |
| Oregon | 133,000 | 13% | |
| Pennsylvania | 420,000 | 20% | |
| Rhode Island | 43,000 | 22% | |
| South Carolina | 217,000 | 27% | |
| South Dakota | 37,000 | 29% | |
| Tennessee | 277,000 | 20% | |
| Texas | 1,240,000 | 20% | |
| Utah | 80,000 | 14% | |
| Vermont | 18,000 | 18% | |
| Virginia | 192,000 | 12% | |
| Washington | 208,000 | 11% | |
| West Virginia | 96,000 | 34% | |
| Wisconsin | 123,000 | 13% | |
| Wyoming | 24,000 | 21% | |
| APPENDIX TABLE 4 | ||
|---|---|---|
| Unemployment, Jobless Claims High Across the Country | ||
| States | Unemployment rate (April-June average)a | Current jobless benefits claims for week ending June 27b |
| Alabama | 10.3 | 216,000 |
| Alaska | 12.9 | 65,000 |
| Arizona | 10.8 | 2,496,000 |
| Arkansas | 9.5 | 213,000 |
| California | 15.9 | 4,560,000 |
| Colorado | 11.0 | 341,000 |
| Connecticut | 9.2 | 317,000 |
| Delaware | 14.4 | 58,000 |
| District of Columbia | 9.7 | 88,000 |
| Florida | 12.6 | 582,000 |
| Georgia | 9.9 | 687,000 |
| Hawai’i | 20.4 | 216,000 |
| Idaho | 8.8 | 37,000 |
| Illinois | 15.7 | 817,000 |
| Indiana | 13.7 | 301,000 |
| Iowa | 9.7 | 159,000 |
| Kansas | 9.8 | 203,000 |
| Kentucky | 10.6 | 188,000 |
| Louisiana | 13.0 | 471,000 |
| Maine | 8.8 | 90,000 |
| Maryland | 9.4 | 970,000 |
| Massachusetts | 16.7 | 1,022,000 |
| Michigan | 20.0 | 1,455,000 |
| Minnesota | 9.1 | 412,000 |
| Mississippi | 11.8 | 198,000 |
| Missouri | 9.4 | 317,000 |
| Montana | 9.3 | 88,000 |
| Nebraska | 6.9 | 89,000 |
| Nevada | 23.5 | 455,000 |
| New Hampshire | 14.8 | 74,000 |
| New Jersey | 16.1 | 949,000 |
| New Mexico | 9.8 | 158,000 |
| New York | 15.2 | 2,779,000 |
| North Carolina | 11.1 | 721,000 |
| North Dakota | 8.1 | 37,000 |
| Ohio | 14.1 | 889,000 |
| Oklahoma | 11.3 | 132,000 |
| Oregon | 13.5 | 233,000 |
| Pennsylvania | 14.2 | 3,786,000 |
| Puerto Rico | N.A.* | 854,000 |
| Rhode Island | 15.6 | 117,000 |
| South Carolina | 11.3 | 271,000 |
| South Dakota | 9.2 | 20,000 |
| Tennessee | 12.1 | 418,000 |
| Texas | 11.7 | 1,429,000 |
| Utah | 8.0 | 85,000 |
| Vermont | 12.9 | 50,000 |
| Virginia | 9.5 | 730,000 |
| Washington | 13.7 | 554,000 |
| West Virginia | 13.1 | 70,000 |
| Wisconsin | 11.4 | 251,000 |
| Wyoming | 8.7 | 16,000 |
| U.S. | 13.0 | 31,736,000 |
End Notes
[1] Federal surveys generally ask respondents whether they are “of Hispanic, Latino, or Spanish origin.” This report uses the term “Latino.”
[2] Nicholas Johnson, “Additional, Well Targeted Fiscal Aid Key to Advancing Racial Equity,” CBPP, July 1, 2020, https://www.cbpp.org/blog/additional-well-targeted-federal-fiscal-aid-key-to-advancing-racial-equity. See also Joshuah Marshall, “Tribal Nations Highly Vulnerable to COVID-19, Need More Federal Relief,” CBPP, April 1, 2020, https://www.cbpp.org/blog/tribal-nations-highly-vulnerable-to-covid-19-need-more-federal-relief.
[3] Tiffany Ford, Sarah Reber, and Richard V. Reeves, “Race gaps in COVID-19 deaths are even bigger than they appear,” Brookings Institution, June 16, 2020, https://www.brookings.edu/blog/up-front/2020/06/16/race-gaps-in-covid-19-deaths-are-even-bigger-than-they-appear/; APM Research Staff Lab, “The Color of Coronavirus: COVID-19 Deaths by Race and Ethnicity in the U.S.,” July 8, 2020, https://www.apmresearchlab.org/covid/deaths-by-race.
[4] State, local, and tribal data provide evidence that the crisis is heavily impacting many Indigenous communities, but national data on Indigenous groups are generally unavailable.
[5] José Pacas and Elizabeth Davis, “Moving Into and Out of Rural Poverty,” Focus, Institute for Research on Poverty, December 2018, Vol. 34, No.3, https://www.irp.wisc.edu/wp/wp-content/uploads/2019/01/Focus-34-3b.pdf.
[6] Congressional Budget Office, “An Update to the Economic Outlook: 2020-2030,” July 2020, https://www.cbo.gov/system/files/2020-07/56442-CBO-update-economic-outlook.pdf.
[7] Joseph Llobrera, “Rising Food Prices Means Rising Need for Aid,” CBPP, June 18, 2020, https://www.cbpp.org/blog/rising-food-prices-means-rising-need-for-aid.
[8] Ajay Chaudry and Christopher Wimer, “Poverty is Not Just an Indicator: The Relationship Between Income, Poverty, and Child Well-Being,” Academic Pediatrics, Vol. 16 Issue 3 (April 1, 2016), https://www.academicpedsjnl.net/article/S1876-2859(15)00383-6/fulltext.
[9] See Tori DeAngelis, “Tools for Tough Times,” American Psychological Association Monitor on Psychology, January, 1 2009, Vol. 40, No. 1, https://www.apa.org/monitor/2009/01/americans, and Kathryn Collins et al., “Understanding the Impact of Trauma and Urban Poverty on Family Systems: Risks, Resilience and Interventions,” Family Informed Treatment Center, 2010, https://www.nctsn.org/sites/default/files/resources/resource-guide/understanding_impact_trauma_urban_poverty_family_systems.pdf.
[10] This includes public housing, the Housing Choice Voucher program, Low Income Housing Tax Credit properties, and rural housing programs administered through the U.S. Department of Agriculture and renters in homes with mortgages owned, securitized, or insured by Fannie Mae, Freddie Mac, the Department of Housing and Urban Development, the Department of Agriculture, or other federal agencies.
[11] One comparison found that, before the crisis, people in an online survey were nearly twice as likely to report food insecurity as respondents in a different survey with a live interviewer. Even if the December 2018 estimate of 3.7 percent were twice as high, however, the current figure of 10.8 percent would represent a substantial rise. Moreover, the 2018 survey asked households about their having not enough to eat in the last 12 months; if it had asked about the last week, as the Pulse survey does, the 2018 figure would have been even smaller and the increase since 2018 even bigger. Michael Karpman, Stephen Zuckerman, and Dulce Gonzalez, “The Well-Being and Basic Needs Survey,” Urban Institute, 2018, https://www.urban.org/sites/default/files/publication/98919/the_well-being_and_basic_needs_survey_1.pdf.
[12] LaDonna Pavetti and Peggy Bailey, “Boosting the Safety Net to Help People With Fewest Resources Pay for Basics During the Crisis,” CBPP, April 29, 2020, https://www.cbpp.org/research/poverty-and-inequality/boost-the-safety-net-to-help-people-with-fewest-resources-pay-for.
[13] The Household Pulse Survey asks two questions about not eating enough, one for all household members, another for children. The two indicators do not always agree at first glance. In the latest available data, nearly half of adults who say children in the household did not always get enough food for reasons of affordability also state that their household as a whole got “enough” food “but not always the kinds of food we wanted.” It is not clear whether the apparent discrepancy between these two answers represents an initial reluctance by survey respondents to admit embarrassing food problems the first time they are asked; or the reality that when families don't have the right kind of food, parents may feel that their children didn't get enough of the right kinds of foods; or other factors.
Notably, both groups of adults reporting not enough food for children (the 10 percent who reported consistently on both food questions and those who reported “enough, but not always the kinds of foods we wanted”) also report high rates of housing hardship, with at least 2 in 5 behind on rent or mortgage, bolstering the evidence that these families are struggling financially.
In any event, such potential would-be discrepancies across survey questions are not new but appear in the pre-crisis Current Population Survey data. They do not, therefore, appear to affect the reported increase in food problems discussed below.
[14] When households that had “enough, but not always the kinds of food we wanted” are excluded, an estimated 8 million children lived in households that didn’t have enough food for children. When they are included, the figure rises to about 15 million children. Figures for children are approximations calculated using more detailed Pulse data available for the week ending June 30.
[15] The most comparable pre-pandemic data on child food insecurity is from the December 2018 Current Population Survey Food Security Supplement. However, unlike Pulse, this survey only asked certain (more-disadvantaged) households about children’s food insecurity. A CBPP analysis of these data found that 1.2 percent of all adults with children reported this form of child food insecurity in the past 30 days but the share was higher (3.0 percent) among the households that were asked the question. If all households had been asked the question, including less-disadvantaged households, the share responding “yes” would presumably have been higher than 1.2 percent but lower than 3.0 percent. This is because the 1.2 percent figure is too low because some of those not asked would have identified that the children in their household experienced food insecurity, but the overall number would be lower than 3.0 percent because less-disadvantaged groups have far lower incidence of food insecurity than more-disadvantaged groups. The December survey and the 2020 data also differ in how the interviews were conducted. (See endnote 11.)
[16] See Lauren Bauer, “The COVID-19 Crisis Has Already Left Too Many Children Hungry in America,” The Hamilton Project, May 6, 2020, https://www.brookings.edu/blog/up-front/2020/05/06/the-covid-19-crisis-has-already-left-too-many-children-hungry-in-america; Lauren Bauer, “About 14 Million Children in the US Are Not Getting Enough to Eat,” Brookings Institution, July 9, 2020, https://www.brookings.edu/blog/up-front/2020/07/09/about-14-million-children-in-the-us-are-not-getting-enough-to-eat.
[17] Diane Schanzenbach and Abigail Pitts, “How Much Has Food Insecurity Risen? Evidence from the Census Household Pulse Survey,” Northwestern University Institute for Policy Research, June 10, 2020, https://www.ipr.northwestern.edu/documents/reports/ipr-rapid-research-reports-pulse-hh-data-10-june-2020.pdf; Diane Schanzenbach and Abigail Pitts, “Food Insecurity Triples for Families With Children During COVID-19 Pandemic,” Northwestern University Institute for Policy Research, May 13, 2020, https://www.ipr.northwestern.edu/news/2020/food-insecurity-triples-for-families-during-covid.html.
[18] See “Consumer Price Index: June 2020,” Bureau of Labor Statistics, July 14, 2020, https://www.bls.gov/news.release/pdf/cpi.pdf; Llobrera op. cit.
[19] The 42 states with data available for May 2020 include 97 percent of the SNAP caseload. “SNAP Online: A Review of State Government SNAP Websites,” CBPP, April 23, 2020, https://www.cbpp.org/research/food-assistance/snap-online-a-review-of-state-government-snap-websites, includes links to the data on each state’s website for the states that post it. We also have obtained data from a handful of states that do not post their monthly data. USDA posted preliminary April 2020 SNAP participation figures on July 17 that appear to have data reporting issues for about one-fifth of the states and are likely to be revised.
[20] Dorothy Rosenbaum, “Boost SNAP to Capitalize on Program’s Effectiveness and Ability to Respond to Need,” CBPP, July 18, 2020, https://www.cbpp.org/research/food-assistance/boost-snap-to-capitalize-on-programs-effectiveness-and-ability-to-respond.
[21] “Most States Are Using New Flexibility in SNAP to Respond to COVID-19 Challenges,” CBPP, updated July 17, 2020, https://www.cbpp.org/research/food-assistance/most-states-are-using-new-flexibility-in-snap-to-respond-to-covid-19.
[22] Census Bureau Household Pulse Survey data, Housing Table 1b. Last Month's Payment Status for Renter-Occupied Housing Units, by Select Characteristics: United States, for data collected July 2-7, 2020, https://www.census.gov/data/tables/2020/demo/hhp/hhp10.html.
[23] Ibid.
[24] For more on how government policies helped created and reinforce racial and ethnic residential segregation, see Richard Rothstein, The Color of Law: A Forgotten History of How Our Government Segregated America, Liveright 2017.
[25] Census Bureau Household Pulse Survey data, Housing Table 1b. Last Month's Payment Status for Renter-Occupied Housing Units, by Select Characteristics: United States, for data collected July 2-7, 2020, https://www.census.gov/data/tables/2020/demo/hhp/hhp10.html.
[26] Ibid.
[27] CBPP analysis of Census Bureau Household Pulse Survey public use file for data collected June 25-30, 2020, https://www.census.gov/programs-surveys/household-pulse-survey/datasets.html. Data needed to make this calculation run a week behind the most recently published Pulse survey tables.
[28] Census Bureau Household Pulse Survey data, Housing Table 1b. Last Month's Payment Status for Renter-Occupied Housing Units, by Select Characteristics: United States, for data collected April 23-May 5 and July 2-7, 2020, https://www.census.gov/data/tables/2020/demo/hhp/hhp1.html and https://www.census.gov/data/tables/2020/demo/hhp/hhp10.html.
[29] Alicia Mazzara, “Census: Income-Rent Gap Grew in 2018,” CBPP, September 27, 2019, https://www.cbpp.org/blog/census-income-rent-gap-grew-in-2018.
[30] CBPP, “Federal Rental Assistance Fact Sheets,” updated December 10, 2019, https://www.cbpp.org/research/housing/federal-rental-assistance-fact-sheets#US.
[31] “Homelessness & Health: What’s the Connection?” National Health Care for the Homeless Council, February 2019, https://nhchc.org/wp-content/uploads/2019/08/homelessness-and-health.pdf.
[32] Department of Housing and Urban Development, “The 2019 Annual Homeless Assessment Report (AHAR) to Congress,” January 2020, https://files.hudexchange.info/resources/documents/2019-AHAR-Part-1.pdf.
[33] Joy Moses, “Demographic Data Project: Race, Ethnicity, and Homelessness,” Homeless Research Institute, National Alliance to End Homelessness, https://endhomelessness.org/wp-content/uploads/2019/07/3rd-Demo-Brief-Race.pdf.
[34] “Assessment of SARS-CoV-2 Infection Prevalence in Homeless Shelters — Four U.S. Cities, March 27-April 15, 2020,” Morbidity and Mortality Weekly Report, Centers for Disease Control and Prevention, May 1, 2020, https://www.cdc.gov/mmwr/volumes/69/wr/mm6917e1.htm?s_cid=mm6917e1_w.
[35] “Chart Book: Tracking the Post-Great Recession Economy,” CBPP, updated July 7, 2020, https://www.cbpp.org/research/economy/chart-book-tracking-the-post-great-recession-economy.
[36] Data on unemployment rates for foreign-born and native-born workers are not available with seasonal adjustment. Bureau of Labor Statistics, Current Population Survey data access, Table A-7, Employment status of the civilian population by nativity and sex, not seasonally adjusted, https://www.bls.gov/webapps/legacy/cpsatab7.htm.
[37] Randall Akee, “How COVID-19 is impacting indigenous peoples in the U.S.”, May 13, 2020, https://www.pbs.org/newshour/nation/how-covid-19-is-impacting-indigenous-peoples-in-the-u-s. See also, “For Native Americans, COVID-19 is ‘the worst of both worlds at the same time,” Harvard Gazette, May 2020, https://news.harvard.edu/gazette/story/2020/05/the-impact-of-covid-19-on-native-american-communities/; and “‘Huge disparity’ in COVID-19 death rates for Native Americans in NM,” Albuquerque Journal, May 31, 2020, https://www.abqjournal.com/1461218/huge-disparity-in-covid19-death-rates-for-native-americans-in-nm.html.
[38] Desi Rodriguez-Lonebear et al., “American Indian Reservations and COVID-19: Correlates of Early Infection Rates in the Pandemic,” Journal of Public Health Management and Practice, Vol. 26, Issue 4, July/August 2020, pp. 371-377, https://journals.lww.com/jphmp/Fulltext/2020/07000/American_Indian_Reservations_and_COVID_19_.14.aspx.
[39] John Cook and Karen Jeng, “Child Food Insecurity: The Economic Impact On Our Nation,” Feeding America, July 1, 2009, https://www.nokidhungry.org/sites/default/files/child-economy-study.pdf.
[40] Iron deficiency anemia occurs when the body does not have sufficient iron to produce hemoglobin, which blood cells need to carry oxygen through the body. See Heather Eicher-Miller et al., “Food insecurity is associated with iron deficiency anemia in U.S. adolescents,” American Journal of Clinical Nutrition, 2009, Vol. 90, pp. 1358–1371; and Anne Skalicky et al., “Child food insecurity and iron-deficiency anemia in low-income infants and toddlers in the United States,” Maternal Child Health Journal, 2006, Vol. 10, No. 2, pp. 177–185.
[41] Sarah Jane Schwanzenberg, Michael Georgieff, and Committee on Nutrition, “Advocacy for Improving Nutrition in the First 1000 Days to Support Childhood Development and Adult Health,” Pediatrics, February 2018, https://doi.org/10.1542/peds.2017-3716.
[42] See, for example, Priya Shankar, Rainjade Chung, and Deborah Frank, “Association of Food Insecurity with Children’s Behavioral, Emotional, and Academic Outcomes: A Systematic Review,” Journal of Developmental and Behavioral Pediatrics, February/March 2017, https://doi.org/10.1097/DBP.0000000000000383; Larry Howard, “Does Food Insecurity at Home Affect Non-Cognitive Performance at School? A Longitudinal Analysis of Elementary Student Classroom Behavior,” Economics of Education Review, February 2011, https://doi.org/10.1016/j.econedurev.2010.08.003; Meredith Hickson et al., “Feeding Our Human Capital: Food Insecurity and Tomorrow’s Workforce,” Children’s Healthwatch, September 3, 2013, https://www.childrenshealthwatch.org/wp-content/uploads/FeedingHumanCapital_report.pdf.
[43] Ross A. Thompson and Ron Haskins, “Early Stress Gets under the Skin: Promising Initiatives to Help Children Facing Chronic Adversity,” The Future of Children, Princeton-Brookings Policy Brief Spring 2014, https://futureofchildren.princeton.edu/sites/futureofchildren/files/media/helping_parents_helping_children_24_01_policy_brief.pdf; Anna Aizer, Laura Stroud, and Stephen Buka, “Maternal Stress and Child Outcomes: Evidence from Siblings,” National Bureau of Economic Research Working Paper 18422, 2012, www.nber.org/papers/w18422.pdf; and National Scientific Council on the Developing Child, “Excessive Stress Disrupts the Architecture of the Developing Brain: Working Paper 3,” 2005/2014, updated edition, http://developingchild.harvard.edu/resources/wp3/.
[44] Hilary Hoynes, Diane Whitmore Schanzenbach, and Douglas Almond, “Long-Run Impacts of Childhood Access to the Safety Net,” American Economic Review, Vol. 106, No. 4 (April 2016), pp. 903–934. An earlier version of the paper is at http://www.nber.org/papers/w18535. See also Chloe N. East, “The Effect of Food Stamps on Children’s Health: Evidence from Immigrants’ Changing Eligibility,” Journal of Human Resources, September 2018, http://jhr.uwpress.org/content/early/2018/09/04/jhr.55.3.0916-8197R2.abstract; Martha Bailey et al., “Is the Social Safety Net a Long-Term Investment? Large-Scale Evidence from the Food Stamps Program,” Goldman School of Public Policy Working Paper, April 2020, https://gspp.berkeley.edu/assets/uploads/research/pdf/w26942.pdf; and Steven Carlson and Brynne Keith-Jennings, “SNAP Is Linked with Improved Nutritional Outcomes and Lower Health Care Costs,” CBPP, January 17, 2018, https://www.cbpp.org/research/food-assistance/snap-is-linked-with-improved-nutritional-outcomes-and-lower-health-care.
[45] Marybeth Shinn et al., “Long-Term Associations of Homelessness with Children’s Well-Being,” American Behavioral Scientist, Vol. 51, No. 6, February 2008; Linda C. Berti et al., “Comparison of Health Status of Children Using a School-Based Health Center for Comprehensive Care,” Journal of Pediatric Health Care, Vol. 15, September/October 2001.
[46] Berti et al., op. cit.
[47] Stanley K. Frencher et al., “A Comparative Analysis of Serious Injury and Illness among Homeless and Housed Low Income Residents of New York City,” Trauma, Vol. 69, No. 4, October 2010.
[48] Ibid.
[49] Jelena Obradovic et al., “Academic Achievement of Homeless and Highly Mobile Children in an Urban School District,” Development and Psychopathology, 2009.
[50] Lorraine E. Maxwell, “Home and School Density Effects on Elementary School Children: The Role of Spatial Density,” Environment and Behavior, Vol. 35, No. 4, 2003.
[51] Frank Braconi, “Housing and Schooling,” The Urban Prospect, Citizens Housing and Planning Council, 2001; Dalton Conley, “A Room with a View or a Room of One’s Own? Housing and Social Stratification,” Sociological Forum, Vol. 16, No. 2, 2001; Maxwell, op. cit.
[52] Maxwell, op. cit.
[53] Kathleen M. Ziol-Guest and Claire C. McKenna, “Early Childhood Housing Instability and School Readiness,” Child Development, 2013.
[54] American Public Health Association, “Housing and Homelessness as a Public Health Issue,” November 2017, https://apha.org/policies-and-advocacy/public-health-policy-statements/policy-database/2018/01/18/housing-and-homelessness-as-a-public-health-issue.
[55] See Mark Nord and Mark Prell, “Food Security of SNAP Recipients Improved Following the 2009 Stimulus Package,” USDA, Economic Research Service, June 2011, https://www.ers.usda.gov/amber-waves/2011/june/food-security-of-snap/; Arloc Sherman, “Poverty and Financial Distress Would Have Been Substantially Worse in 2010 Without Government Action, New Census Data Show,” CBPP, November 7, 2011, https://www.cbpp.org/cms/index.cfm?fa=view&id=3610. This analysis uses a definition of poverty that counts SNAP and similar non-cash benefits as income.
[56] Will Fischer, Douglas Rice, and Alicia Mazzara, “Research Shows Rental Assistance Reduces Hardship and Provides Platform to Expand Opportunity for Low-Income Families,” CBPP, December 5, 2019, https://www.cbpp.org/research/housing/research-shows-rental-assistance-reduces-hardship-and-provides-platform-to-expand.
[57] Opportunity Insights Economic Tracker, data retrieved July 14, 2020, https://tracktherecovery.org/.
[58]Natalie Cox et al., “Initial Impacts of the Pandemic on Consumer Behavior: Evidence from Linked Income, Spending, and Savings Data,” Working Paper, June 2020, University of Chicago, https://bfi.uchicago.edu/wp-content/uploads/BFI_WP_202082.pdf.
[59] Michael Karpman and Gregory Acs, “Unemployment Insurance and Economic Impact Payments Associated with Reduced Hardship Following CARES Act,” Urban Institute, June 30, 2020, https://www.urban.org/research/publication/unemployment-insurance-and-economic-impact-payments-associated-reduced-hardship-following-cares-act.
[60] CBPP, “Policy Basics: Fiscal Stimulus,” May 21, 2020, https://www.cbpp.org/research/economy/policy-basics-fiscal-stimulus.
[61] Mark Zandi, “HEROES Act to the Rescue,” Moody’s Analytics, June 17, 2020, https://www.economy.com/getfile?q=0A18590F-F506-47BA-9D9C-5550ACE09CC1&app=download.
[62] Congressional Budget Office, “Estimated Impact of the American Recovery and Reinvestment Act on Employment and Economic Output in 2014,” February 20, 2015, https://www.cbo.gov/publication/49958.
[63] Hamutal Bernstein et al., “Amid Confusion over the Public Charge Rule, Immigrant Families Continued Avoiding Public Benefits in 2019,” Urban Institute, May 18, 2020, https://www.urban.org/research/publication/amid-confusion-over-public-charge-rule-immigrant-families-continued-avoiding-public-benefits-2019.
[64] These figures are based on the number of SNAP participants prior to the pandemic. The number now is likely higher because of increases in SNAP participation.
[65] Dennis Culhane et al., “Estimated Emergency and Observation/Quarantine Capacity Need for the US Homeless Population Related to COVID-19 Exposure by County; Projected Hospitalizations, Intensive Care Units and Mortality,” National Alliance to End Homelessness, March 2020, https://endhomelessness.org/resource/estimated-emergency-and-observational-quarantine-bed-need-for-the-us-homeless-population-related-to-covid-19-exposure-by-county-projected-hospitalizations-intensive-care-units-and-mortality/.
[66] Johnson, op. cit.
[67] Michael Mitchell, Michael Leachman, and Matt Saenz, “State Higher Education Funding Cuts Have Pushed Costs to Students, Worsened Inequality,” CBPP, October 24, 2019, https://www.cbpp.org/research/state-budget-and-tax/state-higher-education-funding-cuts-have-pushed-costs-to-students.
[68] Matthew Menendez and Lauren-Brooke Eisen, “The Steep Costs of Criminal Justice Fees and Fines,” Brennan Center for Justice, November 21, 2019, https://www.brennancenter.org/our-work/research-reports/steep-costs-criminal-justice-fees-and-fines.
[69] Elizabeth McNichol and Michael Leachman, “States Continue to Face Large Shortfalls Due to COVID-19 Effects,” CBPP, updated July 7, 2020, https://www.cbpp.org/research/state-budget-and-tax/states-continue-to-face-large-shortfalls-due-to-covid-19-effects.
[70] Timothy J. Bartik, “An updated proposal for timely, responsive federal aid to state and local governments during the pandemic recession,” Upjohn Institute, May 22, 2020, https://www.upjohn.org/research-highlights/updated-proposal-timely-responsive-federal-aid-state-and-local-governments-during-pandemic-recession.
[71] Marshall, op. cit.
[72] Javier Balmaceda, “Long in Recession, Puerto Rico Needs More Than Just COVID-19 Relief to Overcome Its Crisis,” CBPP, May 7, 2020, https://www.cbpp.org/research/economy/long-in-recession-puerto-rico-needs-more-than-just-covid-19-relief-to-overcome-its.
[73] Chetty et al., op. cit.
[74] This 15 percent bump would apply to the Nutrition Assistance Program in Puerto Rico and American Samoa.
[75] Dorothy Rosenbaum, Stacy Dean, and Zoë Neuberger, “The Case for Boosting SNAP Benefits in Next Major Economic Response Package,” CBPP, updated May 22, 2020, https://www.cbpp.org/research/food-assistance/the-case-for-boosting-snap-benefits-in-next-major-economic-response-package.
[76] Immigrants face more restrictive SNAP eligibility rules than their citizen counterparts and some immigrants who are eligible for benefits choose not to participate out of fear or concern for whether their participation will impact their immigration status. As a result, SNAP is limited in its ability to counteract food insecurity among immigrant households.
[77] Among households with a voucher, 48 percent are headed by a person identifying as Black, non-Hispanic, 18 percent by a Hispanic person of any race, 3 percent by someone non-Hispanic Asian or Pacific Islander, and 1 percent by someone Native American, non-Hispanic. See Department of Housing and Urban Development, “Picture of Subsidized Households,” 2019, https://www.huduser.gov/portal/datasets/assthsg.html.
[78] Roughly 38 percent of Black, non-Hispanic low-income renter households in need of federal rental assistance receive it, compared to 25 percent of all low-income renter households in need. Regardless of race, funding limitations prevent most renters in need of assistance from getting help. CBPP analysis of HUD custom tabulations of the 2017 American Housing Survey; 2017 HUD administrative data; FY2018 McKinney-Vento Permanent Supportive Housing bed counts; 2017-2018 Housing Opportunities for Persons with AIDS grantee performance profiles; and the USDA FY2018 Multi-Family Fair Housing Occupancy Report.
[79] Will Fischer, “Research Shows Housing Vouchers Reduce Hardship and Provide Platform for Long-Term Gains Among Children,” CBPP, updated October 7, 2015, https://www.cbpp.org/research/housing/research-shows-housing-vouchers-reduce-hardship-and-provide-platform-for-long-term.
[80] LaDonna Pavetti, “Pandemic TANF Assistance Act Will Provide Much-Needed Aid, Protections to Families with the Least,” CBPP, May 11, 2020, https://www.cbpp.org/blog/pandemic-tanf-assistance-act-will-provide-much-needed-aid-protections-to-families-with-the. See also Liz Schott, “Using TANF Emergency Funds to Provide Food Assistance to Struggling Families,” June 18, 2010, CBPP, https://www.cbpp.org/research/using-tanf-emergency-funds-to-provide-food-assistance-to-struggling-families.
[81] These figures refer to the population of workers aged 19-65 (excluding full-time students 19-24) who are not raising children in the home.
[82] Chuck Marr et al., “Temporarily Expanding Child Tax Credit and Earned Income Tax Credit Would Deliver Effective Stimulus, Help Avert Poverty Spike,” CBPP, May 13, 2020, https://www.cbpp.org/research/federal-tax/temporarily-expanding-child-tax-credit-and-earned-income-tax-credit-would.
[83] Shelby Gonzales, “Administration Should Reverse Anti-Immigrant Policies That Will Worsen Impacts of Health and Economic Crisis,” CBPP, May 6, 2020, https://www.cbpp.org/research/immigration/administration-should-reverse-anti-immigrant-policies-that-will-worsen-impacts.
[84] See “Five Reasons Stabilizing Child Care During the Coronavirus Pandemic is Critically Important for Families and the Economy,” the Center for Law and Social Policy and the National Women’s Law Center, April 2020, https://www.clasp.org/publications/fact-sheet/five-reasons-stabilizing-child-care-during-coronavirus-pandemic-critically.
[85] CBPP calculation based on 2018 American Community Survey.
More from the Authors

Areas of Expertise

Areas of Expertise

Areas of Expertise

Areas of Expertise