Gaps in Economic Support for Non-Elderly Adults Without Children Continue to Leave Millions in Poverty, Data Show
Non-elderly adults without children, one of the largest demographic groups in the United States, are left out of many economic and health security programs that are effective at reducing poverty and expanding access to health coverage for other groups. Partly as a result, their poverty rate has not fallen in recent decades as it has for children, seniors, and non-elderly adults with children, a comprehensive assessment of poverty trends before the pandemic shows.
"Their poverty rate has not fallen in recent decades as it has for children, seniors, and non-elderly adults with children."More than 1 in 3 people in the United States — 117 million individuals — is 18 to 64 years old and does not have a child under 18 in their family (referred to in this report as “non-elderly adults without children”). This group is demographically diverse, covering those just past high school age to nearing retirement, reflecting all races and ethnicities and levels of education, and representing every region of the country.
Membership in this group is not static, and most adults experience some period of time between ages 18 and 64 when they are not caring for children under 18. Some non-elderly adults without children may provide support for children from a previous relationship outside the home. Others help support grown children ages 18 and older, either in the same home or another home. Still others have chosen not to have children or are unable to have children.[1]
Despite the large number of these individuals and their widely ranging circumstances, unless they can document a severe disability, economic security program rules tend to expect them to work in order to receive benefits; even then, help available to people in this group is generally very modest. These programs offer little assistance when these adults encounter job loss, their work hours are cut short, their wages are too low to pay the bills, they face illness or job discrimination, an older relative requires full-time care, their car breaks down, or other needs arise.
For example:
- Non-elderly adults without children have little access to cash assistance. The Temporary Assistance for Needy Families (TANF) program serves families with children, and general assistance programs, which operate in just 25 states, served less than half a million individuals nationally in December 2019, with most programs limited to people with a disability or other health condition.
- The federal Earned Income Tax Credit (EITC) is far less generous for non-elderly adults without children than for families with children, and as a result, the federal tax system taxes some 5 million of these adults into — or deeper into — poverty.
- In many cases, non-elderly adults without children who are out of work can only receive food assistance through the Supplemental Nutrition Assistance Program (SNAP, formerly known as food stamps) for three months while unemployed in any three-year period, a restriction not imposed on families with children or seniors.
- Rental assistance programs, which have extremely limited funding, serve fewer than 1 in 5 eligible non-elderly adults without children, tending to prioritize serving people with disabilities and seniors.
- Because 14 states have not implemented the Affordable Care Act’s Medicaid expansion, this group often lacks health insurance.[2]
- And, while unemployment insurance programs are open to workers regardless of whether they have children, outside of the current period when large-scale expansions are in place, most low-paid workers do not qualify for unemployment benefits when they lose their jobs because of a host of restrictive eligibility criteria.
Economic security programs play an increasingly important role in bolstering income for many people — not only tiding them over in times of crisis but also helping to soften the impact of weak wage growth, rising income inequality, ongoing racial and gender discrimination, and other forces that have led the fruits of a growing pre-pandemic economy to be unevenly shared across households. These programs’ income-boosting role has remained notably weaker, however, for non-elderly adults without children compared to other groups.
From 1993 to 2017, improvements in economic security programs led to falling poverty rates overall and for families with children — but not for those without children. For example, the EITC for non-elderly adults without children has remained essentially unchanged since it was added to the EITC in 1993; meanwhile, the EITC for families with children has been expanded several times since its inception, resulting in an average credit amount that was more than ten times greater for those with children in tax year 2017 ($3,191 for a family with children compared with $298 for a family without children).[3]
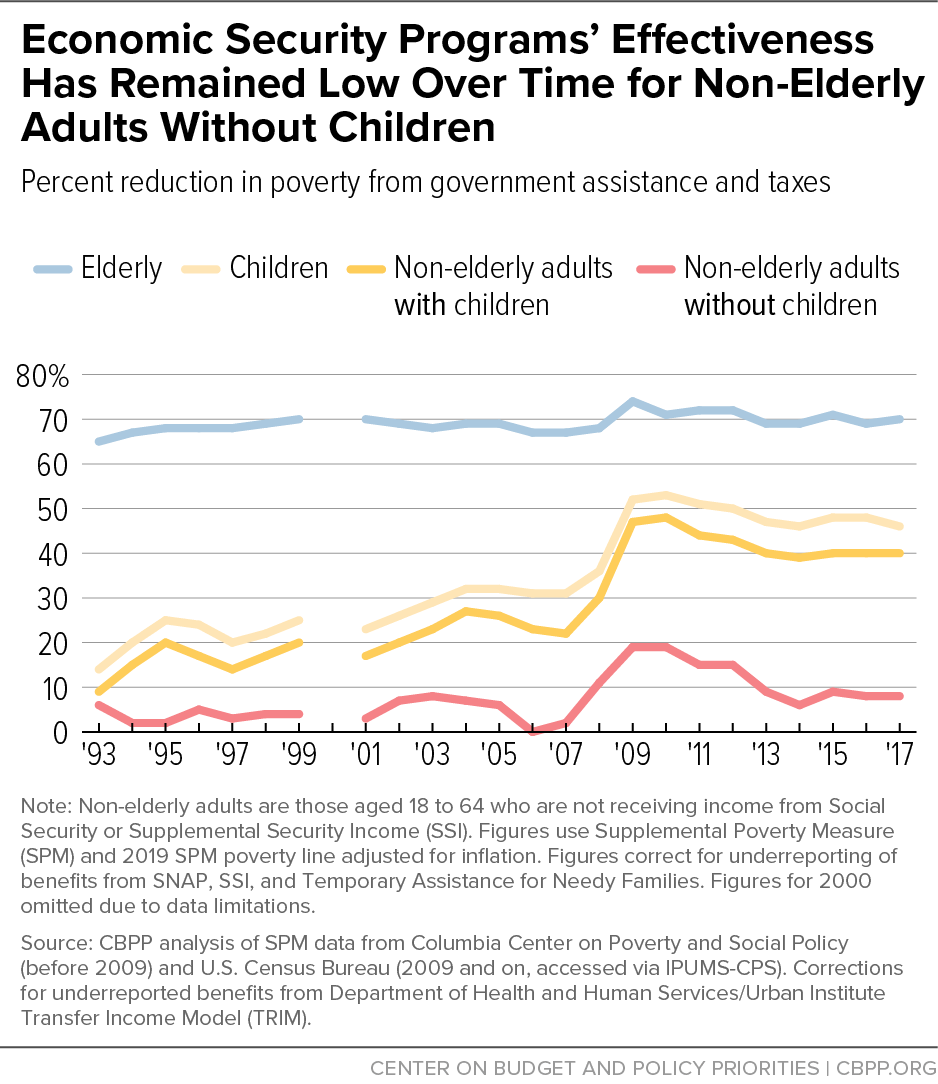
Largely as a result, non-elderly adults without children are the only major group whose poverty rate, measured comprehensively with the Supplemental Poverty Measure (SPM) after correcting for underreporting of key government benefits, has not declined since 1993. (See Figure 1.)

Because many economic security programs offer greater support to non-elderly adults without children if they receive major disability benefits, we are especially interested in those who do not receive these benefits. Specifically, this report focuses on those who do not receive Social Security or Supplemental Security Income (SSI) benefits (an estimated 106 million out of 117 million total non-elderly adults without children in 2017).[4]
The COVID-19 recession, while harshest in many ways for households with children, has also hurt non-elderly adults without children. About 1 in 8 non-elderly adults not living with children who were surveyed in late 2020 reported that their household didn’t get enough to eat sometimes or often during the last seven days, three times the share who ever lacked enough to eat in all of 2019.
Policymakers have adopted various temporary relief measures to mitigate the health and economic harm caused by COVID-19. This analysis examines economic security programs prior to the current crisis to encourage policymakers to enact longer-term changes to these programs that will help ensure a more equitable recovery.
Non-Elderly Adults Without Children Are a Varied Group
The 106 million non-elderly adults without children in the family and without income from Social Security or SSI are a diverse group with widely varying needs (see Figure 2):[5]
- 17 percent are aged 18 to 24 and 27 percent are age 55 and older.
- 48 percent are female.
- 36 percent identify as people of color, with 12 percent identifying as Black, 15 percent Latino, 6 percent Asian, and 2 percent as another race or multiple races; 64 percent are white.[6]
- Among those aged 25 and older, 39 percent have at least a four-year college degree, while 34 percent have a high school diploma or less.
- 10 percent are full-time students.
- Nearly 5 percent are veterans.
- 88 percent live in metropolitan areas.
- 83 percent share a household with others.
- More than one-third (37 percent) live in the South, 24 percent in the West, 21 percent in the Midwest, and 18 percent in the Northeast.
About 83 percent worked at least one week in the previous year. (When excluding full-time students, 85 percent worked at least one week in the previous year.) They are most likely to work in office and administrative support occupations; management positions; sales and sales-related jobs; transportation and material moving occupations; and education, training, and library jobs.
Despite not receiving income from Social Security or SSI, 6 percent report having a health problem or disability that prevents or limits their ability to work. Many may have physical or mental health conditions that hinder their ability to work but that do not meet the strict eligibility criteria for those programs, which require that applicants demonstrate that their disability will last at least 12 months or result in death and that it precludes them from engaging in substantial work.[7] Others may be partway through the months- or years-long application process, or may fail to receive benefits for other reasons.

Non-elderly adults without children are not a static population; as with many individuals, their employment status, economic status, and health or disability status may change over time. Additionally, whether they are deemed to be with or without children may vary as their family composition changes, due to life changes such as divorce, a new marriage or partnership, shifting child custody arrangements, or the birth of a child.
1 in 5 Non-Elderly Adults Without Children Has Low Income
In 2017, 9.4 percent of non-elderly adults without children lived below the official poverty line ($12,752 for a single person and $16,414 for a couple without children), while 20.2 percent — 1 in 5 — lived below 200 percent of the poverty line ($25,504 for a single person and $32,828 for a couple without children). Many policies designed to support low-income individuals focus on serving the population under 200 percent of the official poverty line.
This low-income group of non-elderly adults without children tends to be younger than non-elderly adults without children as a whole — 27 percent are aged 18 to 24 — and slightly more likely to be female (50 percent versus 48 percent). These low-income individuals are also disproportionately Black or Latino — 18 percent and 21 percent, respectively — due to historical and ongoing discrimination in education, housing, employment, and criminal justice that has systematically limited opportunity and resulted in higher levels of economic insecurity.[8]
Compared to all non-elderly adults without children, this low-income group has much lower educational attainment; 53 percent have at most a high school diploma, while only 21 percent — nearly half the rate for the group as a whole — have a four-year college degree or higher.[9] They are slightly more likely to live in rural (non-metropolitan) areas (13 percent versus 11 percent), to live alone (23 percent versus 17 percent), and to live in the South (42 percent live in the South, a quarter in the West, and 19 percent and 15 percent in the Midwest and Northeast, respectively).
We find considerable differences in work status between the low-income group and the group of all non-elderly adults without children. While 83 percent of the overall group worked at least one week in the previous year, only 58 percent of the low-income group did. (When excluding full-time students, 85 percent of the overall group worked at least one week in the previous year, compared with 61 percent of the low-income group.) The share of low-income individuals reporting a health problem or disability that prevents or limits their working (among those not receiving income from Social Security or SSI) is more than double that of the group as a whole.
The low-income group is more likely than the full group of all non-elderly adults without children to work in food preparation and serving roles and cleaning and maintenance jobs. These and other low-paying jobs often come with irregular schedules and only part-time hours when workers would prefer to work full time, which can make it more difficult for these workers to retain employment and advance in their careers.[10] Low-wage jobs also are more likely to lack benefits such as health insurance and paid sick leave or other paid leave, which might result in their leaving a job earlier than they otherwise might in order to manage their health or the health of a loved one. For example, only 52 percent of workers in jobs with average hourly wages in the bottom 25 percent of the wage distribution had paid sick leave in March 2020, compared with 78 percent of all workers.[11]
See Appendix for more demographic detail.
Most With Low Income Work
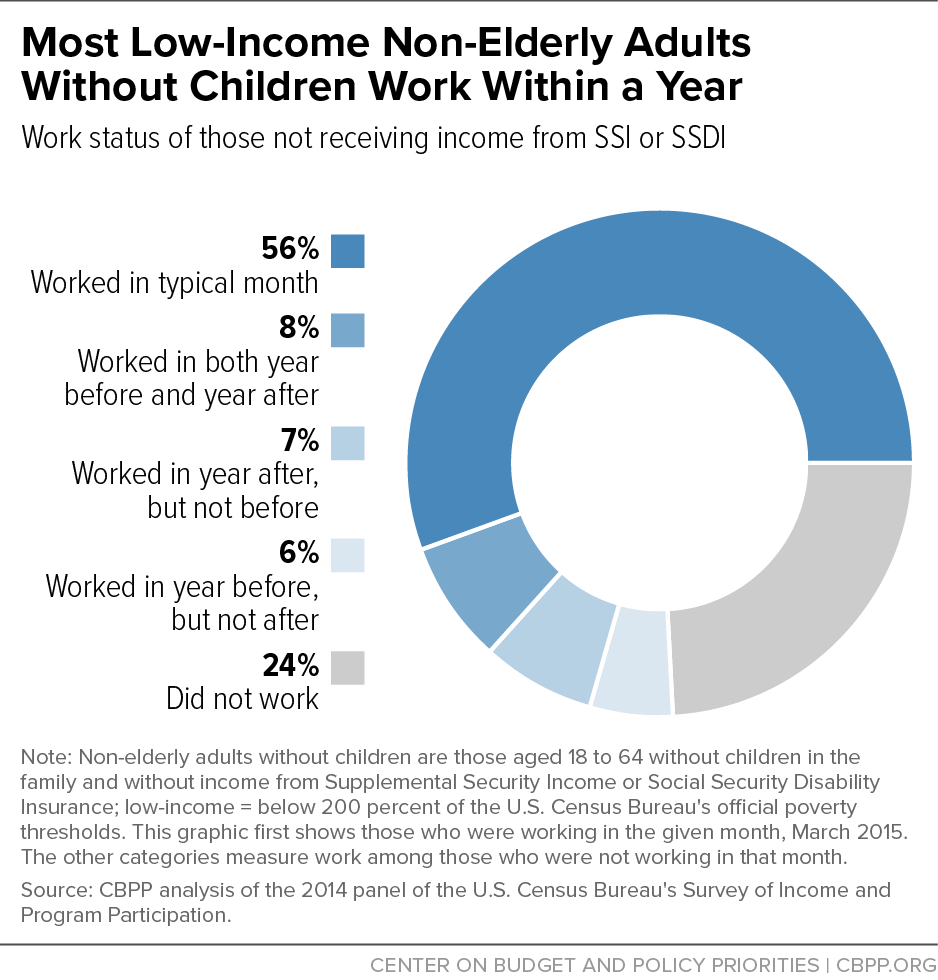
As noted above, most low-income non-elderly adults in the United States work, and economic security programs often expect them to work (or to have documented a severe disability) in order to qualify for benefits. However, maintaining uninterrupted work can be difficult because of the unstable nature of many low-paying jobs and a variety of other employment barriers. Consequently, examining this group’s work status over a period of months reveals considerably more employment than a point-in-time estimate of unemployment in a single month shows.
An analysis of work status among low-income, non-elderly adults without children over a period of 25 months using the Survey of Income and Program Participation (SIPP)[12] finds that they have considerable work experience over time, even if many are experiencing joblessness at any given point in time. Among those with incomes below 200 percent of the official poverty line (and receiving no income from SSI or SSDI) in March 2015, 56 percent of these adults worked in that one month, but more than three-quarters (76 percent) worked within the 12 months before or after that month. (See Figure 3.)
Among individuals who were not working during that month, nearly half (46 percent) worked within a year before or after. Those who were not working in that month reported various reasons for their joblessness; more than a quarter (27 percent) noted health reasons as a cause, while 23 percent mentioned school attendance, 22 percent could not find work or were on layoff, and 8 percent reported that they were caring for children or other persons.[13]
Joblessness often reflects challenges such as limited education or disability. Low-income, non-elderly adults without children who had at most a high school diploma or equivalent were less likely than those with a bachelor’s degree or higher to work within a year. And among those not receiving income from SSI or SSDI, individuals who were not working within a year were far more likely to identify as having a core disability and/or a work-related disability[14] than people who did work within that period (54 percent versus 19 percent), illustrating those programs’ strict eligibility criteria and lengthy disability determination processes.
Reflecting the longstanding barriers to employment that people of color face due to racism and discrimination, low-income people of color were somewhat less likely than those identifying as white to work within a year. Despite this difference, at least 67 percent of people in each racial or ethnic group (Black, Latino, Asian, white, or another or multiple races) worked within a year.[15]
Poverty Rate Among Non-Elderly Adults Without Children Hasn’t Fallen, Due in Part to Weak Government Support
Low-income, non-elderly adults without children largely have been left out of the improvements to economic security programs over the last several decades that have been the main sources of progress against poverty for other groups, including non-elderly adults with children, seniors, and those with disabilities, during an era of little wage growth.[16]
Stubborn poverty rates among non-elderly adults without children — their poverty rate was statistically unchanged between 1993 and 2017 — reflect these limited supports. For example:
- Many non-elderly adults without children who are out of work can receive SNAP for only three months while unemployed in any three-year period, a restriction unique to this group.
- They are often uninsured, particularly in the 14 states that have not implemented the Affordable Care Act’s Medicaid expansion.[17]
- While TANF is limited for families with children, serving only a small share of poor children, cash assistance for those without children remains even more severely limited — and entirely unavailable in half the states.
- The federal tax code, through both the EITC and the Child Tax Credit, provides considerable support to families with children but offers a meager benefit to those without children and, as a result, some 5 million low-income childless adults are taxed into — or deeper into — poverty.[18]
- And due to limited funding, fewer than 1 in 5 eligible non-elderly adults without children receive any rental assistance, which goes primarily to people with disabilities and seniors.[19]
To provide a full picture of the economic supports available to non-elderly adults without children and comparison groups, this analysis blends the SPM — which counts more forms of income than the “official” poverty measure (among other differences) and therefore more accurately reflects the resources available to low-income families — with corrections for underreporting of key government benefits in survey data.[20]
Our SPM data allow us to see economic security programs’ impact on poverty by calculating the percent of people in poverty two ways: before and after counting government assistance and taxes.[21] The change in poverty between the two calculations shows how effective economic security programs are at reducing the share of people in poverty.
In 1993, before counting government assistance and taxes, 13.5 percent of non-elderly adults without children (and with no income from Social Security or SSI) had income below the SPM poverty line. After counting government assistance and taxes, 12.7 percent of non-elderly adults without children had income below the SPM poverty line — a reduction in poverty of about 6 percent. (See Table 1.)
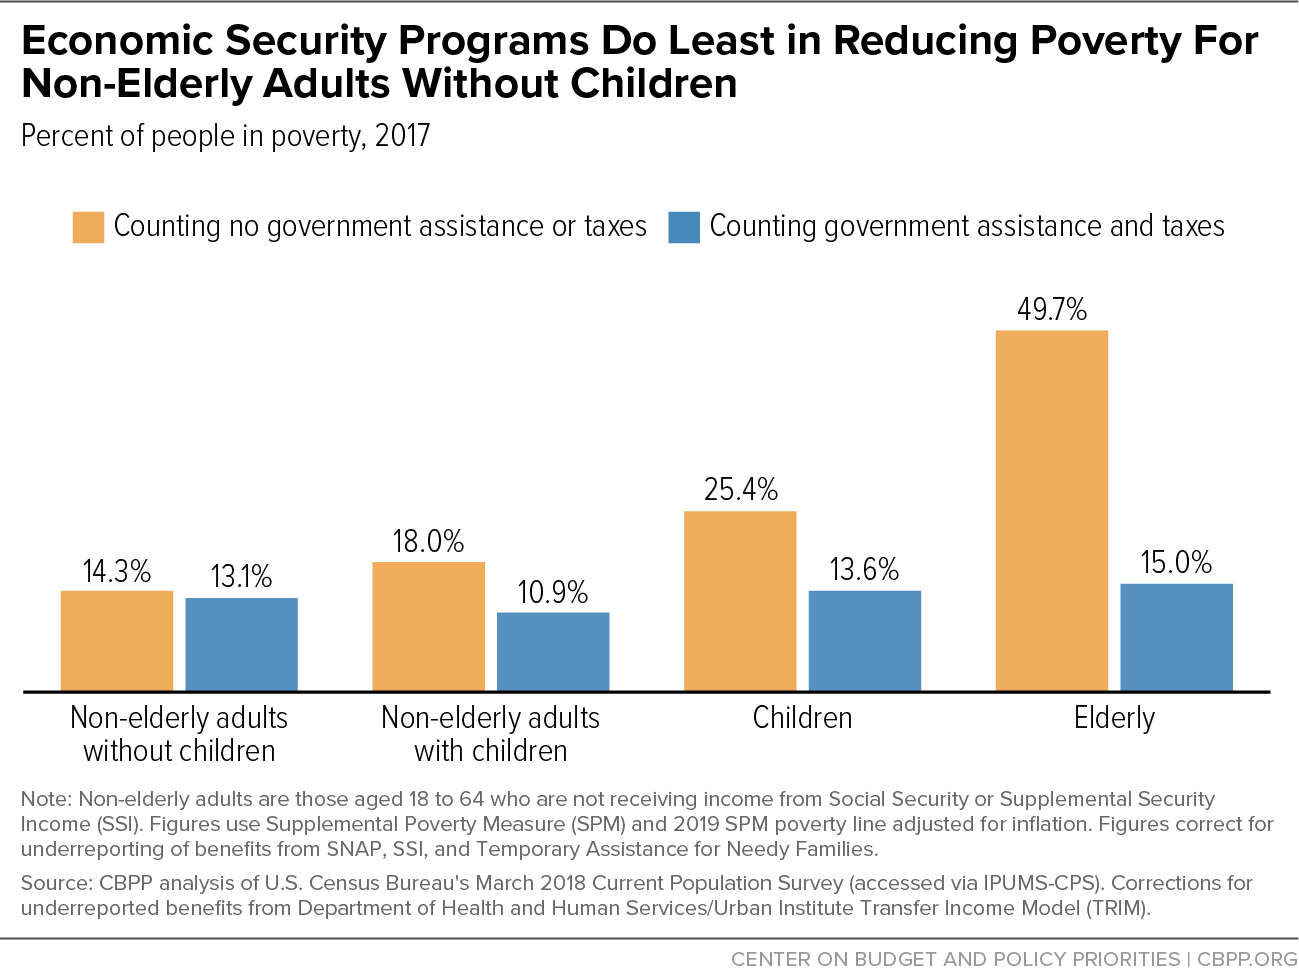
By 2017, the “pre-government” poverty rate for non-elderly adults without children was 14.3 percent while their “post-government” rate was 13.1 percent — a reduction in poverty of about 8 percent, showing that the effectiveness of economic security programs improved only modestly since 1993.[22] (The apparent increase in the poverty rate of non-elderly adults without children from 1993 to 2017 is not statistically significant.)
At the same time, economic security programs became much more effective at reducing the poverty rate for non-elderly adults with children. For these families, government assistance and taxes reduced poverty by 9 percent in 1993, but by 40 percent in 2017. Their poverty rate after counting government assistance and taxes fell by nearly half from 1993 to 2017, from 19.8 percent to 10.9 percent.[23] (See Figure 4.)
One force behind the sharp drop in poverty rates for those with children — but not for those without children — was a major shift in government poverty-reduction efforts that particularly affected families with children, such as improvements in the EITC and the Child Tax Credit.
We see similar results when looking at deep poverty (living with income below half of the SPM poverty line). The deep poverty rate among non-elderly adults without children rose slightly from 1993 to 2017, from 5.0 percent to 5.8 percent, and the effectiveness of economic security programs for this group improved only slightly, with government supports resulting in a 30 percent reduction in deep poverty in 1993 and a 32 percent reduction in deep poverty in 2017. Meanwhile, the deep poverty rate for non-elderly adults with children fell from 4.3 percent to 2.3 percent, as government supports for these families reduced deep poverty by 63 percent in 1993 and 70 percent in 2017.[24]
| TABLE 1 | ||||
|---|---|---|---|---|
| Percent of people in poverty before and after counting government assistance and taxes, 1993 and 2017 | ||||
| Non-elderly adults without children | Non-elderly adults with children | Children | Elderly | |
| 1993 | ||||
| Counting no government assistance or taxes | 13.5% | 21.8% | 31.1% | 57.8% |
| Counting government assistance and taxes | 12.7% | 19.8% | 26.7% | 20.0% |
| Percent change in poverty | -6% | -9% | -14% | -65% |
| 2017 | ||||
| Counting no government assistance or taxes | 14.3% | 18.0% | 25.4% | 49.7% |
| Counting government assistance and taxes | 13.1% | 10.9% | 13.6% | 15.0% |
| Percent change in poverty | -8% | -40% | -46% | -70% |
| Change: 2017 poverty rate minus 1993 poverty rate | ||||
| Counting no government assistance or taxes | 0.8% | -3.7% | -5.6% | -8.1% |
| Counting government assistance and taxes | 0.5% | -8.9% | -13.1% | -5.0% |
For other groups, poverty rates fell significantly over the same period. The poverty rate of children under age 18 was cut nearly in half from 1993 to 2017, from 26.7 percent to 13.6 percent, due in large part to stronger assistance. Unsurprisingly, this is similar to the decline for non-elderly adults with children. (Poverty rates differ slightly for children and the adults who care for them because the average child lives in a larger family than the average adult.) Economic security programs reduced poverty among children dramatically over this period, with government assistance and taxes reducing poverty by 14 percent in 1993 and by 46 percent in 2017.
Poverty also improved for elderly individuals aged 65 and over; from 1993 to 2017, their poverty rate decreased from 20.0 percent to 15.0 percent, and government assistance and taxes in reduced poverty by 65 percent in 1993 and 70 percent in 2017.
Taken together, the figures show that non-elderly adults without children and without income from Social Security or SSI have seen little improvement in their economic security relative to other groups. Unlike other groups, their poverty rate did not fall from 1993 to 2017. And economic security programs reduced their poverty in 2017 far less than for other groups, by just 8 percent, compared to 40 percent for non-elderly adults with children, 46 percent for children, and 70 percent for seniors. (See Table 1 and Figure 5.)
For a complete table of poverty trends, see Appendix Table 2.
COVID-19 Has Worsened Hardship for Many Non-Elderly Adults Without Children
Our analysis reflects poverty prior to the COVID-19 pandemic, which has exacerbated challenges for low-income individuals. While hardship rates among households with children are higher than those without — likely reflecting the fact that larger households require more income to afford food and face higher costs for housing — low-income, non-elderly adults without children have been hard hit. Many have served as essential workers, while others have lost their jobs, some have struggled to receive unemployment benefits despite eligibility expansions, and many are struggling to make ends meet. Although we lack precisely comparable data on the severity of hardship before and after the start of the pandemic, hardship has clearly risen: nearly 13 percent of non-elderly adults not living with children surveyed from November 25 to December 7, 2020 lived in a household that sometimes or often did not get enough to eat in the last seven days, which was three times higher than the share who said their household didn’t get enough to eat sometimes or often during the entire year in a separate survey from December 2019. (For non-elderly adults living with children, the share in late 2020 was even higher — 18 percent, or five times higher than in the 2019 survey.)a
a CBPP analysis of December 2019 Current Population Survey Food Security Supplement public use file and Household Pulse Survey week 20 public use file.
Appendix
| APPENDIX TABLE 1 | |||||
|---|---|---|---|---|---|
| Characteristics of non-elderly adults without children in the family and without income from Social Security or SSI, by income group: 2017 | |||||
| Overall | Below SPM poverty line before counting government assistance or taxes | Below SPM poverty line after counting government assistance and taxes | Below OPM poverty line | Below 200% of OPM poverty line | |
| Age | |||||
| 18 to 24 | 16.9% | 25.2% | 26.0% | 27.5% | 27.3% |
| 25 to 34 | 22.6% | 17.8% | 19.1% | 19.9% | 20.8% |
| 35 to 44 | 12.3% | 11.9% | 11.7% | 11.6% | 11.6% |
| 45 to 54 | 21.0% | 18.7% | 18.4% | 17.3% | 17.7% |
| 55 to 64 | 27.3% | 26.3% | 24.8% | 23.6% | 22.5% |
| Sex | |||||
| Male | 52.0% | 51.0% | 51.1% | 49.8% | 50.2% |
| Female | 48.0% | 49.0% | 48.9% | 50.2% | 49.8% |
| Race/ethnicity | |||||
| White only, not Latino | 63.8% | 50.0% | 48.6% | 52.3% | 51.9% |
| Black only, not Latino | 12.3% | 18.9% | 18.2% | 18.9% | 18.1% |
| Latino (any race) | 15.0% | 20.6% | 21.9% | 18.2% | 20.6% |
| Asian only, not Latino | 6.4% | 7.3% | 7.9% | 7.4% | 6.2% |
| Other, not Latino | 2.4% | 3.2% | 3.3% | 3.2% | 3.3% |
| Education | |||||
| Less than high school graduate | 7.0% | 18.0% | 18.1% | 18.4% | 17.2% |
| High school graduate or GED | 27.3% | 36.5% | 36.0% | 34.4% | 35.9% |
| Some college or associate degree | 26.6% | 24.9% | 24.0% | 23.0% | 25.7% |
| Bachelor’s degree or higher | 39.1% | 20.6% | 21.9% | 24.3% | 21.3% |
| Full-time student | 9.6% | 17.4% | 18.1% | 21.1% | 16.7% |
| Veteran | 4.6% | 3.8% | 3.1% | 3.7% | 3.4% |
| Disability that limits or prevents work | 5.6% | 14.4% | 12.9% | 16.6% | 12.2% |
| Household size | |||||
| 1 person | 17.2% | 20.1% | 23.4% | 24.6% | 23.4% |
| 2 persons | 47.1% | 39.6% | 38.3% | 43.9% | 44.3% |
| 3 or more persons | 35.7% | 40.3% | 38.4% | 31.4% | 32.4% |
| Married, spouse present | 40.3% | 22.6% | 21.8% | 14.7% | 18.4% |
| Worked at least one week last year | 82.6% | 48.2% | 50.3% | 36.8% | 57.8% |
| Metropolitan status* | |||||
| Metropolitan | 88.2% | 87.2% | 88.6% | 86.6% | 85.8% |
| Non-metropolitan | 11.2% | 12.2% | 10.8% | 12.7% | 13.4% |
| Geography | |||||
| Northeast | 18.2% | 16.7% | 16.3% | 14.8% | 14.6% |
| Midwest | 20.6% | 16.6% | 16.3% | 18.2% | 18.5% |
| South | 37.3% | 41.1% | 41.3% | 42.6% | 42.3% |
| West | 23.9% | 25.7% | 26.2% | 24.4% | 24.5% |
| APPENDIX TABLE 2 | |||
|---|---|---|---|
| Characteristics of non-elderly adults with and without children and without income from Social Security or SSI | |||
| Non-elderly adults without children | Non-elderly adults with children | ||
| Age | |||
| 18 to 24 | 16.9% | 13.9% | |
| 25 to 34 | 22.6% | 25.3% | |
| 35 to 44 | 12.3% | 33.4% | |
| 45 to 54 | 21.0% | 21.1% | |
| 55 to 64 | 27.3% | 6.4% | |
| Sex | |||
| Male | 52.0% | 46.5% | |
| Female | 48.0% | 53.5% | |
| Race/ethnicity | |||
| White only, not Latino | 63.8% | 54.4% | |
| Black only, not Latino | 12.3% | 11.7% | |
| Latino (any race) | 15.0% | 23.9% | |
| Asian only, not Latino | 6.4% | 7.3% | |
| Other, not Latino | 2.4% | 2.7% | |
| Education | |||
| Less than high school graduate | 7.0% | 10.3% | |
| High school graduate or GED | 27.3% | 24.7% | |
| Some college or associate degree | 26.6% | 26.7% | |
| Bachelor’s degree or higher | 39.1% | 38.4% | |
| Full-time student | 9.6% | 7.8% | |
| Veteran | 4.6% | 3.8% | |
| Disability that limits or prevents work | 5.6% | 3.3% | |
| Household size | |||
| 1 person | 17.2% | N/A | |
| 2 persons | 47.1% | 3.2% | |
| 3 or more persons | 35.7% | 96.8% | |
| Married, spouse present | 40.3% | 64.7% | |
| Worked at least one week last year | 82.6% | 80.4% | |
| Metropolitan status* | |||
| Metropolitan | 88.2% | 87.4% | |
| Non-metropolitan | 11.2% | 11.7% | |
| Geography | |||
| Northeast | 18.2% | 16.6% | |
| Midwest | 20.6% | 20.4% | |
| South | 37.3% | 37.8% | |
| West | 23.9% | 25.3% | |
| APPENDIX TABLE 3 | |||||
|---|---|---|---|---|---|
| Poverty rates after counting government assistance and taxes for non-elderly adults without children and other groups | |||||
| Year | Children | Non-elderly adults with children, without income from Social Security or SSI | Non-elderly adults without children and without income from Social Security or SSI | Non-elderly adults receiving income from Social Security or SSI | Elderly |
| 1993 | 26.7% | 19.8% | 12.7% | 27.2% | 20.0% |
| 1994 | 23.5% | 17.0% | 12.9% | 27.5% | 19.6% |
| 1995 | 21.5% | 15.5% | 12.5% | 26.7% | 18.3% |
| 1996 | 21.2% | 15.4% | 11.9% | 26.4% | 18.1% |
| 1997 | 21.4% | 15.4% | 11.9% | 27.2% | 17.7% |
| 1998 | 20.0% | 14.2% | 10.9% | 26.5% | 16.9% |
| 1999 | 17.9% | 13.0% | 11.0% | 25.8% | 16.0% |
| 2001 | 17.8% | 13.1% | 11.4% | 24.4% | 17.1% |
| 2002 | 17.7% | 13.2% | 11.6% | 24.8% | 17.5% |
| 2003 | 17.4% | 13.0% | 11.7% | 24.2% | 17.7% |
| 2004 | 16.1% | 12.3% | 12.4% | 23.3% | 17.3% |
| 2005 | 16.2% | 12.2% | 12.1% | 23.6% | 17.0% |
| 2006 | 16.5% | 12.8% | 12.2% | 23.7% | 18.1% |
| 2007 | 16.8% | 13.5% | 11.9% | 23.8% | 18.0% |
| 2008 | 16.9% | 13.5% | 12.6% | 22.1% | 17.1% |
| 2009 | 14.3% | 12.0% | 13.5% | 22.4% | 14.8% |
| 2010 | 14.1% | 11.9% | 13.8% | 23.8% | 16.2% |
| 2011 | 14.7% | 12.7% | 14.2% | 24.9% | 15.3% |
| 2012 | 15.2% | 13.3% | 14.6% | 25.6% | 15.6% |
| 2013 | 15.5% | 13.3% | 15.5% | 26.6% | 16.5% |
| 2014 | 15.6% | 13.2% | 15.5% | 26.9% | 16.3% |
| 2015 | 14.5% | 12.2% | 13.7% | 25.7% | 15.0% |
| 2016 | 13.6% | 11.3% | 13.4% | 24.2% | 15.6% |
| 2017 | 13.6% | 10.9% | 13.1% | 23.8% | 15.0% |
| APPENDIX TABLE 4 | |||||
|---|---|---|---|---|---|
| Poverty reduction due to government assistance and taxes for non-elderly adults without children and other groups | |||||
| Year | Children | Non-elderly adults with children, without income from Social Security or SSI | Non-elderly adults without children and without income from Social Security or SSI | Non-elderly adults receiving income from Social Security or SSI | Elderly |
| 1993 | 14% | 9% | 6% | 56% | 65% |
| 1994 | 20% | 15% | 2% | 54% | 67% |
| 1995 | 25% | 20% | 2% | 55% | 68% |
| 1996 | 24% | 17% | 5% | 56% | 68% |
| 1997 | 20% | 14% | 3% | 57% | 68% |
| 1998 | 22% | 17% | 4% | 56% | 69% |
| 1999 | 25% | 20% | 4% | 56% | 70% |
| 2001 | 23% | 17% | 3% | 59% | 70% |
| 2002 | 26% | 20% | 7% | 59% | 69% |
| 2003 | 29% | 23% | 8% | 60% | 68% |
| 2004 | 32% | 27% | 7% | 61% | 69% |
| 2005 | 32% | 26% | 6% | 61% | 69% |
| 2006 | 31% | 23% | 0% | 60% | 67% |
| 2007 | 31% | 22% | 2% | 61% | 67% |
| 2008 | 36% | 30% | 11% | 64% | 68% |
| 2009 | 52% | 47% | 19% | 66% | 74% |
| 2010 | 53% | 48% | 19% | 64% | 71% |
| 2011 | 51% | 44% | 15% | 63% | 72% |
| 2012 | 50% | 43% | 15% | 62% | 72% |
| 2013 | 47% | 40% | 9% | 61% | 69% |
| 2014 | 46% | 39% | 6% | 59% | 69% |
| 2015 | 48% | 40% | 9% | 60% | 71% |
| 2016 | 48% | 40% | 8% | 62% | 69% |
| 2017 | 46% | 40% | 8% | 62% | 70% |
Methodology
Characteristics of Non-Elderly Adults Without Children
We examine the characteristics of non-elderly adults without children using the U.S. Census Bureau’s March 2018 Current Population Survey (CPS).[25] We define non-elderly adults without children as individuals aged 18 to 64 with no children in their SPM family unit. (Note that based on this definition, non-elderly adults without children could still live in a household that includes children who are not members of their family, or they could be supporting their own children who live in a different household.)
To limit the overall population of non-elderly adults without children to those who are not receiving disability income, we further restrict it to individuals with no personal income from Social Security or SSI. We exclude all Social Security participants, not just those with SSDI, because the CPS did not ask the reason for receiving Social Security in the early years of our analysis. In the March 2018 CPS, half of non-elderly adults without children who are receiving income from Social Security but not from SSI listed disability as their principal reason for receiving Social Security (that is, 4.0 million out of 8.0 million Social Security participants received SSDI). The next most common reason was early retirement.
For characteristics of non-elderly adults with income below the SPM poverty line, before and after counting government assistance and taxes, we use the 2019 SPM poverty line adjusted back in time for inflation (a process known as “anchoring”). We use the 2019 SPM poverty line, as opposed to the 2017 SPM poverty line, for consistency with our poverty trends analysis. (See “Analysis of Poverty Trends” below for more detail.)
Analysis of Work Experience Over Time
The Census Bureau’s Survey of Income and Participation (SIPP) is a large-scale, national survey that collects information about household, family, and individual income; program participation; labor force activity; and demographics. It is a longitudinal survey conducted over a multi-year period. Each panel of survey respondents lasts for four years, with each year referred to as a “wave.” Our SIPP analysis is restricted to individuals who are age 18-64, have no children in the family, and do not receive income from SSI or SSDI. We define low income as below 200 percent of the U.S. Census Bureau’s official poverty thresholds.
We examine the employment of low-income, non-elderly adults without children using a survey variable indicating whether a respondent held a job at least one week during the month. We look at employment in a given month of wave 3 of the 2014 SIPP panel (March 2015), and within a 25-month period centered on that month. The estimated percent of low-income, non-elderly adults without children who worked within the 25-month period is not sensitive to the choice of the given month within the 2014 SIPP panel. Across all possible reference months, the estimate ranged from 75 percent to 77 percent.
To be included in this analysis, an individual must be in the SIPP sample universe (civilian, non-institutionalized population) in March 2015 and have a positive SIPP panel weight. The Census Bureau computes panel weights only for people who were in the sample in the first wave and for whom data were reported (or imputed) for each month in the panel for which they were in the SIPP sample universe. This analysis must utilize panel weights because they are the only longitudinal weight that covers the entire period of interest, which spans three waves. An individual must also have provided data for every month in the 25-month period. (An individual who did not provide data for all months may have a positive panel weights if they provided data up until they left the survey due to death or moving to an ineligible address.) Of low-income, non-elderly adults without children in the SIPP sample universe in March 2015, 50 percent have positive panel weights and provided data for every month in the 25-month period.
Analysis of Poverty Trends
We create a poverty series by merging data files from the Census Bureau’s Current Population Survey (CPS) with historical SPM data produced by the Columbia Center on Poverty and Social Policy.[26] We use the Census Bureau’s SPM data for 2009 through 2017, and the Columbia SPM data for prior years. We correct for underreporting of income from SNAP, SSI, and Aid to Families and Dependent Children/TANF with the Department of Health and Human Services/Urban Institute Transfer Income Model (TRIM). Our poverty series ranges from 1993 to 2017, years for which TRIM data are available. Data for 2000 are omitted due to sample differences between TRIM data and historical SPM data.
For our poverty trends, we define non-elderly adults without children the same way as our analysis of characteristics: Non-elderly adults without children are defined as individuals aged 18 to 64 with no children in their SPM family unit and no personal income from Social Security or SSI. (See “Characteristics of Non-Elderly Adults Without Children” above for more information.)
Our poverty series uses the 2019 SPM poverty line, adjusted in years before for inflation. Using a recent year’s SPM threshold and adjusting it back for inflation creates an “anchored” SPM series.[27] Some analysts prefer it to the standard or “relative” SPM, which allows thresholds to grow slightly faster than inflation as living standards rise across decades. For this analysis, we used an anchored series to ensure that the trends we find are purely due to changes in families’ resources, not changes in the poverty thresholds. We anchored all poverty thresholds to 2019 since it is the latest SPM threshold available.
In our calculations, government assistance includes: Social Security, unemployment insurance, workers’ compensation, veterans’ benefits, TANF, state General Assistance, SSI, SNAP, the National School Lunch Program, the Special Supplemental Nutrition Program for Women, Infants, and Children (WIC), rental assistance (such as Section 8 and public housing), home energy assistance, the EITC, and the Child Tax Credit. Benefit figures for 2008-2010 also reflect a number of temporary federal benefits enacted in response to the Great Recession: a 2008 stimulus payment, 2009 economic recovery payment, and the 2009-2010 Making Work Pay Tax Credit.
End Notes
[1] In this report, we focus on non-elderly adults who do not have children under 18 in their family living in the same household. Based on this definition, “non-elderly adults without children” could include individuals living in a household that includes children who are not members of their family, or they could be supporting their own children who live in a different household.
[2] For a detailed discussion of government policies that support these individuals, see Joseph Llobrera et al., “A Frayed and Fragmented System of Supports for Low-Income Adults Without Minor Children,” CBPP, January 28, 2021, https://www.cbpp.org/research/poverty-and-inequality/a-frayed-and-fragmented-system-of-supports-for-low-income-adults.
[3] TY 2017 EITC Table in the IRS Compliance Data Warehouse, as of April 16, 2019, unpublished data provided by IRS.
[4] Analyses in this report using the U.S. Census Bureau’s Survey of Income and Participation (SIPP) exclude those receiving income from SSI or Social Security Disability Insurance (SSDI), while analyses using the CPS Annual Social and Economic Supplement exclude those who receive income from Social Security or SSI due to data limitations. When calculating the number of adults who do not receive Social Security and SSI, we also exclude those who receive early Social Security retirement benefits at ages 62, 63, and 64.
[5] CBPP analysis of U.S. Census Bureau’s March 2018 Current Population Survey (accessed via IPUMS-CPS). Despite having no children under 18 in the family, about 10 percent have an adult child ages 18 to 25 and 5 percent have an elderly parent age 65 or older in the family.
[6] Racial and ethnic categories in this report do not overlap. Figures for each racial group such as Black, white, or Asian do not include individuals who identify as multiracial or people of Latino ethnicity. Latino includes all people of Hispanic, Latino, or Spanish origin regardless of race. People of color refers to not white and includes all multiracial and Latino people. How individuals’ overlapping racial and ethnic identities are classified makes an especially large difference for the American Indian and Alaska Native (AIAN) population. Among non-elderly adults without children and no Social Security or SSI income, 2 percent identify as AIAN alone or in combination with other races, without regard to Latino ethnicity (the most inclusive categorization). Just 0.7 percent identify as AIAN alone and not Latino (using the non-overlapping approach used elsewhere in this report).
[7] SSI provides monthly cash assistance to people with severe disabilities, little income, and few assets. SSDI applicants, in addition to meeting SSI’s strict medical criteria, must have worked long enough and recently enough in jobs covered by Social Security. For more information see: CBPP, “Policy Basics: Introduction to Supplemental Security Income,” updated January 6, 2021, https://www.cbpp.org/research/social-security/policy-basics-introduction-to-supplemental-security-income and CBPP, “Chart Book: Social Security Disability Insurance, Part III: Who Receives SSDI?” updated September 6, 2019, https://www.cbpp.org/research/social-security/chart-book-social-security-disability-insurance#Section_three.
[8] Danilo Trisi and Matt Saenz, “Economic Security Programs Reduce Overall Poverty, Racial and Ethnic Inequities,” CBPP, January 28, 2021, https://www.cbpp.org/research/poverty-and-inequality/economic-security-programs-reduce-overall-poverty-racial-and-ethnic.
[9] For educational attainment, we limit to individuals aged 25 to 64.
[10] Brynne Keith-Jennings and Vincent Palacios, “SNAP Helps Millions of Low-Wage Workers,” CBPP, May 10, 2017, https://www.cbpp.org/research/food-assistance/snap-helps-millions-of-low-wage-workers.
[11] U.S. Bureau of Labor Statistics, Employee Benefits Survey, https://www.bls.gov/news.release/ebs2.t06.htm. This survey constructs hourly wage percentiles by looking at average reported hourly wages for workers by occupation. (Because these averages are for occupations, workers may fall into a different percentile than their occupation as a whole if they earn more or less than the average for their occupation.)
[12] The Census Bureau’s Survey of Income and Participation (SIPP) is a large-scale, national survey that collects information about household and individual income, program participation, labor force activity, and demographics. It is a longitudinal survey conducted over a multi-year period. Our analysis is restricted to individuals who are age 18-64, have no children in the family, and do not receive income from SSI or SSDI. We define low income as below 200 percent of the U.S. Census Bureau’s official poverty thresholds. For additional details on methodology, see the Appendix.
[13] Respondents could report more than one reason for their joblessness. Health reasons include temporarily unable to work because of an injury (2 percent), temporarily unable to work because of an illness (3 percent), and unable to work because of a chronic health condition or disability (23 percent).
[14] A core disability is defined as one or more of the six functional limitations with hearing, seeing, cognitive activities, ambulatory activities, self-care activities, and independent living activities; this definition is consistent with the standard disability questions implemented across multiple government surveys, including the American Community Survey and Current Population Survey. A work-related disability is defined as a physical, mental, or other health condition that limits the kind or amount of work that can be done, prevents one from working, or makes it difficult to find a job or remain employed.
[15] Racial and ethnic categories in this report do not overlap; see footnote 6 for details. Note that among low-income, non-elderly adults without children, the difference in work status between white individuals and people of color overall is statistically significant at the 90 percent confidence level. The shares of those working within a year by racial or ethnic group are 78 percent white, 77 percent Latino, 73 percent Black, 68 percent Asian, and 67 percent another race or multiple races; the difference between white and Asian is statistically significant, as is the difference between white and “another or multiple races,” while the other differences are not statistically significant.
[16] Danilo Trisi and Matt Saenz, “Economic Security Programs Cut Poverty Nearly in Half Over Last 50 Years,” CBPP, November 26, 2019, https://www.cbpp.org/research/poverty-and-inequality/economic-security-programs-cut-poverty-nearly-in-half-over-last-50.
[17] Two of these 14 states plan to implement the Affordable Care Act’s Medicaid expansion in the near future as a result of successful ballot initiatives in 2020.
[18] Chuck Marr, “President-Elect’s Plan Includes Vital EITC Increase for Adults Not Raising Children,” CBPP, January 15, 2021, https://www.cbpp.org/blog/president-elects-plan-includes-vital-eitc-increase-for-adults-not-raising-children.
[19] Alicia Mazzara, Barbara Sard, and Douglas Rice, “Rental Assistance to Families with Children at Lowest Point in Decade,” CBPP, October 18, 2016, https://www.cbpp.org/research/housing/rental-assistance-to-families-with-children-at-lowest-point-in-decade.
[20] The SPM counts income from SNAP, rental subsidies, and other federal non-cash benefits and refundable tax credits, which the official poverty measure omits. The SPM also subtracts federal and state income taxes, federal payroll taxes, and certain expenses (such as child care and out-of-pocket medical expenses) from income when calculating a family’s available income for basics such as food, clothing, and shelter. A family is considered to be in poverty if its resources are below a poverty threshold that accounts for differences in family composition and geographic differences in housing costs. We correct for underreporting of income from SNAP, SSI, and TANF with the Department of Health and Human Services/Urban Institute Transfer Income Model (TRIM). See methodology section in the Appendix for additional details.
[21] In this report we use the terms “economic security programs,” “government assistance,” and “government benefits” interchangeably. See methodology section in the Appendix for additional details.
[22] The years 1993 and 2017 reflect different points in the business cycle, as 1993 marked the early stages of an economic recovery and 2017 was late in a recovery. However, we find a similar pattern of results when comparing years when economic conditions were more comparable, 1999 and 2017, both years with strong economies near the peak of the business cycle. (While 2000 was the last full economic growth year prior to the peak of the cycle in March 2001, we use 1999 because corrected SPM data are not available for 2000.) The poverty rate for non-elderly adults without children or income from Social Security or SSI was 11.0 percent in 1999 (lower than in 1993), indicating an even larger increase in poverty over time (13.1 percent in 2017). Government assistance programs reduced the poverty rate by 4 percent in 1999 (less than in 1993), reflecting a greater improvement in effectiveness over time (8 percent in 2017). But again, this group struggles when compared with non-elderly adults with children, whose poverty rate decreased from 13.0 percent in 1999 to 10.9 percent in 2017 and whose poverty reduction due to economic security programs improved from 20 percent in 1999 to 40 percent in 2017.
[23] As explained above, this analysis excludes non-elderly adults who receive income from Social Security or SSI. When participants in Social Security and SSI are included in the analysis, the poverty rate of non-elderly adults without children rises significantly, from 13.6 percent in 1993 to 14.3 percent in 2017, rather than remaining statistically unchanged.
We also find that economic security programs have a greater impact in each year when participants in Social Security and SSI are included, although these government supports still show only modestly increasing effectiveness over time; government supports lowered poverty by 22 percent in 1993, and by 26 percent in 2017, when these program participants are included. For non-elderly adults with children (both with and without Social Security and SSI), poverty rates are similar to those for the group excluding these income sources (20.4 percent in 1993 and 11.3 percent in 2017), as is the effectiveness of economic security programs (a 14 percent reduction in 1993 and a 43 percent reduction in 2017). Thus, for non-elderly adults without children overall (including those with and without Social Security and SSI), poverty has increased over time, and the effectiveness of economic security programs has improved but much less than the three-fold increase for non-elderly adults with children.
The number of non-elderly adults without children who receive disability or other assistance from Social Security or SSI has risen by about 66 percent since 1993 in the Census data, to about 12 million in 2017. Most of this increase relates to demographic factors such as population growth, aging among those aged 18 to 64 (because older workers have higher rates of disability), and the growing number of women workers with earnings high enough to qualify for SSDI. For a discussion of these factors, see: https://www.cbpp.org/research/how-much-of-the-growth-in-disability-insurance-stems-from-demographic-changes.
[24] From 1995 to 2005, however, a series of policy changes weakened economic security programs for the very poorest children, causing a rise in the share of children below one-half of the poverty line even as children’s overall poverty rate declined, earlier analyses have found. For a detailed discussion, see Danilo Trisi and Matt Saenz, “Deep Poverty Among Children Rose in TANF’s First Decade, Then Fell as Other Programs Strengthened,” CBPP, February 27, 2020, https://www.cbpp.org/research/poverty-and-inequality/deep-poverty-among-children-rose-in-tanfs-first-decade-then-fell-as.
[25] We access Current Population Survey data via IPUMS-CPS, University of Minnesota, www.ipums.org.
[26] The Current Population Survey data we access via IPUMS-CPS, University of Minnesota, www.ipums.org. The historical Supplemental Poverty Measure data come from the Center on Poverty and Social Policy at Columbia University, https://www.povertycenter.columbia.edu/historical-spm-data-reg.
[27] Chris Wimer et al., “Trends in Poverty with an Anchored Supplemental Poverty Measure,” Columbia Population Research Center Working Paper No. 13-01, December 2013, https://academiccommons.columbia.edu/doi/10.7916/D8RN3853.
More from the Authors