BEYOND THE NUMBERS
9 in 10 Families With Low Incomes Are Using Child Tax Credits to Pay for Necessities, Education
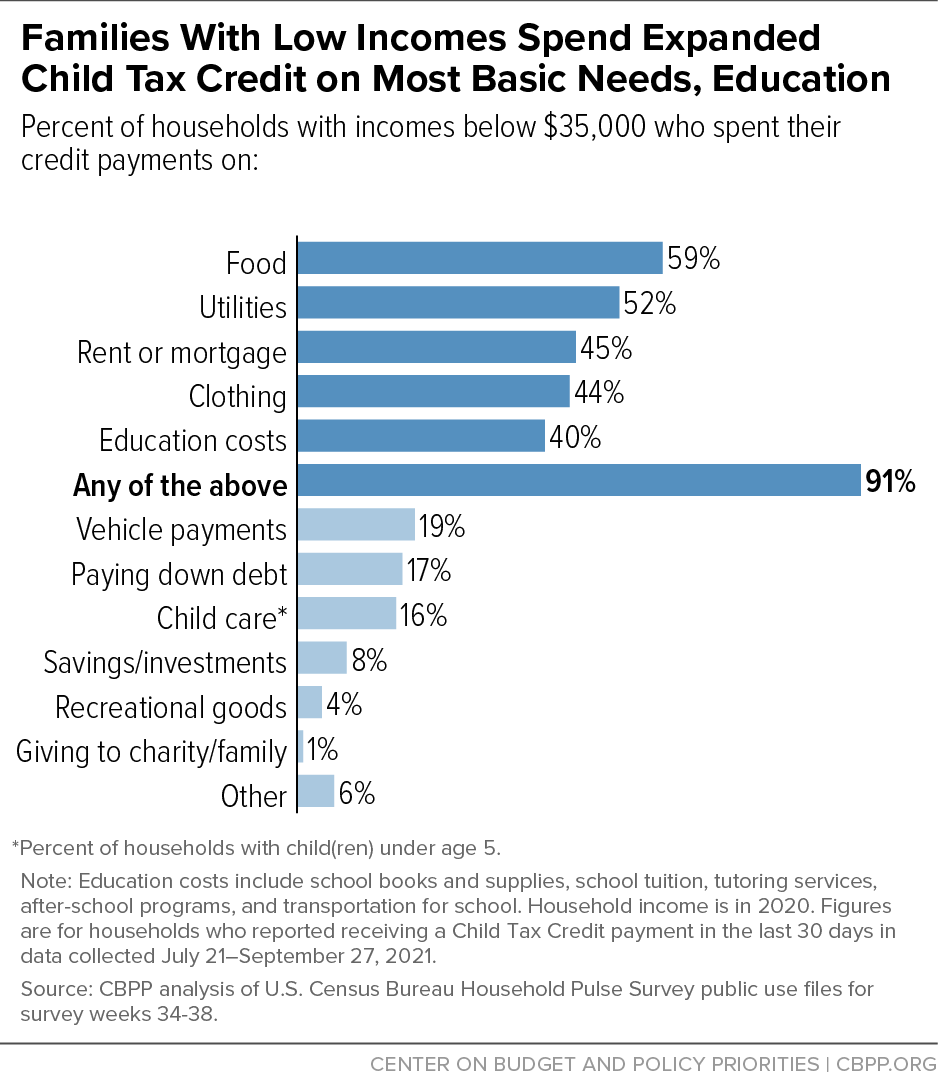
Some 91 percent of families with low incomes (less than $35,000) are using their monthly Child Tax Credit payments for the most basic household expenses — food, clothing, shelter, and utilities — or education. Families are making these investments nationwide: in every state and the District of Columbia, large majorities of low-income families are making such use of the credit, according to our new analysis of Census Bureau data covering the first three months of payments.
Many of these households are receiving the full Child Tax Credit for the first time thanks to the American Rescue Plan’s credit expansion. The Rescue Plan temporarily increased the credit amount, provided for the credit to be paid monthly rather than once a year at tax time, and halted a policy that prevented 27 million children from receiving the full credit because their parents earned too little or lacked earnings in a given year. Congress should make it a top priority to ensure that the full credit remains permanently available to children in families with the lowest incomes, a measure that in percentage terms drives 87 percent of the expansion’s anti-poverty impact.
The vast majority of low-income households with children spent some or all of their new monthly payments on necessities, according to our analysis of detailed data from Census’s Household Pulse Survey collected from late July through late September. Among households with incomes below $35,000 who received the Child Tax Credit, 88 percent spent their payments on the most basic needs: food, clothing, rent, a mortgage, or utility bills.
The Child Tax Credit payments also helped many parents and other caregivers invest in their children’s education, Pulse data suggest. Some 40 percent of families with low incomes used their Child Tax Credit payments to cover education costs such as school books and supplies, tuition, after-school programs, and transportation to and from school. (In some cases, these expenses may be for adults’ own education. About 5 percent of adults in low-income households with children are enrolled in school, other Census data show.)
These findings are consistent with evidence from Canada, where parents — particularly those with low incomes — spend their child allowances on essentials and education expenses. A sizeable share of U.S. households with incomes above $35,000 also spent the credit on necessities, but a smaller share did so than lower-income families, who face more difficulties affording the basics.
As the chart shows, low-income families also commonly used the credits for other needs like monthly car payments, child care (for families with children under age 5), and paying down debt.
And in all 50 states and the District of Columbia, large majorities of families with low incomes put their Child Tax Credit payments toward the most basic necessities, education, or both.
| Nationwide, Most Low-Income Households Are Using Monthly Child Tax Credit Payments to Pay for Basic Needs, Education | ||
|---|---|---|
| Share of households with incomes below $35,000 who used their Child Tax Credit payment for: | ||
| State | Basic Needs (Food, Clothing, Rent, Mortgage, Utilities) | Basic Needs and/or Education Costs |
| U.S. | 88% | 91% |
| Alabama | 91% | 95% |
| Alaska | 91% | 93% |
| Arizona | 90% | 92% |
| Arkansas | 95% | 96% |
| California | 87% | 89% |
| Colorado | 84% | 86% |
| Connecticut | 93% | 93% |
| Delaware | 96% | 96% |
| District of Columbia | 96% | 97% |
| Florida | 88% | 90% |
| Georgia | 96% | 96% |
| Hawai'i | 83% | 84% |
| Idaho | 85% | 88% |
| Illinois | 83% | 86% |
| Indiana | 79% | 81% |
| Iowa | 88% | 90% |
| Kansas | 90% | 91% |
| Kentucky | 91% | 91% |
| Louisiana | 91% | 93% |
| Maine | 86% | 88% |
| Maryland | 90% | 93% |
| Massachusetts | 93% | 94% |
| Michigan | 91% | 94% |
| Minnesota | 85% | 86% |
| Mississippi | 90% | 94% |
| Missouri | 90% | 90% |
| Montana | 82% | 86% |
| Nebraska | 84% | 87% |
| Nevada | 87% | 90% |
| New Hampshire | 75% | 75% |
| New Jersey | 87% | 89% |
| New Mexico | 89% | 92% |
| New York | 86% | 86% |
| North Carolina | 87% | 93% |
| North Dakota | 91% | 93% |
| Ohio | 87% | 90% |
| Oklahoma | 91% | 92% |
| Oregon | 87% | 89% |
| Pennsylvania | 89% | 93% |
| Rhode Island | 87% | 89% |
| South Carolina | 91% | 93% |
| South Dakota | 89% | 89% |
| Tennessee | 89% | 91% |
| Texas | 87% | 93% |
| Utah | 82% | 85% |
| Vermont | 81% | 83% |
| Virginia | 86% | 88% |
| Washington | 87% | 89% |
| West Virginia | 90% | 91% |
| Wisconsin | 91% | 92% |
| Wyoming | 92% | 94% |
Note: Education costs include school books and supplies, school tuition, tutoring services, after-school programs, and transportation for school. Household income is for 2020. Figures are for households who reported receiving a Child Tax Credit payment in the last 30 days in data collected July 21–September 27, 2021. Modest differences between states may reflect sampling error.
Source: CBPP analysis of U.S. Census Bureau Household Pulse Survey public use files for survey weeks 34-38.

