BEYOND THE NUMBERS
Data Dashboard Shows Economic and Health Security Program Participation, Anti-Poverty Effects
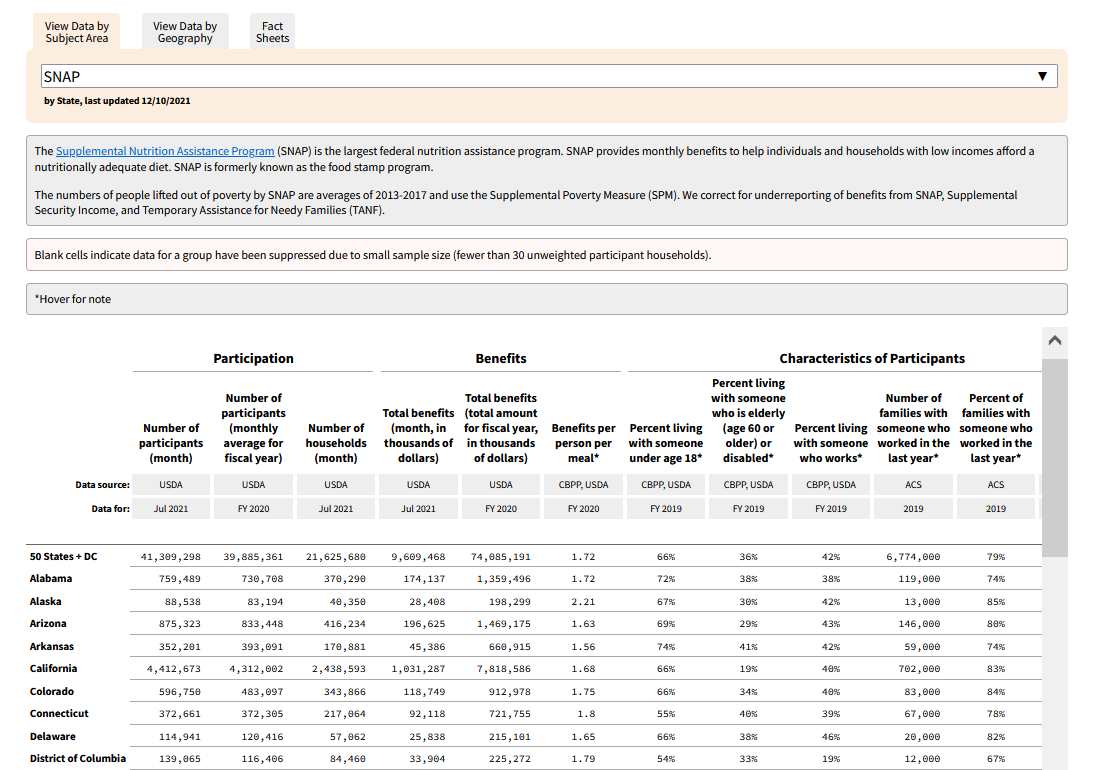
CBPP’s program participation data dashboard highlights the important role that economic and health security programs play in supporting low- and moderate-income residents and in reducing poverty in every state.
The dashboard provides easy access to state-by-state data on participation in SNAP, Medicaid, federal rental assistance, Supplemental Security Income, Social Security Disability Insurance, home energy assistance, and the federal Earned Income Tax Credit and Child Tax Credit — as well as the extent to which economic security programs reduce poverty overall and for children.
Interactive tables can be viewed by program or state and downloaded as an Excel spreadsheet. The dashboard also provides access to background information on each program through links to CBPP’s Policy Basics series and other fact sheets. The dashboard is updated regularly as new data are released.
Tables show the number of program participants, benefit amount, and characteristics such as age, race and ethnicity, gender, residence in non-metropolitan areas, and family work experience. Each data point draws on the most reliable available source such as administrative data or Census Bureau surveys.
In addition to state data, the dashboard includes Earned Income Tax Credit and Child Tax Credit filers and credit amounts by state legislative district and congressional district.
Poverty estimates tabulated by CBPP from the federal Supplemental Poverty Measure (SPM) show the number of people lifted above the poverty line by economic security programs in each state, and the percent of people below the poverty line before and after counting government assistance and taxes. SPM data are available by race and age. The SPM counts more forms of income than the “official” poverty measure (among other differences) and therefore more accurately reflects the resources available to low-income households than the official poverty measure. The dashboard also shows the number and percentage of people below the official poverty line and 200 percent of the official poverty line.

