Robust COVID Relief Achieved Historic Gains Against Poverty and Hardship, Bolstered Economy

When COVID-19 began to rapidly spread across the United States in March 2020, the economy quickly shed more than 20 million jobs. Amid intense fear and hardship, federal policymakers responded, enacting five relief bills in 2020 that provided an estimated $3.3 trillion of relief and the American Rescue Plan in 2021, which added another $1.8 trillion. This robust policy response helped make the COVID-19 recession the shortest on record and helped fuel an economic recovery that has brought the unemployment rate, which peaked at 14.8 percent in April 2020, down to 4.0 percent. One measure of annual poverty declined by the most on record in 2020, in data back to 1967, and the number of uninsured people remained stable, rather than rising as typically happens with large-scale job loss. Various data indicate that in 2021, relief measures reduced poverty, helped people access health coverage, and reduced hardships like inability to afford food or meet other basic needs.

These positive results contrast with the Great Recession of 2007-2009, when the federal response was large compared to measures taken in other post-World War II recessions but less than one-third as large as the fiscal policy measures adopted in 2020-2021, when measured as a share of the economy. While decried by some at the time as too large, the relief measures enacted during the Great Recession were undersized and ended too soon. As a result, the economy remained weak for longer than was necessary — and families suffered avoidable hardship. Two years after the Great Recession began, unemployment was still 9.9 percent and food insecurity remained one-third above its pre-recession level. While some of that difference stems from differences in the trigger to the downturn, some is clearly due to the strength of the policy response.

The federal response to the pandemic was not only large but also broad in its reach and innovative in its policy approaches. In addition to funding the public health response to the pandemic, such as personal protective equipment, testing, and vaccines, the federal government took a number of steps for the first time:

  • Providing cash payments to individuals regardless of whether they filed taxes or had a minimum level of income and delivering the payments automatically to tens of millions of recipients of federal benefits as well as those who had filed taxes.
  • Expanding unemployment coverage to a broader group of workers, including part-time and self-employed workers, workers in the gig economy, and workers with less tenure, while also increasing the value substantially more than in the Great Recession and, as in past downturns, increasing the duration of coverage.
  • Making the full Child Tax Credit available to the lowest-income children and, building on prior expansions, substantially increasing the credit amount.
  • Providing uninterrupted health insurance coverage for Medicaid enrollees across all states and lowering or eliminating premiums for Affordable Care Act (ACA) marketplace enrollees.
  • Enacting a national paid leave policy, albeit one with substantial gaps.
  • Creating a new emergency school meal replacement program using electronic benefit cards and, building on steps taken during the Great Recession, increasing the value of SNAP and WIC benefits.
  • Establishing a federal eviction prevention program and increasing rental assistance while also, as in the Great Recession, expanding funding for homelessness assistance.
  • Providing resources to help shore up child care providers in light of concerns that many were going out of business, while also expanding access to child care assistance to stretched families, building on the child care assistance expansion during the Great Recession.
  • Providing fiscal aid to cities, counties, and tribal governments, whose budgets have been severely challenged by the pandemic.

The federal response also included:

  • Providing more substantial fiscal aid to states than in the Great Recession.
  • Providing funds for states to provide emergency assistance to help families with children with very low incomes.

The large, broad, and innovative relief effort has directly strengthened the recovery and reduced hardship, the Congressional Budget Office (CBO) and other independent analysts agree. International comparisons show that nations with larger fiscal responses to the pandemic, such as the U.S., have experienced stronger growth.[1] In substantial part due to federal action:

  • The recession lasted only two quarters, the shortest recession on record.
  • The unemployment rate fell rapidly to 6.7 percent at the end of 2020 and to 4.0 percent today, only modestly above the low pre-pandemic level of 3.5 percent and much lower than at this point in the recoveries from the last three recessions.
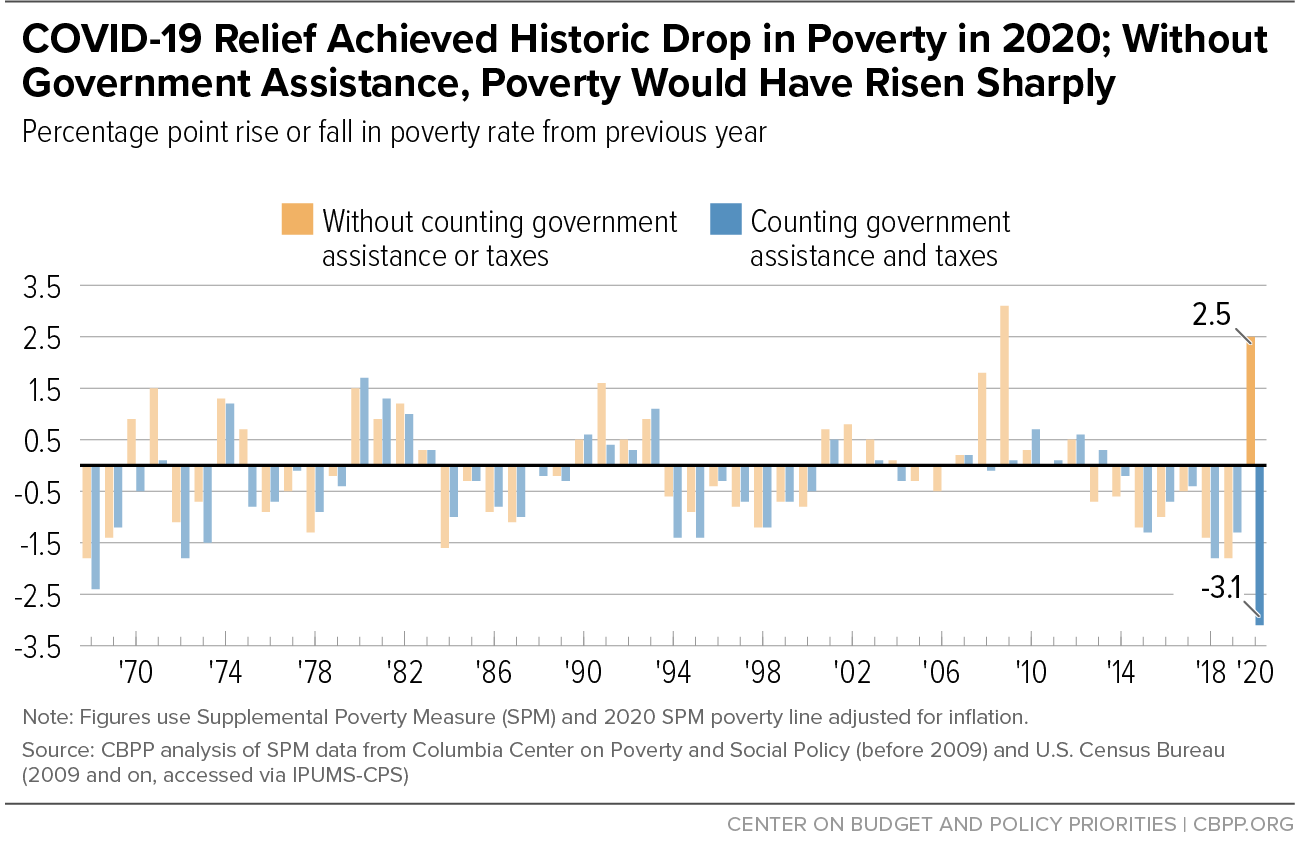
  • The number of people with annual income below the poverty line, accounting for government assistance, fell by 8 million in 2020, the largest amount on record in data going back to 1967. Monthly estimates showed poverty continued to decline from 2020 to 2021.
  • The number of adults reporting that their household did not get enough to eat in the last seven days declined in 2021 after peaking in late 2020. A more detailed annual measure of food insecurity suggests that food hardship was largely kept in check in 2020.
  • Health insurance coverage remained roughly stable even though millions of people lost employer-provided health insurance. Medicaid enrollment increased by over 12 million from February 2020 to July 2021 due to relief provisions that provided continuity of coverage, and ACA marketplace enrollment grew by more than 3 million from 2020 to 2022.
  • Despite significant administrative challenges, millions of people received jobless benefits because of temporary eligibility expansions and tens of millions received increased benefits. Jobless benefits kept 5.5 million out of poverty in 2020, Census data show.
  • There was no surge in evictions even though millions of people were behind on paying their rent. Over 3.2 million households received emergency rental assistance from January to November 2021 to help them with past-due and current rent bills, forestalling eviction for many.

Surveying the impacts on hardship, H. Luke Shaefer of the University of Michigan concluded, “This is the best, most successful response to an economic crisis that we have ever mounted, and it is not even close.”[2]

The economic fallout from the pandemic was especially severe for workers in low-wage sectors of the economy, such as restaurants and hospitality, in which people of color and women are overrepresented. Black and Latino people were already more economically vulnerable due to structural racism and the history of discrimination in employment, housing, education, and other areas. This meant that many elements of the pandemic response that targeted those with the greatest need had particularly large, positive impacts on these communities.

Today there is significant focus on the recent rise in inflation, which stretches families’ budgets, though rising wages, particularly at the low end of the wage scale, have helped offset some of the impacts. As discussed in more detail below, there are a number of factors driving inflation, including pandemic-related changes to the types of goods people are buying and challenges in increasing production amid an ongoing pandemic in some sectors. While high inflation has lasted longer than many analysts had predicted, the Federal Reserve has tools that it intends to use to bring it down. Lowering inflation is important, but the current strong job and economic growth have been critical to mitigating the hardship that people would have faced in the absence of a strong policy response to an unprecedented crisis.

The COVID relief effort teaches important lessons. It shows that a rapid, robust, and broad-based response can greatly speed recovery, reduce suffering, and mitigate disparities. As Mark Zandi and the economists at Moody’s Analytics conclude in a new analysis, “policymakers’ decisiveness in pushing forward with substantial government support has been an economic gamechanger.” They estimate that, “the [U.S.] economy is currently on track to recoup all of the jobs lost during the pandemic recession by late this year. Without government support, this milestone would not have been achieved until summer 2026” and “[l]ow-wage workers, which have suffered most financially during the pandemic, would have been set back even further.”[3]

And while the pandemic made getting help to some people more difficult, the emergency also spurred new approaches to delivery — such as online portals, increased phone and video access to services, and simplified applications — that will have lasting value for providing equitable access, even as in-person services resume.

Also, many temporary policy changes made during the pandemic — in the Child Tax Credit, unemployment insurance, and health and housing programs — drove gains against poverty, lack of health coverage, and hardship. The nation should learn from and build on these efforts to address economic and health insecurity — and glaring disparities in hardship and opportunity across lines of race and ethnicity — that long predate the crisis. Although not the focus of this paper, a compromise agreement on the Build Back Better legislation could build on the successes of these policies to address near-term hardship, expand access to health care, and expand opportunity.[4]

Poverty and Hardship

It is difficult to overstate the importance of federal relief policies in preventing greater hardship during the twin health and economic crises. The pandemic’s unprecedented earnings declines could have triggered unprecedented suffering, as well as a more protracted downturn and longer period of high unemployment. Instead, annual poverty declined more than ever on record and most groups experienced smaller growth in food hardship in 2020 than in the previous recession, despite the economy’s steeper job losses. While many families had harsh financial ups and downs due to delays and gaps in assistance and the severity of the crisis itself, relief measures reduced poverty and lifted many households’ annual incomes above pre-pandemic levels.

Analysis using the Supplemental Poverty Measure (SPM) — the more comprehensive of the government’s two annual poverty measures, which counts both cash and cash-like assistance in determining poverty status and has data back to 1967 — shows: [5]

  • When government assistance is included, the number of people with annual income below the poverty line fell in 2020 by the largest amount on record: 8 million.[6] Without government assistance, the number of people in poverty would have risen in 2020 by the second-largest amount on record: 9 million.[7] (See Figure 1.)
  • Government assistance protected those with moderate incomes as well as people below the poverty line, preventing 33 million people in 2020 from falling below a family income of $40,000, up from 14 million in 2019.[8]

Poverty would not have fallen in 2020 without the newly enacted policies. Income from just two programs — unemployment insurance (consisting mostly of temporary eligibility and benefit expansions) and newly enacted Economic Impact Payments (EIPs) — lifted the 2020 incomes of 17 million people above the poverty line, reducing the number of people below the poverty line by more than one-third. Families also received important added assistance from existing programs, such as traditional state unemployment insurance (UI), food and rental subsidies, tax credits, and Social Security.

Examining real-time hardship and consumer spending data, many analysts have noted the policies’ powerful influence.[9] From August 2020 to December 2021, the share of adults in households without enough to eat in the last seven days fell a statistically significant amount on three occasions after federal aid was distributed:

  • In early January 2021, after the Treasury Department delivered EIPs worth $600 per person (starting December 29), the share of adults with children in food-insufficient homes, where someone did not have enough to eat in the past seven days, fell one-sixth.
  • In late March 2021, after the Treasury Department disbursed EIPs worth $1,400 per person (starting mid-month), food insufficiency for adults with children fell one-fourth.
  • In late July 2021, after the Treasury Department made the first payment (on July 15) of the expanded Child Tax Credit worth up to $300 a month per child and newly available to many of the lowest-income children, food insufficiency among adults with children fell one-fourth.[10]

One major credit rating agency highlighted rising consumer credit scores and declines in delinquent debt in 2020 and 2021 as signs of “the overwhelming success of the fiscal support packages” in the face of large job losses.[11]

Although income from unemployment benefits and EIPs lowered poverty by more than one-third for all racial and ethnic groups, the effects of this decline were greatest, unsurprisingly, in the groups that experienced the highest poverty rates prior to the pandemic. In 2020, unemployment benefits and EIPs lifted more than 8 percent of Black and Latino people above the poverty line, compared to just under 4 percent of white people. Similarly, from late December 2020 to December 2021, the share of individuals who said their household didn’t have enough to eat fell 7.8 percentage points for Black adults (from 24.5 percent to 16.7 percent) and 6.0 percentage points for Hispanic adults (from 21.3 percent to 15.3 percent), compared with 3.1 percentage points for white non-Hispanic adults (from 10.1 percent to 7.0 percent).

Economic Impact Payments

To provide income support and shore up overall consumer demand, relief legislation in 2020 and 2021 provided three rounds of EIPs to most households, ranging from $600 to $1,400 per adult and $500 to $1,400 per child (or other dependent, in the third round). In total, the IRS issued over 480 million EIPs, with each round reaching 146 to 175 million households.[12] The first two rounds alone lifted 11.7 million people above the poverty line in 2020, including 3.2 million children, according to the Supplemental Poverty Measure.[13]

The EIPs’ success in reaching those who needed help partly reflected design and implementation improvements compared to similar stimulus payments in 2008. The earlier payments went only to individuals who had filed tax returns, and only individuals with sufficient tax liability received the full amount. The EIPs were the first time the IRS provided direct cash payments to households with no minimum earnings threshold or tax filing requirement, so people with the lowest incomes were eligible for the full rebate amount. And, unlike in 2008, the Treasury Department was able to deliver benefits automatically to recipients of Social Security, Supplemental Security Income, railroad retirement, and certain veterans’ benefits, rather than forcing them to file tax returns that were otherwise unnecessary. For individuals who did not file a return but were not eligible for automatic payment of EIPs, the IRS’s “Non-Filer” tool provided an imperfect but simplified online form. The IRS estimates that around 8 million people claimed EIPs using the Non-Filer tool.[14]

Each round of relief legislation expanded eligibility to certain groups previously left out. For instance, the March 2020 CARES Act denied the EIPs to an estimated 15 million otherwise-eligible people — including around 4 million children who are U.S. citizens — if any adult listed on the household’s tax return lacked a Social Security number (SSN)[15] and to tens of millions of dependents over age 16. Relief legislation enacted in December 2020, however, included all adults with SSNs and their children with SSNs, and the 2021 American Rescue Plan further expanded EIP eligibility to include any child in a household who has an SSN, even if neither parent does. The Rescue Plan also expanded eligibility to all dependents who were left out of the first two rounds of payments, including about 5 million 17- and 18-year-olds, nearly 4 million college students aged 19 to 23, about 400,000 children aged 19 and older with disabilities, and more than 5 million other adult relatives (such as elderly parents) who have little income and are claimed as tax dependents by their children or other relatives.[16]

There will be opportunities for improvement if policymakers issue stimulus payments in a future crisis. For instance, they could improve outreach by leveraging state agencies that administer SNAP and Medicaid, which are uniquely placed to use existing contact information to alert eligible people about payments and connect them with sign-up mechanisms or even provide payments directly. The policy is also “dialable,” both in the overall level of payments it provides (to reflect economic conditions) and the degree to which it includes households that previously had higher income.

Unemployment Insurance

As the economy was losing more than 20 million jobs and $1.2 trillion in work-based compensation in early 2020, [17] Congress enacted the most ambitious temporary expansion of unemployment benefits in U.S. history. This was necessary in part because of profound weakness in the permanent unemployment insurance (UI) system. The new federal initiatives had three major elements:

  • Pandemic Unemployment Assistance (PUA), which extended unemployment benefits to large segments of the workforce who would have been ineligible for any UI benefits at all under the standard program. These included certain low-paid workers and self-employed workers and independent contractors in the so-called “gig” economy.
  • Federal Pandemic Unemployment Compensation (FPUC), which increased weekly benefit amounts (first by $600 and subsequently by $300). Regular state UI benefits replace only about 40 percent of prior wages on average, leaving many workers — especially low-paid workers — with very low benefits.
  • Pandemic Emergency Unemployment Compensation (PEUC), which provided extra weeks of benefits to people who had exhausted their regular state UI benefits and needed more time to find work.

These expansions were enormously successful in stabilizing families’ finances, protecting lives by allowing those who should stay home from work given the pandemic risk to do so, and reviving the economy. Before the federal pandemic programs terminated in early September 2021, three-fourths of unemployment claims paid came from PUA or PEUC rather than regular state benefits.[18] More than 1 out of every 4 workers relied on unemployment benefits at some point during the first year of the pandemic, according to a Century Foundation analysis.[19]

Pandemic unemployment programs reduced the number of COVID deaths by about 27,000 between April and December 2020 by enabling workers to avoid on-the-job infection, according to the Federal Reserve Bank of Atlanta.[20] Unemployment programs as a whole protected 5.5 million people from falling into poverty in 2020, with an especially notable poverty-reducing impact for people of color.[21] Also, CBO and other analysts have highlighted the contribution of unemployment benefits to increasing GDP.[22] And an analysis from JPMorgan Chase concluded that the unemployment expansion “has not only helped unemployed households to smooth consumption but also helped to stabilize aggregate demand,” noting large differences in spending levels between unemployed workers who received unemployment benefits in a timely way and those whose benefits were delayed.[23]

Workers of color are disproportionately excluded from regular unemployment benefits because they are more likely to work in low-wage or part-time jobs — positions that too often mean workers don’t meet state eligibility requirements — or work in independent contractor positions, which are excluded entirely from the regular UI system. And workers of color are more likely to live in states with the most limited access to UI benefits.

Women also face barriers to UI coverage because they disproportionately work in low-wage and part-time jobs and are more likely to have to leave jobs for family reasons, reasons that often exclude workers from jobless benefit eligibility.

The impact of the temporary unemployment expansions can be seen Georgia. A Bloomberg News investigation found that 53 percent of applications by Black workers in Georgia were denied regular UI benefits in 2020, compared to 42 percent for white workers. It also found that, compared to white workers, Black workers disproportionately benefited from the temporary PUA program designed to reduce such UI coverage gaps.[24]

The unemployment insurance expansions were not without challenges. There were frequent delays in delivering benefits, in part due to lack of investment in technology modernization prior to the crisis, which left states unprepared for the large volume of claims. And some state UI systems were oriented toward restricting rather than facilitating access to benefits, which may have led to continued racial disparities even with improved UI coverage. Program administrators needed time to learn how to block sophisticated fraud schemes in the PUA program, and in the interim, improper payments were a severe problem. A break in FPUC benefits between the program’s expiration in August 2020 and its resumption at the end of the year slowed the economic recovery and led to increased hardship, as people out of work struggled to make ends meet while receiving low benefits. And after nearly half of the states ended all pandemic unemployment benefits prematurely in June 2021, average UI benefits for workers in those states fell by $278 per week, while their earnings only rose by $14 per week. [25]

Even with these challenges, the pandemic unemployment expansions helped tens of millions of people, reduced hardship, and helped stabilize the economy. The stark difference between what they accomplished and what the regular UI program could have achieved by itself underscores the need for permanent changes to a weak UI system.

Child Tax Credit

The American Rescue Plan included a one-year expansion of the Child Tax Credit that increased the maximum credit amount (to $3,600 for children under age 6 and $3,000 for children aged 6 to 17), made the full credit available to children in families with low or no earnings in the year (often called making it “fully refundable”), allowed families to claim their 17-year-old children for the first time, and delivered the credit via advance monthly payments rather that solely as a lump sum at tax time.[26] The Treasury Department issued monthly Child Tax Credit payments to over 61 million children in December 2021.[27] Also, the IRS established an online portal that people who had not filed a return in either of the prior two years could use to sign up for the monthly credit.

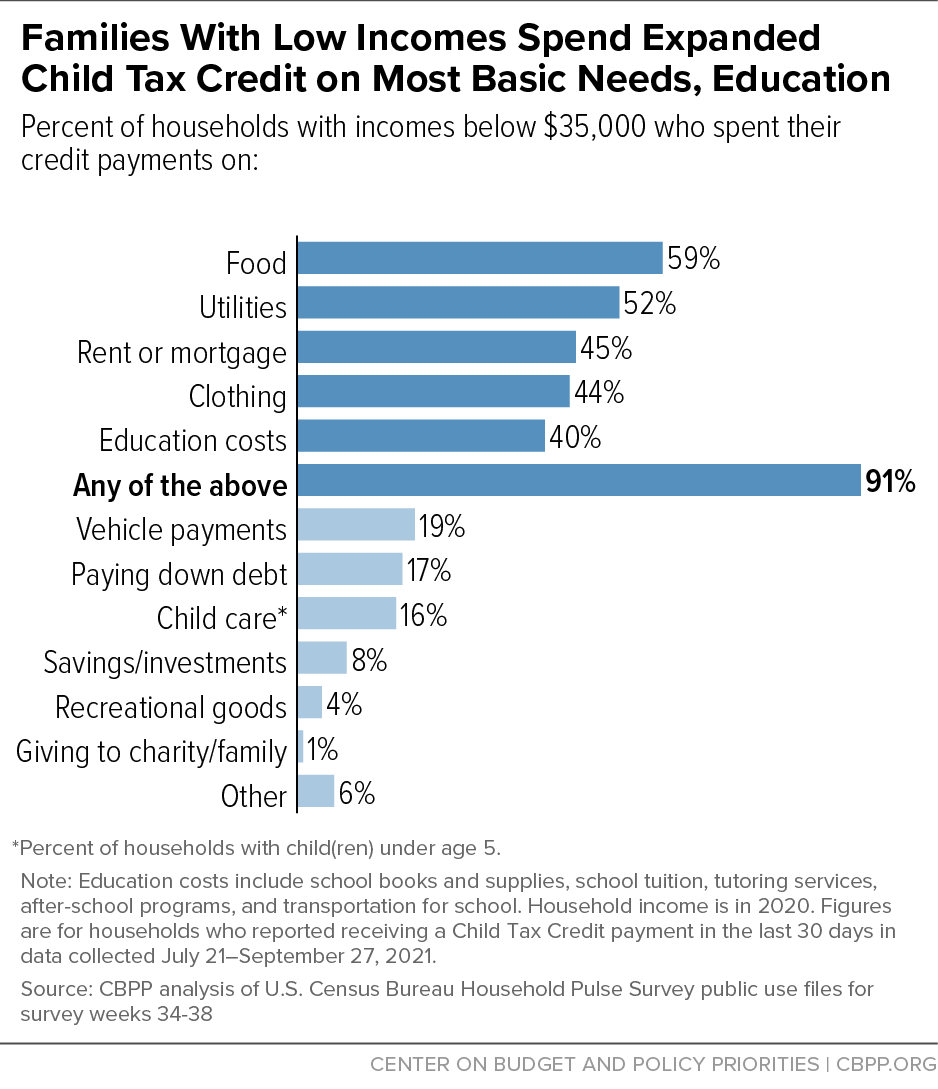
The credit sharply reduced child poverty. In December 2021, by which time most families had received half the credit through advance monthly payments, the payments kept an estimated 3.7 million children out of poverty (using a monthly poverty measure), a 29 percent reduction that was reversed when the credit expired the following month.[28] The vast majority of families with low incomes spent their payments on necessities — food, housing, clothing, utilities — and education, data from the Census Bureau’s Household Pulse Survey show.[29] (See Figure 2.) Reported food insufficiency dropped significantly after the first round of monthly payments, according to Pulse data. There is no evidence the payments negatively affected parental employment during 2021.[30]

Making the credit fully refundable also reduced racial income disparities. Prior to the Rescue Plan, roughly 27 million children received less than the full credit or no credit at all because their families’ incomes were too low. This included roughly half of Black and Latino children (compared to about one-fifth of white children) and half of children in rural areas.[31] The fully refundable credit made all of these previously omitted families eligible.

Beyond reducing immediate hardship, the Child Tax Credit expansions constitute a high-return investment in children’s futures. Poverty and its attendant hardships shortchange children for decades, research shows.[32] Studies also find that additional family income improves outcomes for children in areas including education, earnings in adulthood, and health, which can yield benefits over the course of their lives that also benefit the nation as a whole.[33]

Health Coverage

In the early days of COVID-19, several independent analyses projected that tens of millions of people would lose employer-based coverage and 2.9 to 8.5 million would become uninsured.[34] Such losses would have created especially severe risks in a pandemic, as uninsured adults are much more likely to delay or forgo needed medical care.[35] Largely due to federal relief legislation, however, coverage has remained mostly stable since the pandemic began.[36]

Beginning in March 2020, states have received an increase in federal Medicaid funding if they maintain continuous coverage for Medicaid enrollees, rather than conducting annual benefit redeterminations as is normally required for most enrollees. This largely eliminated coverage losses due to administrative “churn” (that is, due to individuals’ inability to navigate the administrative requirements or glitches in state processes). It also allowed people to maintain Medicaid coverage who otherwise would have become ineligible due to a change in their income, age, or status, such as a pregnant woman losing coverage shortly after giving birth.

All states have participated. As a result, Medicaid and Children’s Health Insurance Program (CHIP) enrollment grew by 12 million from March 2020 to July 2021, reaching a record 83.6 million.[37] The continuous coverage provision likely played a particular role in advancing racial equity, as Black and Latino people are disproportionately enrolled in Medicaid and Latino people experience particularly frequent gaps in Medicaid coverage.[38]

The American Rescue Plan temporarily increased the value of premium tax credits and expanded eligibility in the ACA marketplaces, leading to a 19 percentage point increase in the number of uninsured people eligible for zero-premium plans.[39] As marketplace coverage became more affordable, the Administration opened a six-month pandemic-related special enrollment period in 2021 and substantially increased funding for outreach and consumer assistance, resulting in 2.8 million people signing up for coverage during the special enrollment period.[40]

The 2022 open enrollment period saw even more enrollment gains, reflecting the continuation of the Rescue Plan premium tax credit increases and further enhanced outreach and consumer assistance. A record 14.5 million people selected marketplace plans, up from 12 million in 2021 and 11.4 million in 2020. For marketplace enrollees who used HealthCare.gov during the 2022 open enrollment period, average monthly premiums fell by 23 percent as compared to premiums charged during the 2021 open enrollment period before the Rescue Plan reductions.[41]

Largely due to these Medicaid and ACA marketplace provisions, the uninsured rate did not increase in 2020 or 2021 (with data going through the third quarter of 2021), and preliminary data suggests it may even be lower now than before the pandemic. In the third quarter of 2021, an estimated 29.0 million people were uninsured, compared to 31.6 million in 2020 and 33.2 million in 2019.[42] The number of people with employer-based coverage fell by about 2 to 3 million in 2020, a smaller decline than in the number of jobs, largely because job losses were concentrated in industries with low rates of employer-based coverage. And the losses in employer-based coverage were more than offset by coverage gains in Medicaid and the ACA marketplaces.[43]

Beyond keeping people insured, federal pandemic relief measures also supported the public health response to the pandemic. Relief legislation and guidance expanded access to coverage for testing, vaccines, and treatment of COVID-19. Emergency authorities available during the public health emergency enabled states to swiftly improve access to Medicaid home- and community-based services (HCBS), helping some people avoid or exit group settings (like nursing homes) where the virus was spreading quickly. States also expanded home-delivered meals and telehealth and shored up HCBS providers by increasing payment rates and making retainer payments.[44] The American Rescue Plan made additional federal funding available for Medicaid HCBS that states could invest in ongoing pandemic-related needs, including workforce supports, telehealth, reducing waiting lists, and expanding housing-related supports that many people need in order to live in the community.[45]

In addition, the CARES Act created a Provider Relief Fund to help hospitals and other health care providers remain financially stable — both during the pandemic’s early months, when they were performing fewer high-revenue procedures, and later, as COVID surges filled hospital beds and created staffing challenges. A portion of these funds were allocated specifically for Medicaid providers and providers that serve a disproportionate number of uninsured patients.[46]

The Families First Coronavirus Response Act, enacted in March 2020 before the CARES Act, included the first national provision for paid sick days and paid caregiving leave. This provision responded to the urgent need to enable workers who were sick or quarantined due to COVID-19 to stay home, as well as to enable caregiving for COVID-affected family members or children who were at home due to closed schools or child care.

The law was limited in a number of ways, most notably excluding workers at companies with more than 500 workers.[47] Even so, the temporary program helped over 750,000 firms pay their workers when they had to miss work for COVID-related reasons, according to the Government Accountability Office.[48] It also prevented 15,000 COVID infections per day, researchers found, even with limited coverage and at a time when the virus was far less infectious.[49]

Food Assistance

Early in the pandemic, hunger was poised to soar. Calls to “211” for help with food in the first two months of the pandemic were over four times greater than earlier in 2020.[50] Use of food banks also increased.[51] In the Great Recession, the share of households that were food insecure rose from 11.1 percent in 2007 to 14.7 percent in 2009, according to Agriculture Department estimates. Yet because of the robust relief effort during the pandemic, the typical annual measure of food insecurity in 2020 was unchanged from the 2019 level of 10.5 percent. Food insecurity under the annual measure did rise for households with children and for households headed by Black adults, and other Census data show higher levels of food insufficiency (a different measure of food hardship) during the pandemic than what the annual data show.[52] But it remains clear that food insecurity did not surge during the pandemic the way it did during the Great Recession.

Supplemental Nutrition Assistance Program (SNAP) eligibility and participation expand automatically in response to job and income losses, and policy changes enacted during the pandemic boosted caseloads modestly as well. The number of SNAP participants grew from 37 million in an average month just before the pandemic to 43 million in June 2020. (The total number of individuals helped by SNAP during the pandemic is likely substantially higher as households came on and off the program over the course of the crisis.) The caseload has been declining since the summer of 2020, but in November 2021 (the most recent data available) was still about 12 percent above the February 2020 level.

Beginning in March 2020, Congress made numerous policy changes that took advantage of SNAP’s ability to deliver benefits quickly by adding benefits to households’ EBT cards. These changes included giving states flexibility to provide emergency SNAP benefit supplements, which all states did;[53] boosting SNAP maximum benefits by 15 percent from January through September 2021; and creating a Pandemic-EBT program to provide benefits (via the SNAP EBT cards) to households with children who miss school meals due to the pandemic. Congress also temporarily suspended SNAP’s three-month time limit, which takes benefits away from many adults under age 50 without children in the home when they don’t have a job more than 20 hours a week, and loosened the general rule that makes many college students ineligible for SNAP. Waivers of certain process requirements in SNAP (as well as in WIC and the school meals programs) enabled administrators to deliver benefits promptly and safely even as caseloads surged and eligibility staff worked from home.[54]

Average SNAP benefits across all households rose from about $120 per person per month before the pandemic to about $230 in the summer and fall of 2021. Since then, SNAP pandemic relief has fallen as one benefit increase expired and states have started to pull back on emergency supplements.[55]

Pandemic-EBT benefits, available to low-income school-age children who missed school meals as well as certain younger children, enabled families to prepare food at home to replace the meals missed in school or child care. These benefits appear to have reached a substantial share of eligible children.[56] Participants in most states received about $114 per child per month for the spring of 2020.

In addition, the American Rescue Plan increased the fruit and vegetable benefits provided through WIC, which reaches 4.7 million low-income pregnant and postpartum individuals and children under age 5. The increase more than doubled the fruit and vegetable benefit for children. The increase is even larger for adults, who now receive a larger benefit each month for fruit and vegetables than the value of their total benefit before the pandemic.[57]

Early evidence shows the real-time impacts of these relief measures. For example, researchers found that receipt of P-EBT benefits in 2021 reduced the share of SNAP households where children experienced very low food security by 17 percent and reduced food insufficiency among SNAP households by 28 percent.[58] The January 2021 increase in the SNAP maximum benefit also coincided with a large drop in the number of adults reporting that their household didn’t get enough to eat in the past seven days, according to Pulse data. Although it is not always possible to separate the effect of food assistance from other aid, expansions in SNAP and WIC played a key part in averting increased hunger during an unprecedented crisis.

Housing Assistance

The U.S. was already facing a crisis of homelessness and housing instability when the pandemic hit. In January 2020, 30 states saw a rise in homelessness from one year earlier; for the first time since we began tracking this data, more single individuals[59] experiencing homelessness were unsheltered than sheltered; and there were more people in families living unsheltered than the year prior.[60] The number of people at risk of homelessness was high, increasing the risk that homelessness could surge just when it presented the greatest health risks. Nearly 7.8 million households had worst case housing needs in 2019, largely driven by severe rent burdens.[61]

The onset of the pandemic worsened the difficulties for many people experiencing homelessness, with people in congregate care facilities as well as unsheltered arrangements facing increasing risk of infection. Also, shelters needed to reconfigure and downsize to comply with public health guidance and meet their staffing challenges.[62]

To address the unprecedented hardship for people experiencing homelessness and housing instability during the pandemic, Congress made substantial investments — including $46.6 billion for the new Emergency Rental Assistance (ERA) Program, $5 billion for 70,000 Emergency Housing Vouchers (EHV), $5 billion for the HOME Investments Partnerships program, and $4 billion for the Emergency Solutions Grants-COVID (ESG-CV) program. The measures are unprecedented in scope and will have a lasting positive impact by averting hardships that can have long-term negative consequences.

Over 3.2 million households received emergency rental assistance from January to November 2021, according to Treasury Department data. This assistance is likely a key reason that evictions didn’t surge after the end of the national eviction moratorium in August 2021.[63] The number of evictions remains below pre-pandemic levels based on the latest available data (from December 2021), though landlords have filed a growing number of cases since the moratorium ended.[64] Based on data from the first allocation of ERA funds (called ERA-1), these programs are providing well-targeted assistance: 88 percent of the households served through September 2021 (excluding households served by tribes) have incomes at or below 50 percent of the area median.

While EHV is still in its early stages of implementation, it has issued more than 24,000 vouchers to households experiencing or at risk of homelessness and more than 11,000 units have already been leased. [65] Voucher issuances and leases are increasing at a rapid pace as programs address early implementation challenges. ESG-CV has helped communities respond to the needs of people living unsheltered and in shelters, and HOME will help communities build permanent and supportive housing.

Housing instability remains an enormous challenge, however. While rental hardship is below the January 2021 peak, families face continued challenges securing and affording stable housing and the burden is outsized for people of color, children, and seniors, Pulse data show. Data collected between December 29, 2021, and January 10, 2022, show that over 11.5 million adult renters were behind on rent, nearly half of whom reported that they were either very or somewhat likely to face eviction in the next two months.[66]

Emergency Cash Assistance

Expanded unemployment benefits played a key role in reducing pandemic hardship, but it focused on workers who lost their jobs. One group it left out was families receiving cash benefits from Temporary Assistance for Needy Families (TANF). The American Rescue Plan provided $1 billion to state TANF agencies through the Pandemic Emergency Assistance Fund, which they could provide to TANF families and other families with very low incomes to meet additional needs resulting from the pandemic. All states except Idaho opted to take the funds.

TANF’s low monthly payments made it nearly impossible for families to cover the additional expenses resulting from the pandemic. In the median state, the monthly TANF benefit for a family of three is just $498, or 27 percent of the federal poverty line. Like most other families with children, TANF participants faced rising food prices and additional expenses related to schooling and caring for their children at home, along with new expenses for cleaning supplies and masks to protect them from getting the virus. But because TANF benefits are fixed, their incomes did not increase to help offset their increased expenses. Also, many families use TANF only temporarily when parents are between jobs, but some parents faced longer periods of joblessness during the pandemic, so the inadequacy of TANF benefits was even more problematic for them.

Most states have used or plan to use the funds to provide a one-time payment to supplement families’ regular monthly cash benefits. A few states also provided payments to SNAP families with no income.

State and Local Relief

Federal aid to state and local governments, territories, and tribal governments is important during any economic downturn. Their revenues typically fall during recessions since people lose income and consume less, and their costs typically rise since more people need public assistance. Unlike the federal government, states and localities must balance their budgets every year; without federal aid during recessions, they must cut services or raise revenue (or both), which can weaken the economy further. In its immediate budgetary effects, the pandemic hit like other downturns, causing state, local, tribal, and territory revenues to collapse and costs to rise sharply. Without federal aid the pandemic would have forced deep cuts in state and local services at a time when increased supports — including public health measures to respond to the pandemic — were needed.

The CARES Act included $150 billion in aid for states, local governments with populations over 500,000, tribal governments, and U.S. Territories, which they could use only for new costs incurred due to the public health emergency through the end of 2020 and not to make up for revenue losses.[67] The Families First legislation increased the federal share of Medicaid funding, a crucial step given the rapid surge in people needing health coverage; the added Medicaid dollars strengthened states’ overall fiscal picture while protecting coverage for millions of people.

These funds helped meet increased needs but left many state, territorial, tribal, and local governments unable to meet surging challenges. Even with CARES Act aid, the number of state and local employees fell at a time of increased need for public services, dropping by 1.2 million or 6 percent between February and December 2020. Medium-sized and small localities, left out entirely of the CARES Act, continued to struggle.

The American Rescue Plan provided $350 billion in more flexible aid to help states, local governments of all sizes, tribal governments, and U.S. Territories respond to the pandemic. The law’s State and Local Fiscal Recovery Funds (SLFRF) provided funds that governments could use to make up for pandemic-induced revenue losses, providing a hedge against expected shortfalls and helping them rehire workers and reverse spending cuts from earlier in the pandemic. The Rescue Plan also provided funds for responding to the virus and its negative economic impacts on people and businesses, offering premium pay to essential workers, and investing in needed broadband, water, and sewer infrastructure projects.

The Rescue Plan also provided funds for responding to the virus and its negative economic impacts on people and businesses, offering premium pay to essential workers, and investing in needed broadband, water, and sewer infrastructure projects. Under Treasury guidance, governments have until the end of 2024 to obligate the funds and until the end of 2026 to finish spending them. 

Treasury Department guidance has strongly encouraged participants to use the funds to address racial and economic inequities that predated the pandemic and then made the crisis worse, as well as to address pandemic-induced problems that may take years to unravel, like lost learning time for children and the increased prevalence of mental illnesses.

Most states have acted quickly to use the federal funds. As of January 2022, some 43 states and the District of Columbia had appropriated $112 billion (72 percent) of the $155 billion allocated to states so far. And since December 2020, states and localities have hired 470,000 workers. Plus, many states now meeting in legislative sessions are developing plans for using the remaining funds. Up-to-date information about SLFRF uses by local, tribal, and territorial governments is not yet available, but reports by the most populous cities and counties document that even as early as July 2021 they’d already allocated more than half of the funds then available, with the most common use being making up for lost revenues.[68]

Over the last year, state revenue collections have rebounded faster than expected in most states, largely because of the rapid economic recovery fueled by the Rescue Plan and earlier federal relief packages. As a result, while replacing lost revenues is the single biggest purpose for which states have used the SLFRF, they’ve used it less for this purpose than seemed likely in early 2021.

Nearly one-quarter of the state funding has gone to offset pandemic-induced revenue losses, including funds used to hire back school workers and others laid off earlier in the pandemic. Nearly another quarter has gone to health care and human services for people affected by the pandemic. For example, Utah appropriated funds for a system to provide booster shots, California revamped its youth mental health system to provide better care to more children, and Virginia raised wages for behavioral health workers. Another quarter has gone to help affected businesses and for economic development and infrastructure. For example, Wisconsin spent funds supporting businesses in communities most affected by the downturn and Delaware, Colorado, and other states invested in expanding broadband, consistent with a goal of the SLFRF to seed a stronger recovery. Most of the rest has gone to shore up state unemployment trust funds, which were hit hard after the pandemic.[69]

Unfortunately, some states have used the funds in ways inconsistent with the law’s spirit. Alabama, for example, devoted nearly one-fifth of its funds to building new prisons. And many states are considering tax cuts. The SLFRF expressly forbids using the funds for tax cuts,[70] but states can use their own funds for such purposes. While the SLFRF may have indirectly helped make these proposals more affordable, many states likely would have considered tax cuts this year without the SLFRF funds, for reasons that vary by state; policymakers in some states were trying to dismantle or sharply reduce income taxes even before the pandemic.[71] Some states are considering permanent income tax cuts — a long-standing goal of some conservative policymakers and interest groups — even though the SLFRF funds are temporary. (Conservatives pursued tax cuts after the Great Recession as well, though the federal government provided much less state fiscal aid then.)[72] Other states are considering one-time tax cuts aimed at reducing household costs.

Localities, territories, and tribal governments have made productive use of the SLFRF. For example, Pittsburgh used part of the funds to save 600 jobs slated for elimination and committed to providing free Wi-Fi in community centers, among other uses.[73] St. Louis set aside funds for a mobile vaccination effort, a jobs program for youth from low-income families that had been especially affected by the pandemic, and efforts to help house people experiencing homelessness and reduce evictions.[74] Tribal nations are especially vulnerable to COVID-19’s health risks and the pandemic drastically reduced the revenues of tribal governments that rely on tourism and casinos,[75] but the SLFRF has transformed tribal governments’ ability to respond to the pandemic and help tribal members recover. The Navajo Nation, for example, is using SLFRF funds for broadband and water projects, support for tribal businesses, care for COVID-19 patients, and burial assistance for the families of COVID victims, among other uses.[76] U.S. Territories also face especially difficult conditions in fighting and recovering from the virus; Puerto Rico has already allocated some 83 percent of its SLFRF for initiatives such as COVID-19 tracking efforts, support for affected businesses, premium pay for essential workers, and mental health programs.[77]

The last two economic crises provide important lessons for the design of state and local fiscal recovery funds in future downturns. Federal aid to states and territories in response to the Great Recession was too small (covering only one-quarter of state budget shortfalls) and ended too soon, and local and tribal governments received no federal aid. As a result, layoffs and deep, recession-induced spending cuts by states and other governments weakened the recovery. In the current crisis, federal aid to states, localities, territories, and tribal governments was far more robust and, in the SLFRF, gave them more time to use it. This was particularly appropriate since the pandemic produced a highly uncertain and still-unfolding economic and fiscal situation, and many of its harmful impacts may last longer than the effects of a more typical recession.

In a future crisis, policymakers should avoid the mistakes of the Great Recession’s fiscal aid response and err on the side of ensuring that states and other governments have enough aid to meet the needs of residents and businesses. Policymakers can consider ways to link the amount of aid and its duration to economic conditions, though doing so presents design challenges and it is important not to under-shoot what’s needed. Policymakers should require states and other governments to spend sizeable portions of the aid in ways that particularly help low-income people, communities of color, and others especially likely to be harmed by an economic crisis. They also can consider additional ways to limit the use of funds, again recognizing the challenges in striking a reasonable balance between allowing states and other governments flexibility and ensuring funds aren’t used in problematic ways. Finally, policymakers should continue to support the fiscal health of tribal governments during future recessions; the first-ever fiscal aid provided during this downturn was a historic advance and sets an important, positive precedent.

Macroeconomic Impacts

In mid-March 2020, the number of new claims for unemployment insurance surged by a record 3 million as COVID-19 spread, beginning the deepest recession since World War II. Employers shed 22 million jobs in March and April and the share of the population with a job fell by 10 percentage points. Policymakers’ rapid and robust response was instrumental in turning the economy around.

Federal relief measures in the U.S. were larger as a share of GDP than in most European countries and Japan, and the U.S. has gotten back to pre-pandemic levels of economic activity faster.[78] CBO estimates that without the relief measures enacted in March and April 2020,[79] GDP would have been 12 percent lower than in its pre-pandemic projection in 2020 and 9 percent lower in 2021.[80] With those relief packages and subsequent legislation, the actual gaps were far smaller: 5.8 percent in 2020 and 1.1 percent in 2021. The jobs recovery was also faster than anticipated;[81] in January 2022 the unemployment rate was 4.0 percent, close to the 3.5 percent low reached just before the pandemic.

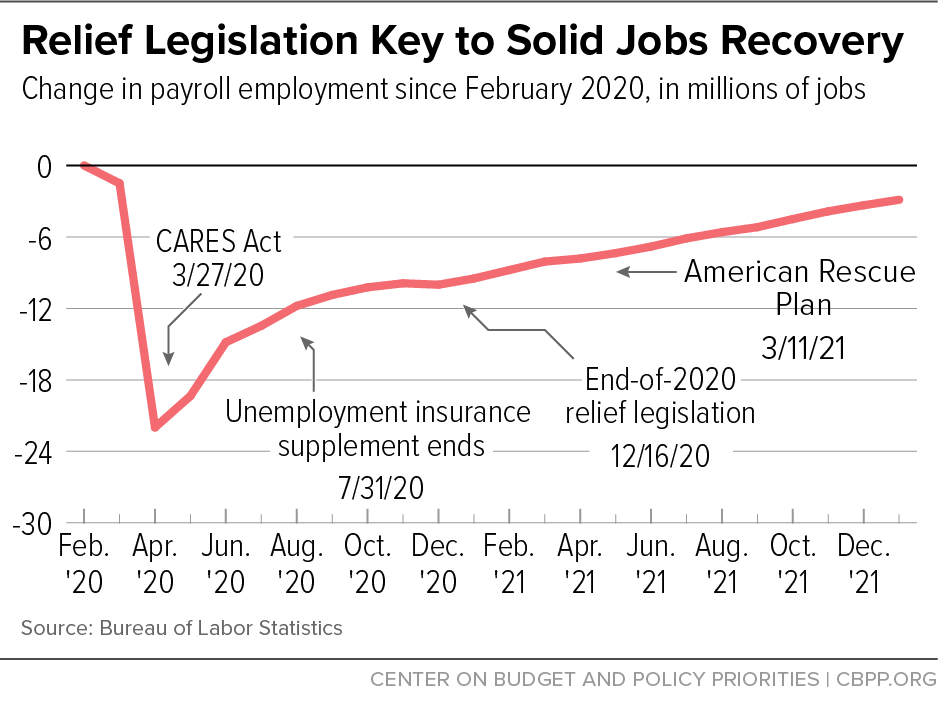
The path of the recovery in 2020 and 2021 largely tracked the policy response, though shifts in the virus and in restrictions on economic activity also had an impact. Following enactment of the CARES Act in March 2020, the economy grew strongly[82] and by mid-summer, the jobs deficit had been cut in half. However, around the time the federal supplement to weekly unemployment benefits expired at the end of July — and COVID cases then rose substantially from mid-September through the end of the year — job growth slowed, and remained slow until the end of 2020, when Congress passed another major relief package. With that package and the American Rescue Plan in March 2021, as well as progress against the virus, job growth picked up, averaging 555,000 per month in 2021. (See Figure 3.)

A new Moody’s Analytics analysis finds that in the absence of relief measures, “the economy would have succumbed to a double-dip recession” and unemployment, particularly among low-paid workers, would be significantly higher.[83] Indeed, the analysis finds that without the Rescue Plan, but assuming the other relief packages were enacted, the U.S. would have “come close to suffering a double-digit recession in spring 2021.”

The pattern of job loss and recovery has varied widely across industries, occupations, and demographic groups. A CBO analysis found that just 11 out of 264 private industries accounted for about half of the job losses in the downturn and about half of the rebound in employment over the next 12 months, with restaurants and other food services accounting for the largest decline and rebound.[84] Unlike in the Great Recession and subsequent slow recovery, when men incurred a disproportionate number of job losses, women experienced disproportionate losses in the pandemic recession. Women were more likely to work in hard-hit industries, and many mothers of young children had child care responsibilities that kept them from work.

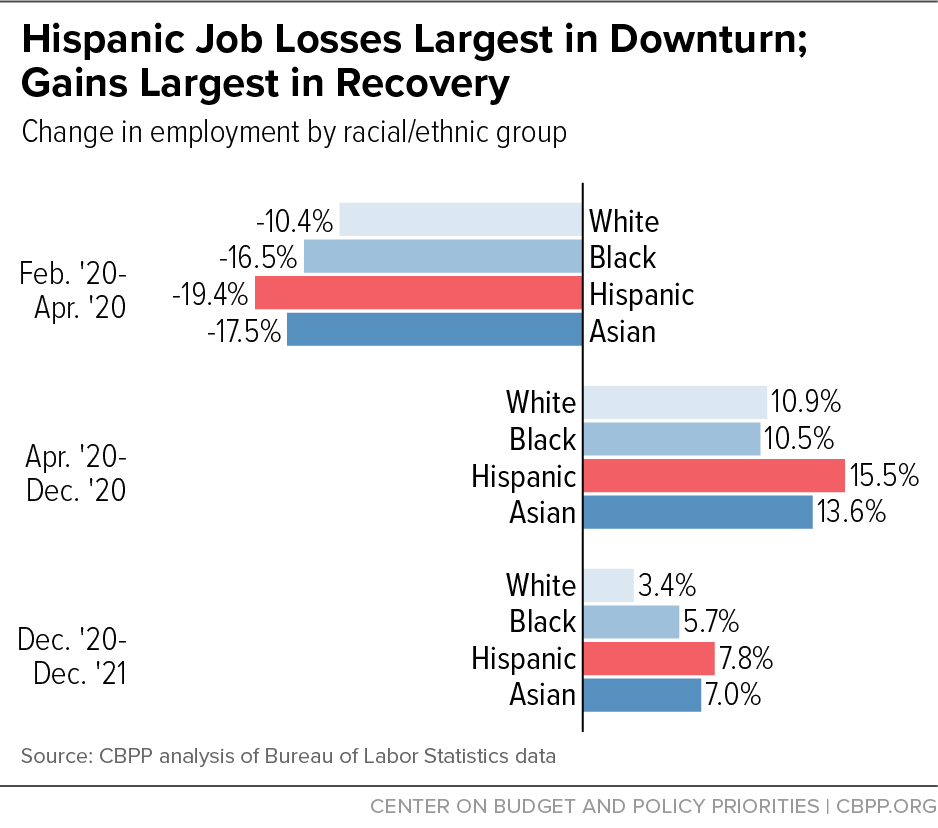
Hispanic workers had the largest proportional job losses and subsequent gains among major racial and ethnic groups, partly because they constituted a higher share of workers in affected industries, such as restaurants and food services. (See Figure 4.) In general, women, workers of color, workers without a bachelor’s degree, and those who were foreign-born worked in the industries and occupations most affected by the pandemic. Thus, they had greater job losses in the recession than workers who were white, native born, and four-year college graduates but also substantial bounce-backs in the robust, relief-fueled recovery.[85]

While unemployment has fallen sharply, the labor force participation rate — the share of people working or actively looking for work — is still below pre-pandemic levels. This partly reflects baby boomers reaching retirement age and a wave of early retirements (some of which may be temporary), but an elevated number of younger people are also out of the labor force currently. More research is needed to get a firm grip on the “Great Resignation” phenomenon, in which workers appear to be staying out of jobs despite plentiful job opportunities.

The strong recovery and tight labor markets have produced rapid nominal wage growth over the past two years, especially for the lowest-paid workers, which has offset some of the effects of recent inflation. For workers in the bottom quarter of earnings, in fact, wage increases appear to have modestly exceeded inflation over this period. [86]

However, inflation is high and is causing strain on families. Most forecasters expect it to come down over the course of 2022, but how fast and by how much remain uncertain. The pandemic economy has been like no other, with fluctuations in the demand and supply of goods, services, and labor. Blaming inflation solely on the demand created by pandemic relief programs, which supported struggling families and unemployed workers and supported spending that promoted a robust recovery, is overly simplistic. Inflation emerged for other reasons as well, including supply constraints that created shortages that in turn led to price increases. Those constraints often stem from the health crisis itself, which hampered production of some key goods.

Overall consumption has returned to the level that would have been predicted prior to the pandemic. However, its composition is significantly different than what would have been predicted. Demand is down for services and up for goods at a time when, for a variety of reasons, the supply of various goods cannot adjust fast enough to keep up with demand.

The Federal Reserve has clearly indicated its intention to fight inflation, and it has the tools to do so while remaining attentive to its dual mandate from Congress to promote both stable prices and maximum employment.

It is important to consider what the state of the economy would have been over the course of the crisis — and the amount of hardship that families would have faced — if the nation hadn’t enacted robust relief measures. The new Moody’s analysis was designed to do just that, modeling the economy in the absence of relief measures and finding that without them the recovery would have been far slower and less robust, high unemployment would have been far more protracted, and as a result, hardship far worse.

Higher inflation today is preferable to a more protracted recession that left more people unable to pay their bills and more businesses shuttered, economist Paul Krugman (among others) has argued.[87] As this paper has shown, the strong federal response to the COVID-19 pandemic helped tens of millions of people get adequate food, shelter, and medical care and cover other basic household expenses during this unprecedented crisis, while also sparking a historically rapid recovery from recession.

End Notes

[1] Lennart Niermann and Ingo Pitterle, “The COVID-19 crisis: what explains cross-country differences in the pandemic’s short-term economic impact?” United Nations Department for Economic and Social Affairs, April 28, 2021, https://mpra.ub.uni-muenchen.de/109165/1/MPRA_paper_109165.pdf.

[2] H. Luke Shaefer, Testimony Before the Select Subcommittee on the Coronavirus Crisis Hearing on the Impact of Pandemic Response, September 22, 2021, https://docs.house.gov/meetings/VC/VC00/20210922/114055/HHRG-117-VC00-Wstate-ShaeferH-20210922.pdf.

[3] Bernard Yaros, Jesse Rogers, Ross Cioffi, and Mark Zandi, “Fiscal Policy in the Pandemic,” Moody’s Analytics, February 24, 2022, https://www.moodysanalytics.com/-/media/article/2022/global-fiscal-policy-in-the-pandemic.pdf.

[4] CBPP, “Policymakers Should Craft Compromise Build Back Better Package,” February 1, 2022, https://www.cbpp.org/research/poverty-and-inequality/policymakers-should-craft-compromise-build-back-better-package.

[5] Unless noted, poverty figures in this report use the Supplemental Poverty Measure (SPM). CBPP analysis of the March Current Population Survey merged with historical SPM data produced by the Columbia Center on Poverty and Social Policy. For methods used, see Danilo Trisi and Matt Saenz, “Economic Security Programs Reduce Overall Poverty, Racial and Ethnic Inequities,” CBPP, updated July 1, 2021, https://www.cbpp.org/research/poverty-and-inequality/economic-security-programs-reduce-overall-poverty-racial-and-ethnic.

[6] Figures account for all public benefits (including permanent programs such as Social Security, food assistance, rental vouchers, regular state unemployment insurance, and the Earned Income Tax Credit, as well as pandemic programs such as Economic Impact Payments and supplemental unemployment benefits and food assistance), as well as federal and state income taxes and payroll taxes. The decrease in the percentage of people in poverty (from 11.8 percent to 9.1 percent) was also the largest on record.

[7] CBPP analysis of March 2020 and 2021 Current Population Survey. Figures are based on income before benefits and taxes. The increase in the percentage of people in poverty before counting government assistance and taxes (from 22.5 percent in 2019 to 25.3 percent in 2020) was also the second largest on record, with data back to 1967.

[8] Figures refer to the number of people whose family disposable income (i.e., SPM resources) for the year is below $40,000 in inflation-adjusted 2019 dollars when government assistance and taxes are not considered but above that threshold once assistance is included and taxes are subtracted.

[9] See, for example, Patrick Cooney and H. Luke Shaefer, “Material Hardship and Mental Health Following the Covid-19 Relief Bill and American Rescue Plan Act,” University of Michigan Poverty Solutions, May 2021, http://sites.fordschool.umich.edu/poverty2021/files/2021/05/PovertySolutions-Hardship-After-COVID-19-Relief-Bill-PolicyBrief-r1.pdf; Paul R. Shafer et al., “Association of the Implementation of Child Tax Credit Advance Payments With Food Insufficiency in US Households,” JAMA Network Open, January 13, 2022, https://jamanetwork.com/journals/jamanetworkopen/fullarticle/2788110; Lauren Bauer, Krista Ruffini, and Diane Whitmore Schanzenbach, “An Update on the Effect of Pandemic-EBT on Measures of Food Hardship,” Brookings Institution Hamilton Project, September 29, 2021, https://www.hamiltonproject.org/blog/an_update_on_the_effect_of_pandemic_ebt_on_measures_of_food_hardship;
Zachary Parolin et al., “The Initial Effects of the Expanded Child Tax Credit on Material Hardship,” Columbia University Poverty and Social Policy Working Paper, September, 20, 2021, https://static1.squarespace.com/static/610831a16c95260dbd68934a/t/6148c84a76d7c27c418bcd13/1632159820347/Child-Tax-Credit-Expansion-on-Material-Hardship-CPSP-2021.pdf.

[10] For childless adults, food insufficiency also declined after the EIP payments (which they received) but not after the start of the monthly Child Tax Credit payments (which they did not receive), consistent with the conclusion that these and other relief policies eased hardship.

[11] Stefani Wendel, “State of Credit 2021: Rise in Scores Despite Pandemic Challenges,” Experian, September 7, 2021, http://www.experian.com/blogs/insights/2021/09/state-of-credit-2021/.

[12] Internal Revenue Service, “All third Economic Impact Payments issued,” January 26, 2022, https://www.irs.gov/newsroom/all-third-economic-impact-payments-issued; Internal Revenue Service, “SOI Tax Stats – Coronavirus Aid, Relief, and Economic Security Act (CARES Act) Statistics,” June 28, 2021, https://www.irs.gov/statistics/soi-tax-stats-coronavirus-aid-relief-and-economic-security-act-cares-act-statistics. These figures do not include households that did not receive payments as an “advance” but who received the amount as a credit on a tax return.

[13] Kalee Burns, Danielle Wilson, and Liana E. Fox, “Two Rounds of Stimulus Payments Lifted 11.7 Million People Out of Poverty During the Pandemic in 2020,” U.S. Census Bureau, September 14, 2021, https://www.census.gov/library/stories/2021/09/who-was-lifted-out-of-poverty-by-stimulus-payments.html.

[14] Written Testimony of Charles P. Rettig, Commissioner, Internal Revenue Service, Before the Senate Finance Committee on the Filing Season and COVID-19 Recovery, April 13, 2021, https://www.irs.gov/newsroom/written-testimony-of-charles-p-rettig-commissioner-internal-revenue-service-before-the-senate-finance-committee-on-the-filing-season-and-covid-19-recovery.

[15] These estimates reflect Pew Research Center estimates of the number of people and children under age 18 living in households containing people without a lawful immigration status (20.2 million), adjusted using data from the March 2019 Current Population Survey to match EIP eligibility criteria. See Jeffrey S. Passel and D’Vera Cohn, “U.S. Unauthorized Immigrant Total Dips to Lowest Level in a Decade,” Pew Research Center, November 27, 2018, https://pewrsr.ch/3aNwutB.

[16] Chuck Marr et al., “Future Stimulus Should Include Immigrants and Dependents Previously Left Out, Mandate Automatic Payments,” CBPP, May 6, 2020, https://www.cbpp.org/research/economy/future-stimulus-should-include-immigrants-and-dependents-previously-left-out.

[17] U.S. Bureau of Economic Analysis, “Effects of Selected Federal Pandemic Response Programs on Personal Income, June 2020,” July 31, 2020, effects-of-selected-federal-pandemic-response-programs-on-personal-income-june-2020.pdf (bea.gov).

[18] U.S. Department of Labor, Office of Unemployment Insurance, https://oui.doleta.gov/unemploy/claims_arch.asp.

[19] Andrew Stettner and Elizabeth Pancotti, “1 in 4 Workers Relied on Unemployment Aid During the Pandemic,” Century Foundation, March 17, 2021, https://tcf.org/content/commentary/1-in-4-workers-relied-on-unemployment-aid-during-the-pandemic/?agreed=1.

[20] Lei Fang, Jun Nie, and Zoe Xie, “The CARES Act Unemployment Insurance Program during the COVID-19 Pandemic,” Federal Reserve Bank of Atlanta, December 2020, https://www.atlantafed.org/-/media/documents/research/publications/policy-hub/2020/12/21/16-cares-act-unemployment-insurance-program-during-covid-19-pandemic.pdf.

[21] CBPP analysis of March 2021 Current Population Survey data using the SPM. Findings are similar when using the official poverty measure. Unemployment insurance protected 4.7 million people from falling below the official poverty line, according to the Census Bureau. For data by race and ethnicity, see Frances Chen and Em Shrider, “Expanded Unemployment Insurance Benefits During Pandemic Lowered Poverty Rates Across All Racial Groups,” U.S. Census Bureau, September 14, 2021, https://www.census.gov/library/stories/2021/09/did-unemployment-insurance-lower-official-poverty-rates-in-2020.html.

[22] “The Effects of Pandemic-Related Legislation on Output,” Congressional Budget Office, September 18, 2020, https://www.cbo.gov/publication/56537.

[23] Diana Farrell et al., “Consumption Effects of Unemployment Insurance during the Covid-19 Pandemic,” JPMorgan Chase, July 2020, https://www.jpmorganchase.com/institute/research/labor-markets/unemployment-insurance-covid19-pandemic.

[24] Shawn Donnan, Reade Pickert, and Madeline Campbell, “Covid Unemployment Benefits Show How Broken U.S. System Is,” Bloomberg, November 19, 2021, https://www.bloomberg.com/graphics/2021-georgia-unemployment-bias/.

[25] Kyle Coombs et al., “Early Withdrawal of Pandemic Unemployment Insurance: Effects on Earnings, Employment and Consumption, Harvard Business School Working Paper No. 22-046, August 2021, https://www.hbs.edu/faculty/Pages/item.aspx?num=61668.

[26] These larger credit amounts start to phase down to $2,000 for families with incomes above $112,500 for a head of household and $150,000 for a married couple. The $2,000 credit starts to phase down for families with incomes above $200,000 for a head of household and $400,000 for a married couple.

[27] Department of the Treasury, “By State: Advance Child Tax Credit Payments Distributed in December 2021,” December 15, 2021, https://home.treasury.gov/system/files/131/Advance-CTC-Payments-Disbursed-December-2021-by-State-12152021.pdf .

[28] Zachary Parolin, Sophie Collyer, and Megan A. Curran “Sixth Child Tax Credit Payment Kept 3.7 Million Children Out of Poverty in December,” Columbia University Center on Poverty and Social Policy, Vol. 6, No. 1, January 18, 2022, https://static1.squarespace.com/static/5743308460b5e922a25a6dc7/t/61ea068f13dbfa56bfc9be17/1642727056209/Monthly-poverty-December-2021-CPSP.pdf; Zachary Parolin et al., “Absence of Monthly Child Tax Credit Leads to 3.7 Million More Children in Poverty in January 2022,” Columbia University Center on Poverty and Social Policy, Vol. 6, No. 2, February 17, 2022, https://static1.squarespace.com/static/610831a16c95260dbd68934a/t/620ec869096c78179c7c4d3c/1645135978087/Monthly-poverty-January-CPSP-2022.pdf. Note that monthly and annual poverty-reduction calculations differ. The estimated monthly poverty impact of the expanded Child Tax Credit, for instance, does not include the lump-sum payments received at tax time, so monthly poverty reductions understate the eventual full-year effect of the credit.

[29] Claire Zippel, “9 in 10 Families With Low Incomes Are Using Child Tax Credits to Pay for Necessities, Education,” CBPP, October 21, 2021, https://www.cbpp.org/blog/9-in-10-families-with-low-incomes-are-using-child-tax-credits-to-pay-for-necessities-education.

[30] Megan A. Curran, “Research Roundup of the Expanded Child Tax Credit: The First 6 Months,” Columbia University Center on Poverty and Social Policy, Vol. 5. No. 5, December 22, 2021, https://static1.squarespace.com/static/610831a16c95260dbd68934a/t/61f946b1cb0bb75fd2ca03ad/1643726515657/Child-Tax-Credit-Research-Roundup-CPSP-2021.pdf

[31] Kris Cox et al., “If Congress Fails to Act, Monthly Child Tax Credit Payments Will Stop, Child Poverty Reductions Will Be Lost,” CBPP, updated December 3, 2021, https://www.cbpp.org/research/federal-tax/if-congress-fails-to-act-monthly-child-tax-credit-payments-will-stop-child.

[32] National Academies of Science, Engineering, and Medicine, “A Roadmap to Reducing Child Poverty,” 2019, https://www.nap.edu/catalog/25246/a-roadmap-to-reducing-child-poverty.

[33] See Arloc Sherman et al., “Recovery Proposals Adopt Proven Approaches to Reducing Poverty, Increasing Social Mobility,” CBPP, August 5, 2021, https://www.cbpp.org/research/poverty-and-inequality/recovery-proposals-adopt-proven-approaches-to-reducing-poverty; Claire Zippel and Arloc Sherman, “Bolstering Family Income Is Essential to Helping Children Emerge Successfully From the Current Crisis,” CBPP, updated February 25, 2021, https://www.cbpp.org/research/poverty-and-inequality/bolstering-family-income-is-essential-to-helping-children-emerge.

[34] Jessica Banthin and John Holahan, “Making Sense of Competing Estimates: The COVID-19 Recession’s Effects on Health Insurance Coverage,” Urban Institute, August 2020, https://www.urban.org/sites/default/files/publication/102777/making-sense-of-competing-estimates_1.pdf

[35] Jared Ortaliza et al., “How Does Cost Affect Access to Care?” Peterson-KFF Health Systems Tracker, January 14, 2022, https://www.healthsystemtracker.org/chart-collection/cost-affect-access-care/.

[36] Joel Ruhter et al., “Tracking Health Insurance Coverage in 2020-2021,” Office of the Assistant Secretary for Planning and Evaluation, U.S. Department of Health and Human Services, October 29, 2021, https://aspe.hhs.gov/reports/tracking-health-insurance-coverage.

[37] Medicaid.gov, “Monthly Medicaid & CHIP Application, Eligibility Determination, and Enrollment Reports & Data,” https://www.medicaid.gov/medicaid/national-medicaid-chip-program-information/medicaid-chip-enrollment-data/monthly-medicaid-chip-application-eligibility-determination-and-enrollment-reports-data/index.html. July 2021 data are preliminary.

[38] Gideon Lukens, “Medicaid Coverage Gap Affects Even Larger Group Over Time Than Estimates Indicate,” CBPP, September 3, 2021, https://www.cbpp.org/sites/default/files/9-3-21health.pdf. Black and Latino people are more likely to be enrolled in Medicaid largely because they are more likely to live in low-income families, a legacy of unequal opportunities due to racism and discrimination. It is uncertain why Latino people experience more frequent disruptions in Medicaid coverage, but reasons could include higher rates of income volatility or administrative obstacles to renewing coverage.

[39] D. Keith Branham et al., “Access to Marketplace Plans with Low Premiums on the Federal Platform: Part II,” Office of the Assistant Secretary for Planning and Evaluation, U.S. Department of Health and Human Services, April 1, 2021, https://aspe.hhs.gov/reports/access-marketplace-plans-low-premiums-uninsured-american-rescue-plan. Estimates are for uninsured non-elderly adults potentially eligible for marketplace coverage in Healthcare.gov states.

[40] Tara Straw, “Marketplace Poised for Further Gains as Open Enrollment Begins,” CBPP, October 29, 2021, https://www.cbpp.org/research/health/marketplaces-poised-for-further-gains-as-open-enrollment-begins.

[41] “Marketplace 2022 Open Enrollment Period Report: Final National Snapshot,” Centers for Medicare & Medicaid Services (CMS), January 27, 2022, https://www.cms.gov/newsroom/fact-sheets/marketplace-2022-open-enrollment-period-report-final-national-snapshot; Marketplace Open Enrollment Period Public Use Files, 2020 and 2021; “Biden-Harris Administration Announces 14.5 Million Americans Signed Up for Affordable Health Care During Historic Open Enrollment Period,” CMS, January 27, 2022, https://www.cms.gov/newsroom/press-releases/biden-harris-administration-announces-145-million-americans-signed-affordable-health-care-during.

[42] Robin A. Cohen and Amy E. Cha, “Health Insurance Coverage: Early Release of Quarterly Estimates From the National Health Interview Survey, July 2020-September 2021,” Centers for Disease Control and Prevention (CDC), January 2022, https://www.cdc.gov/nchs/data/nhis/earlyrelease/Quarterly_Estimates_2021_Q13.pdf; Robin A. Cohen et al., “Health Insurance Coverage: Early Release of Estimates From the National Health Interview Survey, 2020,” CDC, U.S. Department of Health and Human Services, August 2021, https://www.cdc.gov/nchs/data/nhis/earlyrelease/insur202108-508.pdf.

[43] Joel Ruhter et al., “Tracking Health Insurance Coverage in 2020-2021,” Office of the Assistant Secretary for Planning and Evaluation, U.S. Department of Health and Human Services, October 29, 2021, https://aspe.hhs.gov/reports/tracking-health-insurance-coverage

[44] Jessica Schubel, “States Are Leveraging Medicaid to Respond to COVID-19,” CBPP, updated September 2, 2020, https://www.cbpp.org/research/health/states-are-leveraging-medicaid-to-respond-to-covid-19.

[45] Jennifer Sullivan, “States Are Using One-Time Funds to Improve Medicaid Home- and Community-Based Services, But Longer-Term Investments Are Needed,” CBPP, September 23, 2021, https://www.cbpp.org/research/health/states-are-using-one-time-funds-to-improve-medicaid-home-and-community-based.

[46] Judith Solomon, “Medicaid Needs Direct Funding to Providers and More Federal Funds for States,” CBPP, June 10, 2020, https://www.cbpp.org/blog/medicaid-needs-direct-funding-to-providers-and-more-federal-funds-for-states.

[47] Sharon Parrott et al., “Immediate and Robust Policy Response Needed in Face of Grave Risks to the Economy,” CBPP, March 19, 2020, https://www.cbpp.org/research/economy/immediate-and-robust-policy-response-needed-in-face-of-grave-risks-to-the-economy.

[48] Government Accountability Office, “Continued Attention Needed to Enhance Federal Preparedness, Response, Service Delivery, and Program Integrity,” July 2021, https://www.gao.gov/assets/gao-21-551.pdf.

[49] Stefan Pichler, Katherine Wen, and Nicholas R. Ziebarth, “COVID-19 Emergency Sick Leave has Helped Flatten the Curve in the United States,” Health Affairs, Vol. 39, No. 12, October 15, 2020, https://www.healthaffairs.org/doi/10.1377/hlthaff.2020.00863.

[50] Rachel Garg et al., “A new normal for 2-1-1 food requests?” Washington University in St. Louis Health Communication Research Laboratory, June 15, 2020, https://hcrl.wustl.edu/a-new-normal-for-2-1-1-food-requests/; Cindy Charles et al., “Trends of top 3 food needs during COVID,” Washington University in St. Louis Health Communication Research Laboratory, August 7, 2020, https://hcrl.wustl.edu/trends-of-top-3-food-needs-during-covid/.

[51] Paul Morello, “The food bank response to COVID, by the numbers,” Feeding America, March 12, 2021, https://www.feedingamerica.org/hunger-blog/food-bank-response-covid-numbers.

[52] According to annual food insecurity data from the December 2020 Food Security Supplement of the Current Population Survey (CPS-FSS), 10.5 percent of U.S. households were food insecure in 2020. While the overall prevalence of food insecurity was unchanged from 2019, it increased for households with children and Black households. The number of individuals in food-insecure households also increased by 3 million, from 35.2 million in 2019 to 38.3 million in 2020.

The CPS-FSS includes a measure of food insecurity, based on ten to 18 questions about conditions and behaviors related to difficulty meeting food needs. This measure is different from the food insufficiency measure in the Household Pulse Survey, which is based on a single question about the household having enough food to eat in the past seven days. While the food insecurity figures from the CPS-FSS appear to show lower rates of food hardship during 2020 than the Household Pulse Survey, more research is needed to assess the impact of differences in reference periods, mode of data collection, response rates, and other factors on reported food hardship. See Alisha Coleman-Jensen et al., “Household Food Security in the United States in 2020,” U.S. Department of Agriculture, September 2021, https://www.ers.usda.gov/publications/pub-details/?pubid=102075.

[53] Through SNAP, all states have provided Emergency Allotments (EA), which Congress authorized in March 2020, and all but a handful of states continue to provide them. USDA may approve states to provide EAs for as long as the federal government has declared a public health emergency and the state has issued an emergency or disaster declaration. In states providing EAs, all households receive the maximum benefit for their household size; if the difference between the maximum benefit and the household’s original benefit under the SNAP benefit formula is less than $95, then the household’s EA is increased so the total EA benefit is no lower than $95. See USDA, “USDA Increases Emergency SNAP Benefits for 25 million Americans,” April 1, 2021, https://www.fns.usda.gov/news-item/usda-006421. Families First and the American Rescue Plan provided funding for additional commodity purchases for emergency food programs and increased funding for the nutrition assistance block grants in Puerto Rico, American Samoa, and the Northern Mariana Islands.

[54] For a description of the temporary flexibilities in SNAP, see CBPP, “States Are Using Much-Needed Temporary Flexibility in SNAP to Respond to COVID-19 Challenges,” updated October 4, 2021, https://www.cbpp.org/research/food-assistance/states-are-using-much-needed-temporary-flexibility-in-snap-to-respond-to.

[55] When the federal public health emergency ends, the temporary SNAP benefit increases will end, but due to a permanent change in the Thrifty Food Plan (TFP), SNAP benefits will remain higher than before the pandemic, averaging roughly $170 per person per month. In August 2021, USDA announced a revision of the TFP, which raised maximum SNAP benefits by 21 percent compared to what they would have been beginning in October 2021 (and in future years). See “USDA Modernizes the Thrifty Food Plan, Updates SNAP Benefits,” USDA, August 16, 2021, https://www.fns.usda.gov/news-item/usda-0179.21; and Joseph Llobrera, Matt Saenz, and Lauren Hall, “USDA Announces Important SNAP Benefit Modernization,” CBPP, August 26, 2021, https://www.cbpp.org/research/food-assistance/usda-announces-important-snap-benefit-modernization.

[56] See Appendix A of Elaine Waxman et al., “Documenting Pandemic EBT for the 2020-21 School Year,” Urban Institute, October 26, 2021, https://www.urban.org/research/publication/documenting-pandemic-ebt-2020-21-school-year/view/full_report for a timeline of when various aspects of the Pandemic-EBT program were adopted in federal law.

[57] Prior to the pandemic, children received $9 per month and women received $11 per month for fruit and vegetables. During the summer of 2021, the fruit and vegetable benefit was increased to $35 per month for women and children for a four-month period. Since October 2021, children receive $24 monthly, pregnant and postpartum individuals receive $43 monthly, and breastfeeding individuals receive $47 monthly. These increases are in effect through March 31, 2022, under P.L. 117-70.

[58] Lauren Bauer et al., “An Update on the Effect of Pandemic EBT on Measures of Food Hardship,” Brookings Institution Hamilton Project, September 29, 2021, https://www.brookings.edu/research/an-update-on-the-effect-of-pandemic-ebt-on-measures-of-food-hardship/. As explained in the technical appendix, households were considered to have very low food security among children if they reported that the children sometimes or often did not eat enough in the last seven days because the household could not afford food. Households that experienced food insufficiency reported that they were sometimes or often not able to get enough to eat in the previous seven days.

[59] The U.S. Department of Housing and Urban Development’s definition of “individual” refers to a person who is not part of a family with children during an episode of homelessness. Individuals may be homeless as single adults, unaccompanied youth, or in multiple-adult or multiple-child households.

[60] Meghan Henry et al., “The 2020 Annual Homeless Assessment Report (AHAR) to Congress, Part 1,” Department of Housing and Urban Development, January 2021, https://www.huduser.gov/portal/sites/default/files/pdf/2020-AHAR-Part-1.pdf.

[61] Renter households with worst case housing needs are those with very low incomes (no more than 50 percent of the area median income) who receive no government housing assistance and pay more than half of their income for rent, live in severely inadequate conditions, or both.

[62] California Project Roomkey: https://www.cdss.ca.gov/inforesources/cdss-programs/housing-programs/project-roomkey; Shelter Guidance: https://files.hudexchange.info/resources/documents/Non-Congregate-Approaches-to-Sheltering-for-COVID-19-Homeless-Response.pdf and https://www.hud.gov/sites/dfiles/CPD/documents/Model-Transitions-Document_FINAL.pdf; King County: https://kingcounty.gov/depts/health/covid-19/providers/~/media/depts/health/communicable-diseases/documents/C19/hch/shelter-in-place-guidance.ashx.

[63] U.S. Department of the Treasury, “Emergency Rental Assistance Program,” https://home.treasury.gov/policy-issues/coronavirus/assistance-for-state-local-and-tribal-governments/emergency-rental-assistance-program.

[64] Jacob Haas et al., “Preliminary Analysis: Eviction Filing Trends After the CDC Moratorium Expiration,” Eviction Lab, December 9, 2021, https://evictionlab.org/updates/research/eviction-filing-trends-after-cdc-moratorium/.

[65] Data posted as of January 16, 2022. https://www.hud.gov/program_offices/public_indian_housing/ehv/dashboard.

[66] CBPP analysis of Census’ Household Pulse Survey public use file, data collected December 1-December 13, 2021.

[67] On December 27, 2020, when most of the funds were allocated, Congress extended the deadline, allowing states and populous cities and counties to use the funds to cover costs incurred through the end of 2021.

[68] Alan Berube, Christiana K. McFarland, and Teryn Zmuda, “How Communities Are Investing American Rescue Plan funds with the Local Government ARPA Investment Tracker,” Brookings Institution, February 3, 2022, https://www.brookings.edu/blog/the-avenue/2022/02/03/how-communities-are-investing-american-rescue-plan-funds-with-the-local-government-arpa-investment-tracker/.

[69] For a summary of state and local fiscal recovery funds (SLFRF) spending, see Ed Lazere, “How States Can Best Use Federal Fiscal Recovery Funds: Lessons From State Choices So Far,” CBPP, November 29, 2021, https://www.cbpp.org/research/state-budget-and-tax/how-states-can-best-use-federal-fiscal-recovery-funds-lessons-from.

[70] Court rulings have stopped this prohibition from having effect in some states.

[71] For example, the governors of Mississippi and West Virginia both announced their support for eliminating income taxes shortly after the November 2020 election, before the American Rescue Plan was adopted. And conservative policy makers in several states have called for income tax cuts for years, and in many cases have enacted them.

[72] In the aftermath of the Great Recession, Kansas, Maine, North Carolina, Ohio, and Wisconsin all enacted large income tax cuts, and several other states enacted income tax cuts that were smaller as a share of the revenues. In all, between 2008 and 2019, 18 states enacted personal income tax rate cuts and 17 states (plus Washington, D.C.) enacted corporate income tax rate cuts. See Michael Leachman and Michael Mazerov, “State Personal Income Tax Cuts: Still a Poor Strategy for Economic Growth,” CBPP, May 14, 2015, https://www.cbpp.org/research/state-budget-and-tax/state-personal-income-tax-cuts-still-a-poor-strategy-for-economic. See also Michael Leachman and Erica Williams, “States Can Learn From Great Recession, Adopt Forward-Looking, Antiracist Policies,” CBPP, February 11, 2021, https://www.cbpp.org/sites/default/files/2-11-21sfp.pdf.

[73] City of Pittsburgh Recovery Plan, State and Local Fiscal Recovery Funds, 2021 Report, https://apps.pittsburghpa.gov/redtail/images/15563_SLFRF-Recovery-Plan-Performance-Report_8.31.2021.pdf.

[74] City of St. Louis, MO 2021 Recovery Plan, State and Local Fiscal Recovery Funds, 2021 Report, August 31, 2021, https://home.treasury.gov/system/files/136/St.Louis_2021-Recovery-Plan_SLT-2835.pdf. For a summary of the plans described in city and county SLFRF reports in August 2021, see the Brookings Institution, “Local Government ARPA Investment Tracker, February 3, 2022, https://www.brookings.edu/interactives/arpa-investment-tracker/.

[75] See Joshua Marshall, “Tribal Nations More Vulnerable to COVID-19 Impacts, Need Additional Fiscal Aid,” CBPP, August 5, 2020, https://www.cbpp.org/blog/tribal-nations-more-vulnerable-to-covid-19-impacts-need-additional-fiscal-aid.

[76] The Navajo Nation, Office of the President and Vice President, “Initial Distribution of ARPA Fiscal Recovery Funds Allocated,” press release issued October 13, 2021, https://navajonationarpa.org/hidden/press-releases/53-for-immediate-release-initial-distribution-of-arpa-fiscal-recovery-funds-allocated/file.

[77] “Puerto Rico to Receive Massive $2.47 Billion As Part of the American Rescue Plan 2021,” El American, June 9, 2021, https://elamerican.com/puerto-rico-receive-billion-rescue-plan/. See also “Gobernador anuncia distribucion millonaria de fondos ARPA,” La Fortaleza, August 3, 2021, https://www.fortaleza.pr.gov/comunicados/gobernador-anuncia-distribucion-millonaria-de-fondos-arpa.

[78] Gian Maria Milesi-Ferretti, “A most unusual recovery: How the US rebound from COVID differs from rest of G7,” Brookings Institution, December 8, 2021, https://www.brookings.edu/blog/up-front/2021/12/08/a-most-unusual-recovery-how-the-us-rebound-from-covid-differs-from-rest-of-g7/#cancel.

[79] The Coronavirus Preparedness and Response Supplemental Appropriations Act, 2020 (P.L. 116-123), and the Families First Coronavirus Response Act (P.L. 116-127), which increased federal funding for some federal agencies and for state and local governments, required employers to grant paid sick leave to employees, and provided payments and tax credits to employers. The CARES Act (P.L. 116-136) provided loans to businesses, payments to health care providers, payments and tax credits to individuals, additional funding to state and local governments, and reductions in certain business taxes. Finally, the Paycheck Protection Program (PPP) and Health Care Enhancement Act (P.L. 116-139) increased federal funding for the loans to businesses and payments to health care providers supplied in the CARES Act.

[80] The Congressional Budget Office (CBO) reports that without the relief policies, GDP would have shrunk by 10 percent between 2019 and 2020 and risen by 5 percent between 2020 and 2021 (compared with -5.8 percent and 4.0 percent, respectively, in the July 2020 projections that include the effects of policy). These growth estimates imply that the level of GDP in 2020 and 2021 would be roughly 12 percent and 9 percent lower, respectively, without the relief measures. “The Effects of Pandemic-Related Legislation on Output,” Congressional Budget Office, September 18, 2020, https://www.cbo.gov/publication/56537.

[81] These relief and recovery measures also boosted job growth. While nonfarm payroll employment was still 3.6 million jobs lower at the end of 2021 than at the start of the recession in February 2020, actual job losses were substantially lower than CBO projected they would be. In the fourth quarter of 2021, payroll employment was 3 million jobs below its pre-pandemic level in the fourth quarter of 2019, while CBO projected in July 2020 — before enactment of the December package and the American Rescue Plan — that the shortfall would be 7 million jobs.

[82] The National Bureau of Economic Research, the acknowledged arbiter of business dating, has determined that the pandemic recession lasted two months, from the previous peak in February 2020 through April 2020. On a quarterly basis, the NBER determined that the recession lasted two quarters, from the previous peak in the fourth quarter of 2019 through the second quarter of 2020.

[83] Bernard Yaros, Jesse Rogers, Ross Cioffi, and Mark Zandi, “Fiscal Policy in the Pandemic,” Moody’s Analytics, forthcoming.

[84] Congressional Budget Office, “Additional Information About the Updated Budget and Economic Outlook: 2021 to 2031,” Figure 2-1, https://www.cbo.gov/publication/57373#_idTextAnchor084.

[85] The recovery from the large job losses between February 2020 and April 2020 has generally been largest for the same groups that experienced the deepest losses, but in many cases, all of the recession losses have not yet been made up. For example, while the share of Hispanic workers with a job in December 2021 was 0.3 percent higher than in February 2020, Hispanic women’s employment was still 0.6 percent below what it was in February 2020.

[86] Employment Cost Index calculations reported in Jason Furman and Wilson Powell III, “ US wages grew at fastest pace in decades in 2021, but prices grew even more,” Peterson Institution for International Economics, January 28, 2022, https://www.piie.com/blogs/realtime-economic-issues-watch/us-wages-grew-fastest-pace-decades-2021-prices-grew-even-more.

[87] See, for example, Paul Krugman, “The Secret Triumph of Economic Policy,” New York Times, January 13, 2022, https://www.nytimes.com/2022/01/13/opinion/pandemic-economic-recovery.html.