Health Provisions in American Rescue Plan Act Improve Access to Health Coverage During COVID Crisis
The American Rescue Plan Act includes several vital provisions that would make comprehensive coverage more affordable and accessible for millions of people. The COVID-19 relief law enhances for two years premium tax credits available through the health insurance marketplaces, boosts financial incentives for additional states to rapidly expand Medicaid, and takes other steps to improve access to health coverage during the health and economic crisis.
Consistent with a proposal President Biden outlined in January, the Act eliminates premiums for many low-income people who are already eligible for plans in the Affordable Care Act (ACA) marketplaces and vastly reduces premiums for others. It extends new help with premiums to people with somewhat higher incomes who face high premium burdens. And it protects marketplace enrollees who experienced income fluctuations last year from large repayments of their premium tax credits to the federal government. Additional provisions will bring down insurance costs for specific populations, such as those who receive unemployment benefits and those who lose their jobs but want to temporarily maintain their job-based health insurance.
The law also offers a strong incentive for the 14 states that have not yet implemented the ACA’s Medicaid expansion to quickly do so by providing increased federal funds to states that newly expand. If the remaining states expanded Medicaid, nearly 4 million uninsured low-income adults, including about 640,000 essential or front-line workers, could gain coverage. Those who could gain coverage also include over 2 million people now in the so-called coverage gap — that is, people whose incomes are below the poverty line, and thus ineligible for premium tax credits for marketplace coverage, but who are ineligible for Medicaid under their state’s rules.
"Improving premium tax credits and further expanding Medicaid, in particular, will provide much-needed assistance to people who need help obtaining or affording health coverage."Improving premium tax credits and further expanding Medicaid, in particular, will provide much-needed assistance to people who need help obtaining or affording health coverage. Comprehensive health coverage is important under any circumstances because it improves people’s access to care, financial security, and health outcomes when they get sick. But preserving and extending coverage is even more important in the COVID crisis because it shields families from financial hardship and supports public health efforts, easing people’s access to testing, treatment, and vaccines.
Premium Tax Credit Improvements Provide Significant Financial Help
The American Rescue Plan Act boosts premium tax credits for 2021 and 2022, eliminating or reducing premiums for millions of current marketplace enrollees to ensure that no marketplace enrollee spends more than 8.5 percent of their income on premiums, irrespective of their income. This reduces the previous 9.83 percent limit for people with income of 300 to 400 percent of the poverty line and newly establishes a premium cap for marketplace enrollees with higher incomes. Under the law, people with income below 150 percent of the poverty line (about $19,000 for a single person and $39,000 for a family of four) will pay no premiums for a benchmark plan, after accounting for premium tax credits, and other families will pay a capped share of income toward health coverage.
These improvements to premium tax credits help a broad group: almost everyone enrolled in marketplace coverage, except for higher-income people whose premiums are already less than 8.5 percent of their incomes. (See Appendix tables 1 and 2.) The Urban Institute estimated that similar improvements would lead about 4.5 million people to gain coverage.[1]
Increasing Subsidies for Low- and Moderate-Income People Is Key to Increasing Coverage
People with incomes up to 400 percent of the poverty line (about $51,000 for a single person and $105,000 for a family of four) are already eligible for premium tax credits that help them afford marketplace coverage. But data suggest that low- and moderate-income people still face the greatest challenges affording coverage and care.[2]
The premium tax credit has made insurance more affordable for many people, yet the uninsured rate for lower-income people eligible for the most generous subsidies remains high: 14.1 percent of people with incomes between 138 and 250 percent of the poverty line are uninsured, compared to 3.1 percent for people with incomes above 500 percent of the poverty line. Uninsured people at all income levels cite cost as the greatest barrier to coverage, so making financial assistance more adequate is key to appreciably reducing uninsured rates and improving access to care.[3] For example in Massachusetts ― which has the lowest uninsured rate in the country for people with incomes between 138 and 250 percent of the poverty line ― sizable state subsidies on top of those the ACA offers greatly reduce premiums for people with income below 300 percent of the poverty line. People with income between 138 and 150 percent of the poverty line are guaranteed a plan with zero net premium (after accounting for premium tax credits), compared to monthly premiums of $50 and $66 for a benchmark plan in other states.
The American Rescue Plan Act significantly reduces premiums for people who are currently eligible for help by increasing their premium tax credits. For example:
- A single individual making $18,000 will pay zero net premium rather than $54 per month (3.6 percent of income) and will qualify for the most generous subsidies for deductibles and other cost-sharing amounts.
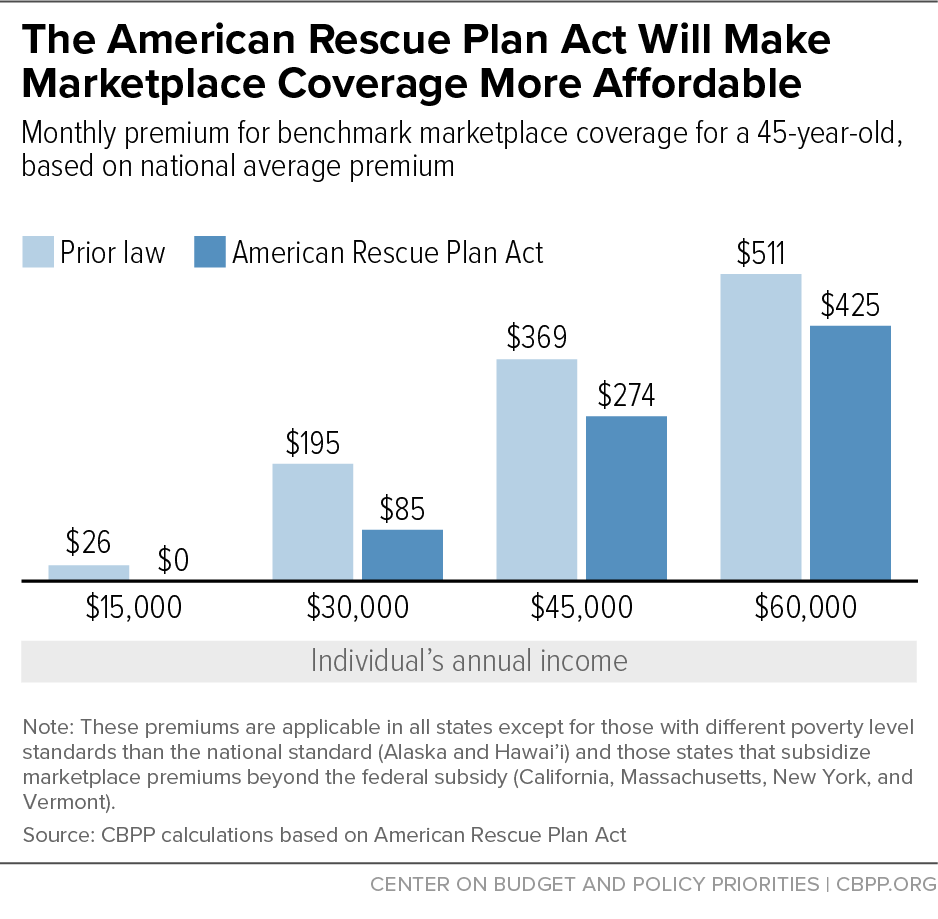
- A single individual making $30,000 will pay $85 rather than $195 per month in premiums (3.4 instead of 7.8 percent of income) and qualify for a plan with reduced deductibles and other cost-sharing amounts. (See Figure 1.) Or, with the bigger subsidy, the same person could opt to buy a gold plan with lower cost-sharing charges for $115 per month.
- A family of four making $50,000 will pay $67 rather than $252 per month in premiums for benchmark coverage (1.6 instead of 6.0 percent of their income) and qualify for generous cost-sharing reductions.[4]
- A family of four making $75,000 will pay $340 rather than $588 per month in premiums for benchmark coverage (5.4 instead of 9.4 percent of their income). A typical family could purchase a gold plan with lower deductibles and other cost sharing for about $440 per month (roughly 7 percent of income).[5]
Extending Premium Tax Credits Helps Older People and Those Living in High-Cost Areas
About 2.6 million people with income over 400 percent of the poverty line are uninsured.[6] Extending premium tax credits to people in this group who can’t afford the full cost of coverage will help many of them and ensure that middle-income people who purchase individual market coverage pay premiums no higher than 8.5 percent of their income.
Creating an income cap of 8.5 percent on premiums will be especially important to middle-income people, older people, and people who live in areas with high premiums.[7] The cap targets the most assistance to people with high premium burdens. For example, marketplace benchmark coverage for a 40-year-old in Charleston, West Virginia earning $55,000 a year (431 percent of the poverty line) costs about $731 per month, more than 1.5 times the national average. Under the Act, this person will get a monthly premium discount of $341, bringing their premium down to $390 per month.[8] In lower-cost states, a person of the same age with the same income won’t receive a premium tax credit because their premium is already below 8.5 percent of their income. And the premium tax credit enhancement will automatically phase out at higher income levels because premiums are generally less than 8.5 percent of income for high-income people.
Providing premium tax credits to limit premium liability to no more than 8.5 percent of income helps other people who might otherwise have trouble affording coverage. For example:
- A typical 60-year-old making $60,000 will see their premiums cut by more than half, or $535 per month. Instead of paying $960 per month in premiums for benchmark coverage, or 19 percent of income, the consumer will pay $425, or 8.5 percent of income.
- A typical family of four with income of $110,000 will see their premiums cut almost in half, by $666 per month. Instead of paying $1,445 per month in premiums for benchmark coverage, or nearly 16 percent of their income, the family will pay $779, or 8.5 percent of their income, with the premium tax credit making up the difference.
Related Marketplace Policies Will Help Families Recover From COVID’s Coverage Impacts
Several other policies in the American Rescue Plan Act will provide meaningful help to people struggling to afford health coverage as they face economic hardship and uncertainty.
Under the ACA, people receive premium tax credits in advance to pay for coverage based on their projected annual income. But if they have a change in circumstance during the year, their year-end income might be higher than they predicted and they must repay some or all of the excess premium tax credit they received. In 2020, many low- and moderate-income people had fluctuating incomes that made projecting income especially difficult and meant that some people had higher incomes than they had projected. For example, some people lost their jobs early in the year but later got new ones with higher earnings than they had expected, while others worked additional hours or received bonus pay as essential workers. The Act exempts low- and moderate-income families from having to repay the excess premium tax credit they received in 2020. This protects people from having very high repayments this spring, during a time of continued economic uncertainty.
In addition, the Act offers subsidies to people who have recently lost their jobs. It enhances premium tax credits for people who receive unemployment benefits in 2021 by setting their marketplace eligibility at a projected income that guarantees they get the most generous premium tax credit and cost-sharing help if they enroll in an ACA marketplace plan, irrespective of their actual year-end income. This will help many people who are financially vulnerable and work in non-telework occupations that are more susceptible to loss of earnings during the pandemic, particularly single earners, people of color, and people with minimal savings to cushion the income loss.[9]
The Act also provides federal funding to cover the entire cost of people’s premiums for “COBRA” coverage from April through September 30, 2021. COBRA coverage[10] lets people who have job-based health insurance retain it for up to 18 months after they lose their job. Usually, people have to pay the full cost of the premium on their own, making this option unaffordable for many, but this provision helps people stay enrolled in their employer-sponsored health plan.
Medicaid Expansion Is Essential in the Pandemic
The American Rescue Plan Act includes a two-year increase in federal Medicaid funding, beginning when a state implements the expansion, as an added incentive for states to newly expand Medicaid. The financial incentive to expand Medicaid is already substantial; the federal government covers 90 percent of the cost of coverage for the expansion group. This provision provides an added incentive to expand coverage at a time when expanding access to health care is particularly important. If the 14 remaining states expand, at least 4 million additional uninsured adults would become eligible for Medicaid coverage, likely more due to the recession. Of these, nearly 60 percent are people of color.[11]
In states considering the Medicaid expansion, officials sometimes cite state costs as a concern.[12] While research shows that Medicaid expansion generates enough savings and increased revenue to offset the state’s share of the cost,[13] the new law’s robust fiscal incentive goes far to address any remaining cost-related concerns because it would increase a state’s overall Medicaid funding by more than the cost of covering the expansion group over the first two years.
The Act increases how much the federal government pays toward a state’s Medicaid expenditures (known as the “federal medical assistance percentage” or FMAP) for all groups other than those eligible through expansion by 5 percentage points for two years after a state expands. States would still receive the 90 percent enhanced FMAP for the expansion group. The increased federal funds stemming from the overall increase in the FMAP for the rest of the Medicaid program would exceed the full cost of the Medicaid expansion, providing states with additional funds they could use to stave off cuts in Medicaid and in other state services during the economic crisis accompanying the pandemic. Georgia, for example, would receive close to $2 billion over the two-year period following expansion, more than the cost of providing coverage to the expansion group. (See Appendix Table 3.)
Many people who could gain coverage through the expansion are at elevated risk from COVID-19, because they face a high risk of becoming infected due to their occupation or living conditions or a high risk of serious illness if they become infected because of underlying health conditions. Expanding Medicaid in the remaining states would provide coverage to millions of older adults, people with disabilities, and others with underlying health conditions that increase their risk of complications from the disease.
Expanding Medicaid in the remaining states would result in an estimated 640,000 currently uninsured essential or front-line workers gaining coverage. This includes people who have jobs that likely require them to work in person, such as hospital workers, home health aides, and grocery store workers.[14] Prior to the COVID-19 crisis, the uninsured rate for low-income workers in these jobs was 30 percent in non-expansion states, nearly double the rate in expansion states.
Strong evidence suggests that, in addition to providing uninsured people with access to needed care, health insurance coverage reduces economic hardship, which has been widespread in the pandemic.[15] Expanding access to Medicaid coverage leads to lower out-of-pocket medical expenditures and medical debt while reducing the likelihood of experiencing catastrophic medical expenditures, not paying other household bills, or borrowing money to pay for medical care, research shows.[16] Other research found an association between Medicaid expansion and declines in food insecurity.[17]
Appendix
| APPENDIX TABLE 1 | |||
|---|---|---|---|
| American Rescue Plan Act Lowers Marketplace Premiums for Individuals, Couples, and Families at Various Income Levels | |||
| Monthly marketplace premiums | |||
| Prior law | Under American Rescue Plan Act | Difference | |
| 45-year-old individual | |||
| $18,000 (141% FPL)* | $54 | $0 | -$54 |
| $30,000 (235% FPL) | $195 | $85 | -$110 |
| $45,000 (352% FPL) | $369 | $274 | -$95 |
| $60,000 (470% FPL)** | $511 | $425 | -$86 |
| 60-year-old couple | |||
| $30,000 (174% FPL) | $132 | $24 | -$108 |
| $45,000 (261% FPL) | $325 | $167 | -$158 |
| $60,000 (348% FPL) | $492 | $360 | -$132 |
| $75,000 (435% FPL)** | $1,920 | $531 | -$1,389 |
| Family of four*** | |||
| $45,000 (171% FPL) | $193 | $32 | -$161 |
| $60,000 (229% FPL) | $379 | $158 | -$221 |
| $90,000 (343% FPL) | $737 | $531 | -$206 |
| $120,000 (458% FPL)** | $1,445 | $850 | -$595 |
| APPENDIX TABLE 2 | |||||||||
|---|---|---|---|---|---|---|---|---|---|
| American Rescue Plan Act Lowers Marketplace Premiums for Those Above 400 Percent of Poverty in All States | |||||||||
| Monthly marketplace premiums | |||||||||
| State | 45-year-old individual; $60,000 (470% FPL*) | 60-year-old couple; $75,000 (435% FPL*) | Family of four;** $120,000 (458% FPL*) | ||||||
| Prior law | Under American Rescue Plan Act *** | Difference | Prior law | Under American Rescue Plan Act | Difference | Prior law | Under American Rescue Plan Act | Difference | |
| U.S. average | $511 | $425 | -$86 | $1,920 | $531 | -$1,389 | $1,445 | $850 | -$595 |
| Alabama | 667 | 425 | -242 | 2,506 | 531 | -1,975 | 1,766 | 850 | -916 |
| Alaska**** | 763 | 531 | -232 | 2,867 | 664 | -2,203 | 2,158 | 1,062 | -1,096 |
| Arizona | 493 | 425 | -68 | 1,852 | 531 | -1,321 | 1,394 | 850 | -544 |
| Arkansas | 445 | 425 | -20 | 1,673 | 531 | -1,142 | 1,260 | 850 | -410 |
| California | 481 | 425 | -56 | 1,809 | 531 | -1,278 | 1,362 | 850 | -512 |
| Colorado | 397 | 397 | 0 | 1,491 | 531 | -960 | 1,122 | 850 | -272 |
| Connecticut | 655 | 425 | -230 | 2,463 | 531 | -1,932 | 1,854 | 850 | -1,004 |
| Delaware | 610 | 425 | -185 | 2,294 | 531 | -1,763 | 1,727 | 850 | -877 |
| DC | 503 | 425 | -78 | 1,787 | 531 | -1,256 | 1,387 | 850 | -537 |
| Florida | 516 | 425 | -91 | 1,941 | 531 | -1,410 | 1,461 | 850 | -611 |
| Georgia | 515 | 425 | -90 | 1,937 | 531 | -1,406 | 1,458 | 850 | -608 |
| Hawai’i**** | 540 | 489 | -51 | 2,030 | 611 | -1,419 | 1,528 | 977 | -551 |
| Idaho | 559 | 425 | -134 | 2,102 | 531 | -1,571 | 1,583 | 850 | -733 |
| Illinois | 478 | 425 | -53 | 1,797 | 531 | -1,266 | 1,352 | 850 | -502 |
| Indiana | 476 | 425 | -51 | 1,788 | 531 | -1,257 | 1,346 | 850 | -496 |
| Iowa | 591 | 425 | -166 | 2,221 | 531 | -1,690 | 1,672 | 850 | -822 |
| Kansas | 555 | 425 | -130 | 2,085 | 531 | -1,554 | 1,570 | 850 | -720 |
| Kentucky | 538 | 425 | -113 | 2,022 | 531 | -1,491 | 1,522 | 850 | -672 |
| Louisiana | 616 | 425 | -191 | 2,315 | 531 | -1,784 | 1,743 | 850 | -893 |
| Maine | 497 | 425 | -72 | 1,869 | 531 | -1,338 | 1,407 | 850 | -557 |
| Maryland | 392 | 392 | 0 | 1,474 | 531 | -943 | 1,109 | 850 | -259 |
| Massachusetts | 410 | 410 | 0 | 1,542 | 531 | -1,011 | 1,161 | 850 | -311 |
| Michigan | 392 | 392 | 0 | 1,474 | 531 | -943 | 1,109 | 850 | -259 |
| Minnesota | 347 | 347 | 0 | 1,304 | 531 | -773 | 1,042 | 850 | -192 |
| Mississippi | 519 | 425 | -94 | 1,950 | 531 | -1,419 | 1,374 | 850 | -524 |
| Missouri | 541 | 425 | -116 | 2,034 | 531 | -1,503 | 1,531 | 850 | -681 |
| Montana | 532 | 425 | -107 | 2,001 | 531 | -1,470 | 1,506 | 850 | -656 |
| Nebraska | 790 | 425 | -365 | 2,969 | 531 | -2,438 | 2,235 | 850 | -1,385 |
| Nevada | 444 | 425 | -19 | 1,669 | 531 | -1,138 | 1,257 | 850 | -407 |
| New Hampshire | 403 | 403 | 0 | 1,516 | 531 | -985 | 1,141 | 850 | -291 |
| New Jersey | 458 | 425 | -33 | 1,720 | 531 | -1,189 | 1,295 | 850 | -445 |
| New Mexico | 383 | 383 | 0 | 1,440 | 531 | -909 | 1,084 | 850 | -234 |
| New York | 597 | 425 | -172 | 1,194 | 531 | -663 | 1,701 | 850 | -851 |
| North Carolina | 583 | 425 | -158 | 2,192 | 531 | -1,661 | 1,650 | 850 | -800 |
| North Dakota | 557 | 425 | -132 | 2,094 | 531 | -1,563 | 1,576 | 850 | -726 |
| Ohio | 424 | 424 | 0 | 1,593 | 531 | -1,062 | 1,199 | 850 | -349 |
| Oklahoma | 626 | 425 | -201 | 2,353 | 531 | -1,822 | 1,771 | 850 | -921 |
| Oregon | 494 | 425 | -69 | 1,856 | 531 | -1,325 | 1,308 | 850 | -458 |
| Pennsylvania | 514 | 425 | -89 | 1,933 | 531 | -1,402 | 1,455 | 850 | -605 |
| Rhode Island | 394 | 394 | 0 | 1,482 | 531 | -951 | 1,116 | 850 | -266 |
| South Carolina | 538 | 425 | -113 | 2,022 | 531 | -1,491 | 1,522 | 850 | -672 |
| South Dakota | 698 | 425 | -273 | 2,625 | 531 | -2,094 | 1,976 | 850 | -1,126 |
| Tennessee | 527 | 425 | -102 | 1,979 | 531 | -1,448 | 1,490 | 850 | -640 |
| Texas | 493 | 425 | -68 | 1,852 | 531 | -1,321 | 1,394 | 850 | -544 |
| Utah | 558 | 425 | -133 | 1,915 | 531 | -1,384 | 1,450 | 850 | -600 |
| Vermont | 669 | 425 | -244 | 1,338 | 531 | -807 | 1,880 | 850 | -1,030 |
| Virginia | 541 | 425 | -116 | 2,034 | 531 | -1,503 | 1,531 | 850 | -681 |
| Washington | 438 | 425 | -13 | 1,648 | 531 | -1,117 | 1,241 | 850 | -391 |
| West Virginia | 739 | 425 | -314 | 2,778 | 531 | -2,247 | 2,091 | 850 | -1,241 |
| Wisconsin | 516 | 425 | -91 | 1,941 | 531 | -1,410 | 1,461 | 850 | -611 |
| Wyoming | 894 | 425 | -469 | 3,360 | 531 | -2,829 | 2,529 | 850 | -1,679 |
| APPENDIX TABLE 3 | |
|---|---|
| State Estimates of Increase in Federal Funding From Higher FMAP Under American Rescue Plan Act | |
| State | Additional federal funding due to FMAP increase (in $millions) |
| Alabama | 940 |
| Florida | 3,540 |
| Georgia | 1,880 |
| Kansas | 330 |
| Mississippi | 890 |
| Missouri | 1,730 |
| North Carolina | 2,430 |
| Oklahoma | 860 |
| South Carolina | 960 |
| South Dakota | 180 |
| Tennessee | 1,660 |
| Texas | 5,970 |
| Wisconsin* | 1,000 |
| Wyoming | 120 |
End Notes
[1] Linda J. Blumberg et al., “Cost and Coverage Implications of Five Options for Increasing Marketplace Subsidy Generosity,” Urban Institute, February 2021, https://www.urban.org/sites/default/files/publication/103604/cost-and-coverage-implications-of-five-options-for-increasing-marketplace-subsidy-generosity.pdf. The Urban Institute estimates assume the benchmark of a higher-value gold plan instead of the second-lowest-cost silver plan.
[2] Aviva Aron-Dine and Matt Broaddus, “Improving ACA Subsidies for Low- and Moderate-Income Consumers Is Key to Increasing Coverage,” CBPP, March 21, 2019, https://www.cbpp.org/research/health/improving-aca-subsidies-for-low-and-moderate-income-consumers-is-key-to-increasing.
[3] Sara R. Collins, Munira Z. Gunja, and Michelle M. Doty, “Following the ACA Repeal-and-Replace Effort, Where Does the U.S. Stand on Insurance Coverage?” Commonwealth Fund, September 2017, https://www.commonwealthfund.org/sites/default/files/documents/___media_files_publications_issue_brief_2017_sep_collins_2017_aca_tracking_survey_ib_v2.pdf.
[4] CBPP calculations. Examples assume consumers face the national average marketplace benchmark premium. The family of four is composed of two 40-year-old parents, a 5-year-old, and a 10-year-old. The benchmark plan is the second-lowest-cost silver tier plan offered where the consumer lives.
[5] CBPP calculations. Information on the lowest-cost gold plan is available at https://www.kff.org/health-reform/state-indicator/average-marketplace-premiums-by-metal-tier/?currentTimeframe=0&sortModel=%7B%22colId%22:%22Location%22,%22sort%22:%22asc%22%7D.
[6] Congressional Budget Office, “Who Went Without Health Insurance in 2019, and Why?” September 2020, https://www.cbo.gov/system/files/2020-09/56504-Health-Insurance.pdf.
[7] Aviva Aron-Dine, “Making Health Insurance More Affordable for Middle-Income Individual Market Consumers,” CBPP, March 21, 2019, https://www.cbpp.org/research/health/making-health-insurance-more-affordable-for-middle-income-individual-market.
[8] Kaiser Family Foundation, Health Insurance Marketplace Calculator, October 30, 2020, https://www.kff.org/interactive/subsidy-calculator/.
[9] Brooke Helppie-McFall and Joanne W. Hsu, “Financial Profiles of Workers Most Vulnerable to Coronavirus-Related Earnings Loss in the Spring of 2020,” Board of Governors of the Federal Reserve System, Finance and Economics Discussion Series 2020-093, October 27, 2020, https://doi.org/10.17016/FEDS.2020.093.
[10] Named for the 1985 federal law that created it, the Consolidated Omnibus Budget Reconciliation Act.
[11] Jesse Cross-Call, “Medicaid Expansion Has Helped Narrow Racial Disparities in Health Coverage and Access to Care,” CBPP, October 21, 2020, https://www.cbpp.org/research/health/medicaid-expansion-has-helped-narrow-racial-disparities-in-health-coverage-and.
[12] Jesse Cross-Call, “Medicaid Expansion’s Coverage Gains Won’t Hurt State Budgets, Even in Recession,” CBPP, June 18, 2020, https://www.cbpp.org/blog/medicaid-expansions-coverage-gains-wont-hurt-state-budgets-even-in-recession.
[13] Bryce Ward, “The Impact of Medicaid Expansion on States’ Budgets,” Commonwealth Fund, May 5, 2020, https://www.commonwealthfund.org/publications/issue-briefs/2020/may/impact-medicaid-expansion-states-budgets#:~:text=For%20the%20first%20three%20years,than%20%247%20billion%20in%202020.
[14] Jesse Cross-Call and Matt Broaddus, “States That Have Expanded Medicaid Are Better Positioned to Address COVID-19 and Recession,” CBPP, July 14, 2020, https://www.cbpp.org/research/health/states-that-have-expanded-medicaid-are-better-positioned-to-address-covid-19-and.
[15] CBPP, “Tracking the COVID-19 Recession’s Effects on Food, Housing, and Employment Hardships,” updated March 10, 2021, https://www.cbpp.org/research/poverty-and-inequality/tracking-the-covid-19-recessions-effects-on-food-housing-and.
[16] A. Finkelstein et al., “The Oregon Health Insurance Experiment: Evidence from the first year,” Quarterly Journal of Economics, Vol. 127, No. 3, 2012, pp. 1057-1106; T. Gross and M.J. Notowidigdo, “Health insurance and the consumer bankruptcy decision: Evidence from expansions of Medicaid,” Journal of Public Economics, Vol. 95, Nos. 7-8, pp. 767-778; H. Allen et al., “Early Medicaid expansion associated with reduced payday borrowing in California,” Health Affairs, Vol. 36, No. 10, 2017, pp. 1679-1776.
[17] G. Himmelstein, “Effect of the Affordable Care Act’s Medicaid Expansions on Food Security, 2010–2016,” American Journal of Public Health, Vol. 109, 2019, pp. 1243-1248.
More from the Authors

Areas of Expertise

Areas of Expertise

Areas of Expertise

Areas of Expertise

Areas of Expertise