Health Coverage Rates Vary Widely Across — and Within — Racial and Ethnic Groups

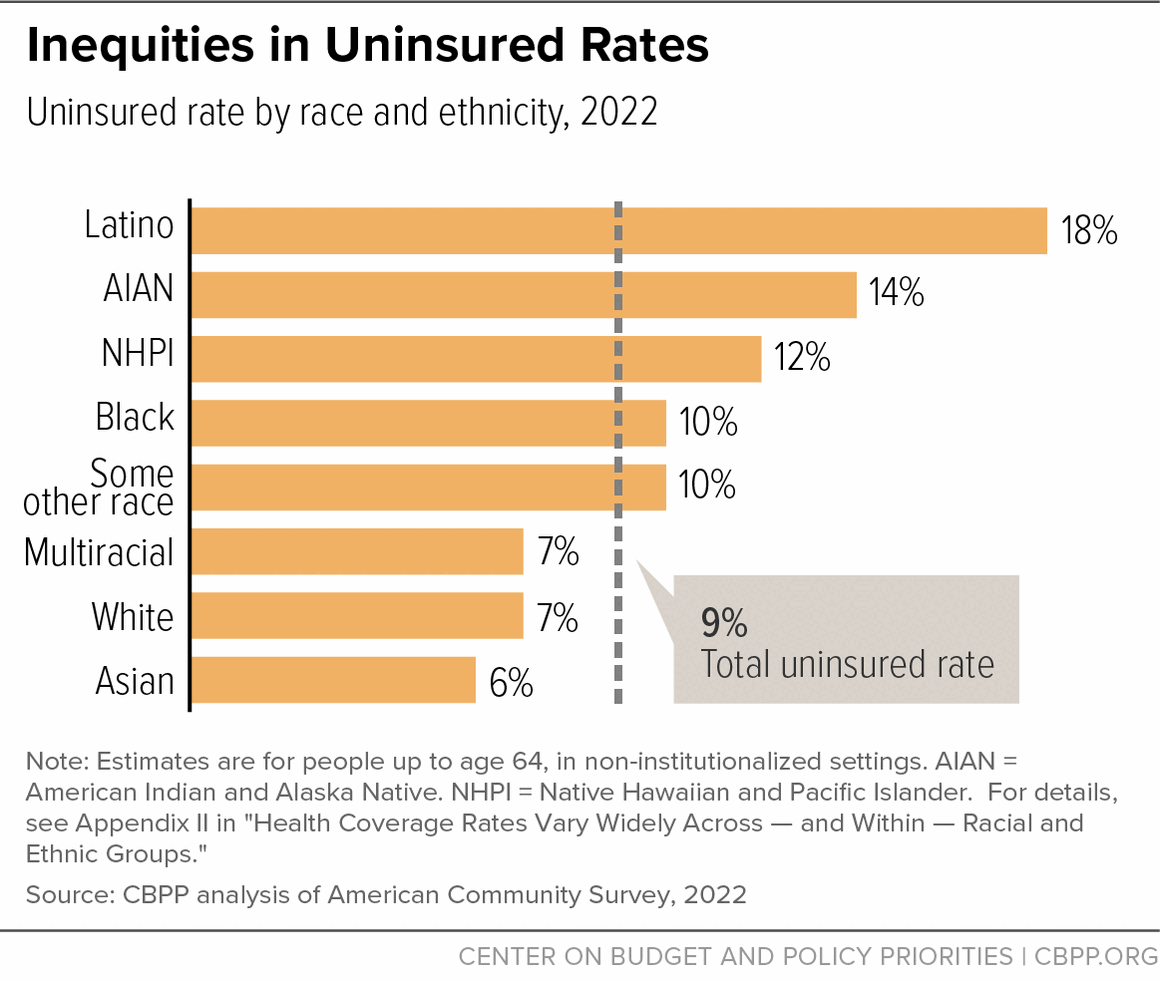
The U.S. has made significant progress toward universal health coverage since the enactment of the Affordable Care Act (ACA). But over 26 million people remain uninsured,[2] and uninsured rates vary substantially between racial and ethnic groups. (See Figure 1.) There’s even wider uninsured rate variation among the many racial and ethnic subgroups within the larger categories.

The reasons for such differences are complex. Structural racism in historic and modern health coverage policy systematically creates racial and ethnic health coverage inequities.[3] People of color tend to face greater challenges affording coverage, reflecting injustices that lead some groups to have lower incomes and reduced access to jobs that offer health benefits. Health coverage inequities are partly attributable to federal and state policy choices that determine who is eligible for coverage based on factors such as immigration status, whether one lives in a state that has opted to expand Medicaid, how accessible and affordable enrollment is, and whether outreach and enrollment assistance are robust enough to connect people to the coverage they are eligible for. Additional barriers exist for people with limited English proficiency.

It is crucial to collect and analyze robust data to understand and address drivers of inequity related to race and ethnicity, and it is important to examine differences not only between racial and ethnic groups but also within those groups. Taking a close look at the data could illuminate ways to help expand health coverage to people who remain uninsured, from dismantling barriers to eligibility and enrollment to improving the scope and accessibility of outreach and enrollment assistance. The overall uninsured rate reached record lows in 2022, but to achieve further coverage gains and to reach racial equity in health coverage, it is essential to sustain and expand upon successful, more targeted policies.

Table of Contents

Uninsured Rates Vary Across and Within Racial and Ethnic Groups

Uninsured rates are higher among Latino,[4] American Indian and Alaska Native (AIAN), Black, and Native Hawaiian and Pacific Islander (NHPI) people than among Asian, white, and multiracial people.[5] (See Figure 1.) Latino people experience particularly high uninsured rates –two to three times the rates experienced by Asian, white, and multiracial groups. (Unless otherwise specified, data in this report are for people under age 65, since the vast majority of people aged 65 and over are covered by Medicare.)

Uninsured rates fell across all racial and ethnic groups from 2010 to 2022, and disparities in uninsured rates narrowed, but the patterns of racial inequities in health coverage have persisted. (See Figure 2.). A marked decline in uninsured rates occurred from 2014 through 2016 during large-scale implementation of the ACA’s major provisions.

Progress stalled and uninsured rates rose slightly beginning in 2017 and through 2019, in part due to the repeal of the individual mandate and Trump-era policies that took aim at the Affordable Care Act and made health coverage through the ACA marketplaces less affordable.[6] The Trump Administration also depressed enrollment in the ACA marketplaces by reducing funding for outreach and enrollment assistance[7] and by pursuing harsh immigration-related policies that deterred some people from enrolling out of fear and confusion.[8]

Between 2019 and 2022, uninsured rates fell again and the overall uninsured rate reached a record low. This is largely thanks to federal relief provisions that spurred record levels of Medicaid and ACA marketplace enrollment, which included a temporary requirement to keep people enrolled in Medicaid, greater financial assistance to help people afford marketplace coverage, and dramatically increased funding for outreach and enrollment assistance.[9]

Figure 2
Uninsured Rates Fell Across Racial and Ethnic Groups Between 2010 and 2022
Rates shown among people up to age 64

Note: Rates can vary greatly among subgroups within these categories. We describe some of the data for Asian and Latino subgroups below. Estimates are for people up to age 64, in non-institutionalized settings. See Appendix II for details.

Source: CBPP analysis of American Community Survey, 2010-2022

Challenges in Collecting Adequate Race and Ethnicity Data

Before discussing the data on racial and ethnic subgroups, it is worth noting the challenges to collecting such data, along with some potential ways to meet those challenges. While it is true that health coverage rates vary across racial and ethnic groups, limiting analysis to broad racial categories — as is often the practice — can conceal the diverse experiences of communities within them. Disaggregating race and ethnicity into smaller groups could improve response rates on race/ethnicity questions, shed further light on health inequities, and uncover community needs.[10]

Reasons that data are often not disaggregated into racial and ethnic subgroups can include sample sizes that are too small for precise estimation, concerns over privacy and surveillance, and the risk that users of the data will misattribute differences between groups and not account for the context of inequities such as racism, discrimination, and other structural barriers to opportunity.[11] The Office of Management and Budget (OMB), which sets national race and ethnicity reporting standards, cites a lack of consensus in terminology as an additional barrier to adding racial and ethnic categories to the minimum federal reporting requirements.[12]

Standard race and ethnicity options do not always align with the way that individuals self-identify, leading to high rates of non-response to the questions or the selection of the “some other race” option.[13] “Some other race” responses are often excluded from data analyses and reporting.[14] OMB recommends that questionnaires include options for locally relevant race and ethnicity groups so that respondents are more likely to find their own identity reflected as an option.[15] Additionally, a single category labeled “multiracial” or “more than one race” may mask valuable information that could be used in analyses.[16] Racial data captured in the 2020 census show that 87 percent of white Americans, 88 percent of Black Americans, and 83 percent of Asian Americans are classified as one race alone, but only 39 percent of American Indians and Alaska Natives are classified as one race alone.[17] This is, in part, an effect of the complex legacy of colonization.

Disaggregating American Indian and Alaska Native data poses unique challenges and requires significant resources. AIAN data are often aggregated in research, if included at all.[18] Federal agencies and other entities cite several reasons why Native people are excluded in data, including costs and other challenges to recruit a large enough sample given the relatively small, diverse, and geographically dispersed nature of the AIAN population.[19] Additionally, roughly one-third of the AIAN population lives in hard-to-count census tracts.[20] Past census undercounts have not only denied representation in non-tribal governments to hundreds of thousands of Indigenous citizens, but have limited appropriations for resources including infrastructure, housing, education, and community development programs administered by tribal governments.[21] Even surveys with a sufficient sample size to include and disaggregate AIAN data may not disaggregate the data in a way that is useful. Potentially useful methods of disaggregation include by tribal nation, geography (such as on- or off-reservation or by region), or group membership status (enrolled or non-enrolled tribal member).[22] Additionally, tribes have sovereignty over data collected from their citizens. As such, the collection of tribal-level data requires approval from tribal governments.[23]

OMB recently updated its race and ethnicity standards for federal agencies to better align with available evidence.[24] Among the major changes, the new standards add Middle Eastern or North African (MENA) as a minimum category. The new standards also incorporate a Hispanic or Latino category into a single combined question for race and ethnicity instead of the previous standard of a separate question for race and another question for Hispanic or Latino ethnicity.[25] Finally, the new standards require federal agencies to disaggregate beyond the minimum categories unless they receive an exemption. Federal agencies will have up to five years to comply.

While there has been some progress toward improved data disaggregation practices, further improvement requires political will, resource investment, and unified effort.[26] Lack of visibility and representation in data renders the needs of racial and ethnic subgroups difficult to meet. Without reliable disaggregated data, the success of efforts to reduce inequity cannot be sufficiently measured or monitored. Substantial missing data, undercounting, and inconsistent response rates are common for race and ethnicity data. During 2024’s open enrollment period for the ACA marketplace, for example, nearly half of enrollees’ races and ethnicities were unknown.[27]

Agencies can take measures to encourage responses, such as allowing for the selection of a “decline to answer” option and making the question mandatory, providing clear explanation of the uses of such data collection, improving question format, and leveraging other data sources for estimation. Several states have adopted promising practices in race/ethnicity data collection.[28] New York found such efforts resulted in a 20 percent increase in response rates on race/ethnicity questions.[29]

Variation Within Racial and Ethnic Groups

The data used for this report come from the Census Bureau’s American Community Survey (ACS). The ACS is well suited for providing tabulations by race and ethnicity because it is the largest survey of U.S. households (over 3 million people are in the survey each year), it is nationally representative and has a relatively high response rate, and it contains detailed breakdowns of race and ethnicity. (See Appendix II for methodology.) The data in this report do not include people living in the U.S. Territories, such as Puerto Rico, only people living in the states and the District of Columbia.

Disaggregated analysis reveals the diversity of uninsured rates within racial and ethnic subgroups. Many factors contribute to a person’s insurance status, including socioeconomic status, immigration rules and experiences, English language proficiency, and state laws and processes that limit or bolster access to Medicaid for those who need it.

Asian Subgroups

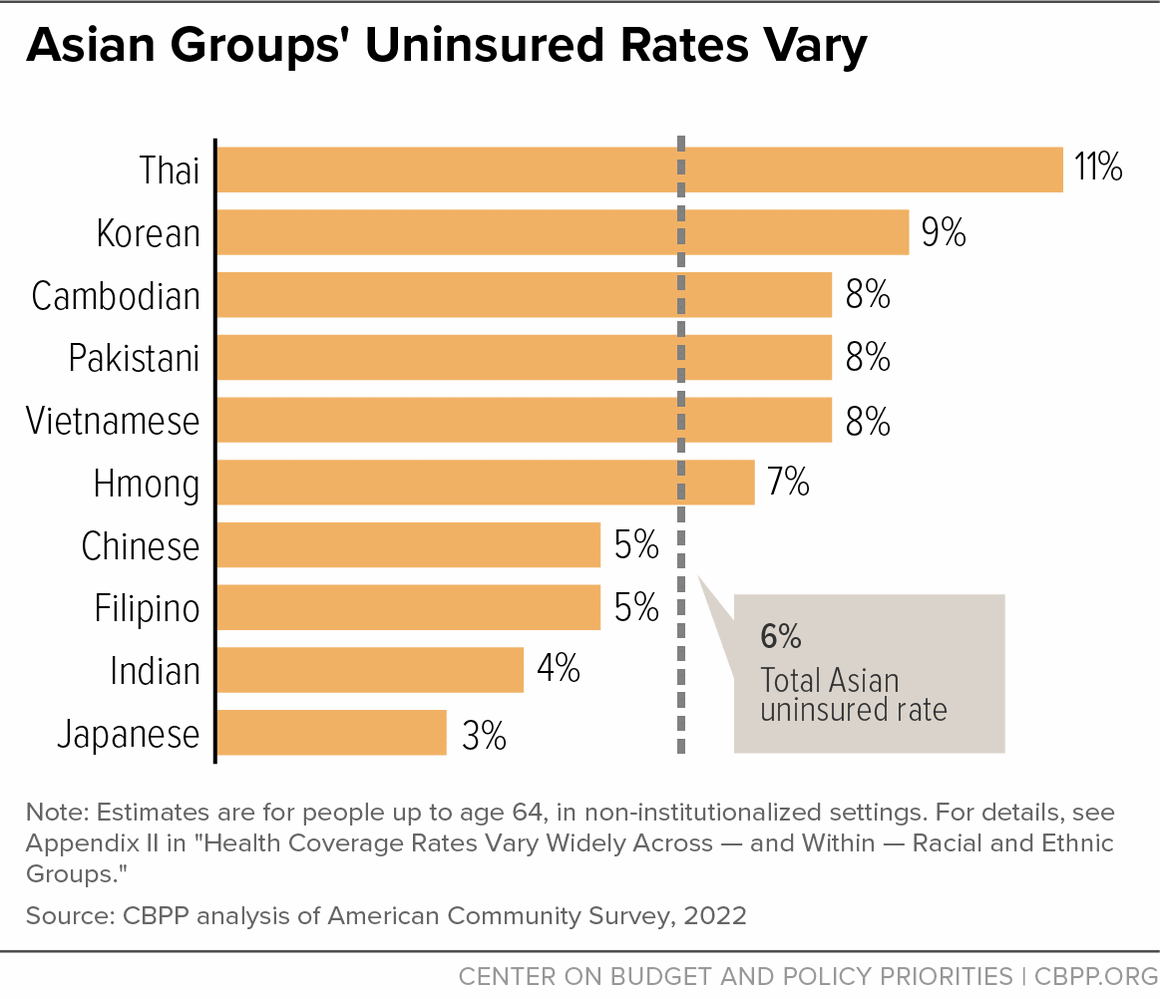
Uninsured rates among Asian subgroups fell between 2010 and 2022, reflecting the coverage gains experienced nationwide as a result of policies enacted in the ACA. (See Figure 3.)

Based on their overall uninsured rate — 5.9 percent, lower than any other broad racial group — one might assume that Asian people face relatively low barriers to health coverage. But uninsured rates vary more than threefold across even just the ten Asian countries of origin with the largest U.S. populations, and much more when smaller population groups are included. (See Figure 3 and Appendix Table 3.)

Disparate impacts of current and historical immigration policy as well as distinct sociopolitical histories factor into the varied rates of citizenship, English language proficiency, and income levels of Asian subgroups, all of which contribute to the likelihood of having health coverage. For example, differences among subgroups can be explained, at least in part, by employment and income.[30] Immigrants engage in self-employment and entrepreneurship more than people born in the U.S,[31] and self-employed workers are less likely than other workers to have health coverage.[32] Vietnamese and Korean people are more likely to be self-employed than other Asian subgroups.[33]

Differences in uninsured rates also relate to the circumstances under which members of different groups immigrate. For example, people who immigrated from India are far more likely than other immigrant groups to have immigrated through employment-based pathways and not as refugees or asylees.[34] In contrast, a large share of Cambodian people in the United States entered as refugees between 1975 and 1994, a period marked by devastating civil wars that killed a large share of the population in Cambodia, especially those with higher education and incomes.[35] The median household income of Indian people in the U.S. is 79 percent higher than the median household income of Cambodian people, and the uninsured rate of Indian people is 48 percent lower than that of Cambodian people. (See Appendix Table 1.)

Figure 4
Asian Groups' Uninsured Rates Fell Between 2010 and 2022
Rates shown among people up to age 64

Note: Estimates are for people up to age 64, in non-institutional settings. See Appendix II for details.

Source: CBPP analysis of American Community Survey, 2010-2022

Latino Subgroups

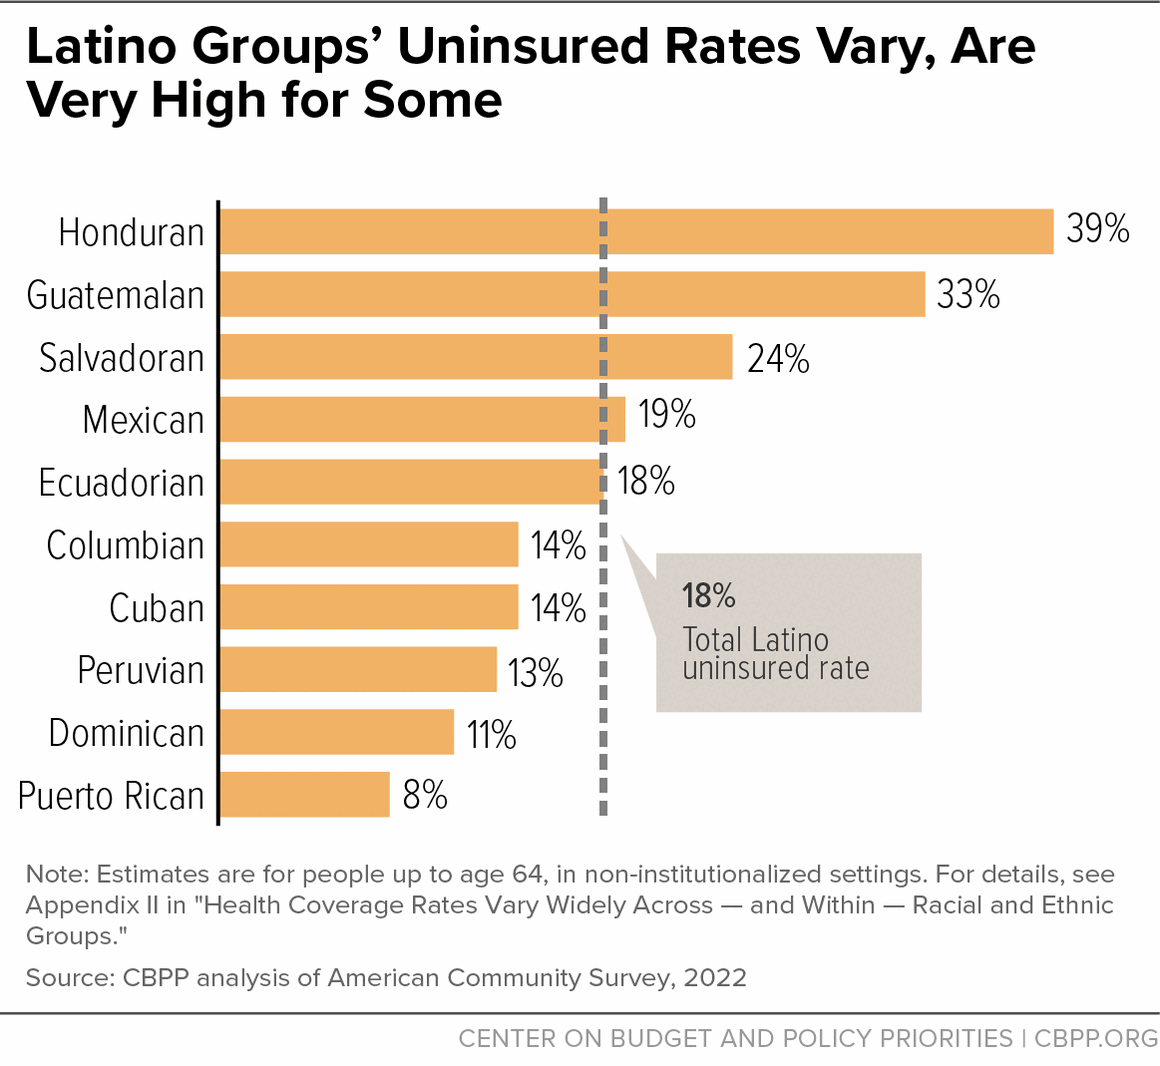
As with Asian subgroups, disaggregation of Latino health coverage data reveals diverse experiences. In 2022, the uninsured rate among Latino people was 17.8 percent, but subgroup rates varied fivefold among the ten countries of origin with the largest U.S. populations.[36] (See Figure 5 and Appendix Table 4.)

Puerto Rican people residing in U.S. states have a low uninsured rate relative to other Latino groups, likely due in part to Puerto Rico’s status as a U.S. territory, meaning its residents who are U.S. citizens don’t face immigration-related barriers to coverage. In contrast, people born in Central America’s “Northern Triangle” — El Salvador, Honduras, and Guatemala — often do not have a documented immigration status in the U.S., and therefore have less access to the educational and economic opportunities, and health insurance eligibility, associated with citizenship.[37] Many immigrated to flee violence, food insecurity, and natural disasters worsening with continued climate change[38] as well as displacement and economic instability.[39]

Like with Asian subgroups, uninsured rates among Latino subgroups fell between 2010 and 2022, but large disparities exist between subgroups. (See Figure 6.)

Figure 6
Latino Groups' Uninsured Rates Fell Between 2010 and 2022, But Remain High for Many
Rates shown among people up to age 64

Note: Estimates are for people up to age 64, in non-institutional settings. See Appendix II for details.

Source: CBPP analysis of American Community Survey, 2010-2022

The Data Suggest Reasons for Disparities in Uninsured Rates

Economic, demographic, and policy factors are correlated with differences in uninsured rates to varying degrees within racial and ethnic groups. Understanding these factors can shed light on ways to dismantle structural barriers to health coverage and eliminate inequities.

Immigration Restrictions Limit Coverage

As of 2022, people who immigrated to the U.S. make up nearly 14 percent of the nation’s total population.[40] Of the 46 million immigrants living in the United States, nearly 22 million are non-citizens.[41] People immigrate to the U.S. for diverse reasons, such as to reunite with family, pursue further education, accept employment, or to escape dangerous or oppressive circumstances, and a family’s reasons for immigration often affect their economic status and their access to health coverage.[42]

People without a lawful immigration status are generally not eligible to enroll in ACA marketplaces, Medicaid, or the Children’s Health Insurance Program (CHIP). Medicaid and CHIP also have strict immigration-related eligibility requirements that bar many people who have lawful immigration statuses from enrolling. To qualify for these programs, people must have a “qualified” immigration status, and many must have this status for five years before being eligible to enroll. For example, people with lawful permanent resident status[43] are barred from Medicaid and CHIP for five years after obtaining this status.[44]

Uninsured rates vary by immigrant group. Some 18 percent of immigrants who have a lawfully present status are uninsured, while half of immigrants without a documented status are uninsured.[45] An estimated 9.5 million immigrant adults are eligible for Medicaid based on income, but 45 percent (4.3 million) of these adults are ineligible due to the restrictive immigration-related requirements.[46] Latino people are heavily represented among income-eligible immigrants who are excluded from Medicaid because they do not have a documented immigration status, making up 76 percent of the group. Asian people are the most represented racial or ethnic group excluded from Medicaid among both people with lawful permanent resident status (who face a five-year bar from Medicaid) as well as foreign-born non-immigrants and people with non-immigrant visas (such as a Student Visa or Domestic Worker Visa), making up 38 percent and 57 percent of the groups, respectively.[47]

Immigration-related barriers to health coverage go beyond Medicaid and the ACA marketplace. Structural racism in current and historic immigration policy systematically denies health coverage to immigrants. Because employers cannot legally hire people who are undocumented, many are relegated to work in the underground economy,[48] where they face exploitation and have few pathways to better employment.[49] Immigrants who are not citizens are often employed in low-wage jobs and industries that don’t offer employer-sponsored coverage, and are less likely to be able to afford employer-sponsored coverage when it is available.[50]

Immigration status is a strong predictor of whether a person has health coverage. In a 2023 survey, 50 percent of immigrant adults who are undocumented and 18 percent of lawfully present immigrant adults reported being uninsured, compared to 6 percent of naturalized citizen and 8 percent of U.S.-born citizen adults.[51] The Urban Institute estimates that 5.7 million uninsured non-citizens would become eligible for Medicaid, CHIP, or marketplace premium tax credits if immigration-related restrictions were lifted.[52]

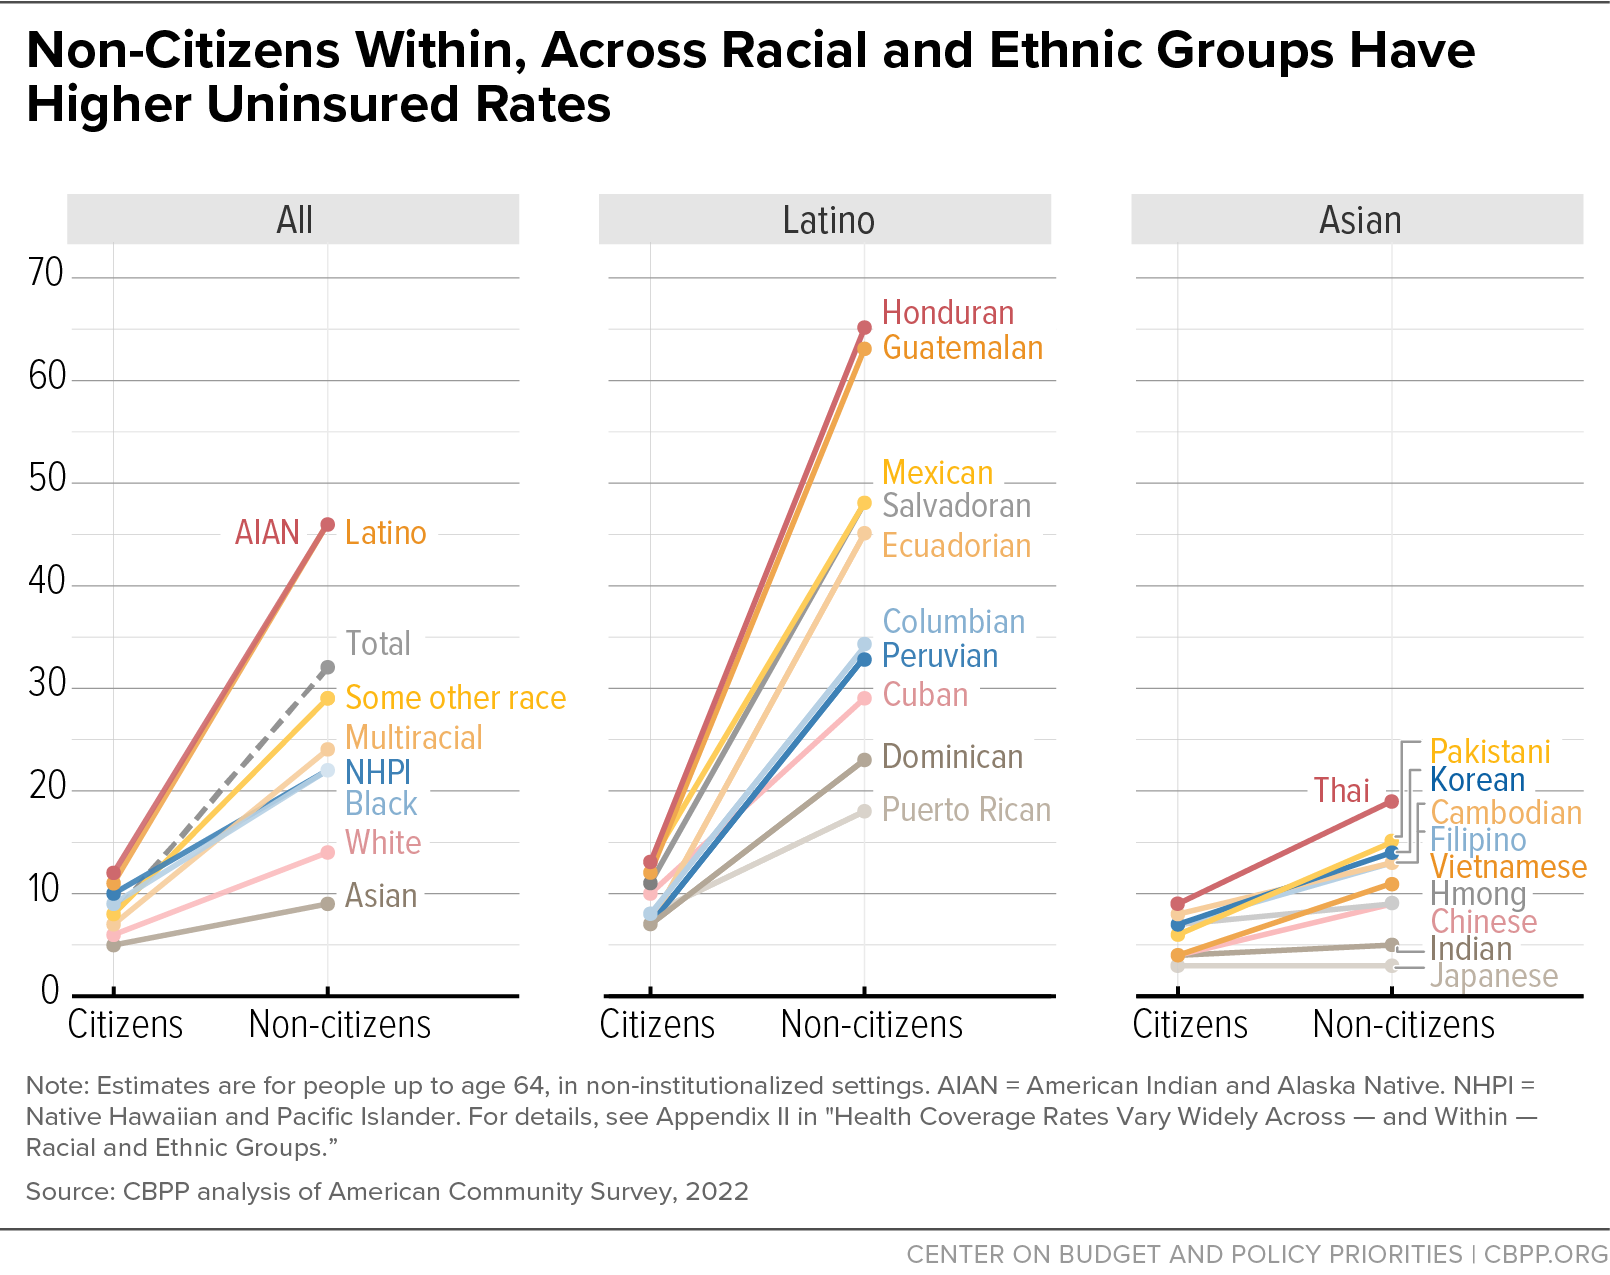
Within each broad racial group, non-citizens are more likely to be uninsured than citizens. (See Figure 7.) The difference in uninsured rates between citizens and non-citizens is especially stark among Latino people. Citizenship is likely an important factor behind variation in uninsured rates by subgroup: the percent of people not having citizenship ranges from 1 percent for Puerto Rican people to 50 percent for Honduran people.[53] (See Appendix Table 7.)

Following the ACA’s implementation, the uninsured rate among immigrants fell along with that of the total population. But from 2016 to 2019, the uninsured rate of immigrants rose more than the uninsured rate of U.S.-born persons. The disproportionate rise in the uninsured rate among immigrants coincided with reduced funding for marketplace outreach, which often includes immigrants as a target population for enrollment assistance.[54] In addition, the Trump Administration’s harsh anti-immigrant rhetoric and policy pursuits created an atmosphere of fear for immigrants and their families. In particular, the Trump Administration’s changes to “public charge” policies that determine whether someone may enter and/or become a lawful permanent resident of the U.S. caused people to forgo health benefits for which they were eligible, due to concern over their ability — or their family members’ ability — to come to or stay in the U.S.[55]

The Biden Administration ended the Trump Administration’s public charge rule and issued new rules that largely reflect decades of precedent.[56] However, some immigrants and their family members continue to fear public charge and other immigration policies, and as a result, many continue to avoid public benefits due to immigration-related concerns.[57]

Some states have adopted policies that are more inclusive of immigrants. States have the option to use a less restrictive immigration-related eligibility standard — lawfully residing — for enrollment of children and/or people who are pregnant in Medicaid and CHIP.[58] (As of March 2024, 37 states have taken this option for children and 30 for people who are pregnant.) States also have the option to provide CHIP coverage regardless of immigration status to people who are pregnant (22 states provide this coverage).[59] Some states also use state-only funding to provide coverage to groups who cannot be covered under the strict federal immigration-related restrictions (12 states have done so for children and 11 for parents and/or other adults).[60] Connecticut extended state-funded full Medicaid coverage to children and pregnant people from households with low incomes regardless of immigration status. California and Illinois built on previous state-funded Medicaid expansions by extending coverage to seniors with low incomes without imposing an immigration-related eligibility requirement.[61] In 2023, Oregon extended state-funded Medicaid coverage without regard to immigration status.[62] California did so beginning in 2024 and Minnesota will do so through its MinnesotaCare program in 2025.[63]

Medicaid Expansion Boosts Coverage and Narrows Inequities

The ACA extended Medicaid coverage to adults with incomes up to 138 percent of the federal poverty level, with subsidized marketplace coverage available to those with higher incomes.[64] However, the Supreme Court allowed states to choose whether to enact the ACA Medicaid expansion. In the ten states that haven’t adopted expansion, more than 1.6 million uninsured adults are in the Medicaid coverage gap.[65] Adults in this gap don’t qualify for Medicaid under their states’ rules, because their states have not enacted the expansion — or for subsidized health insurance coverage in the ACA marketplaces, because their incomes are below the federal poverty level (the minimum level to qualify for marketplace subsidies).

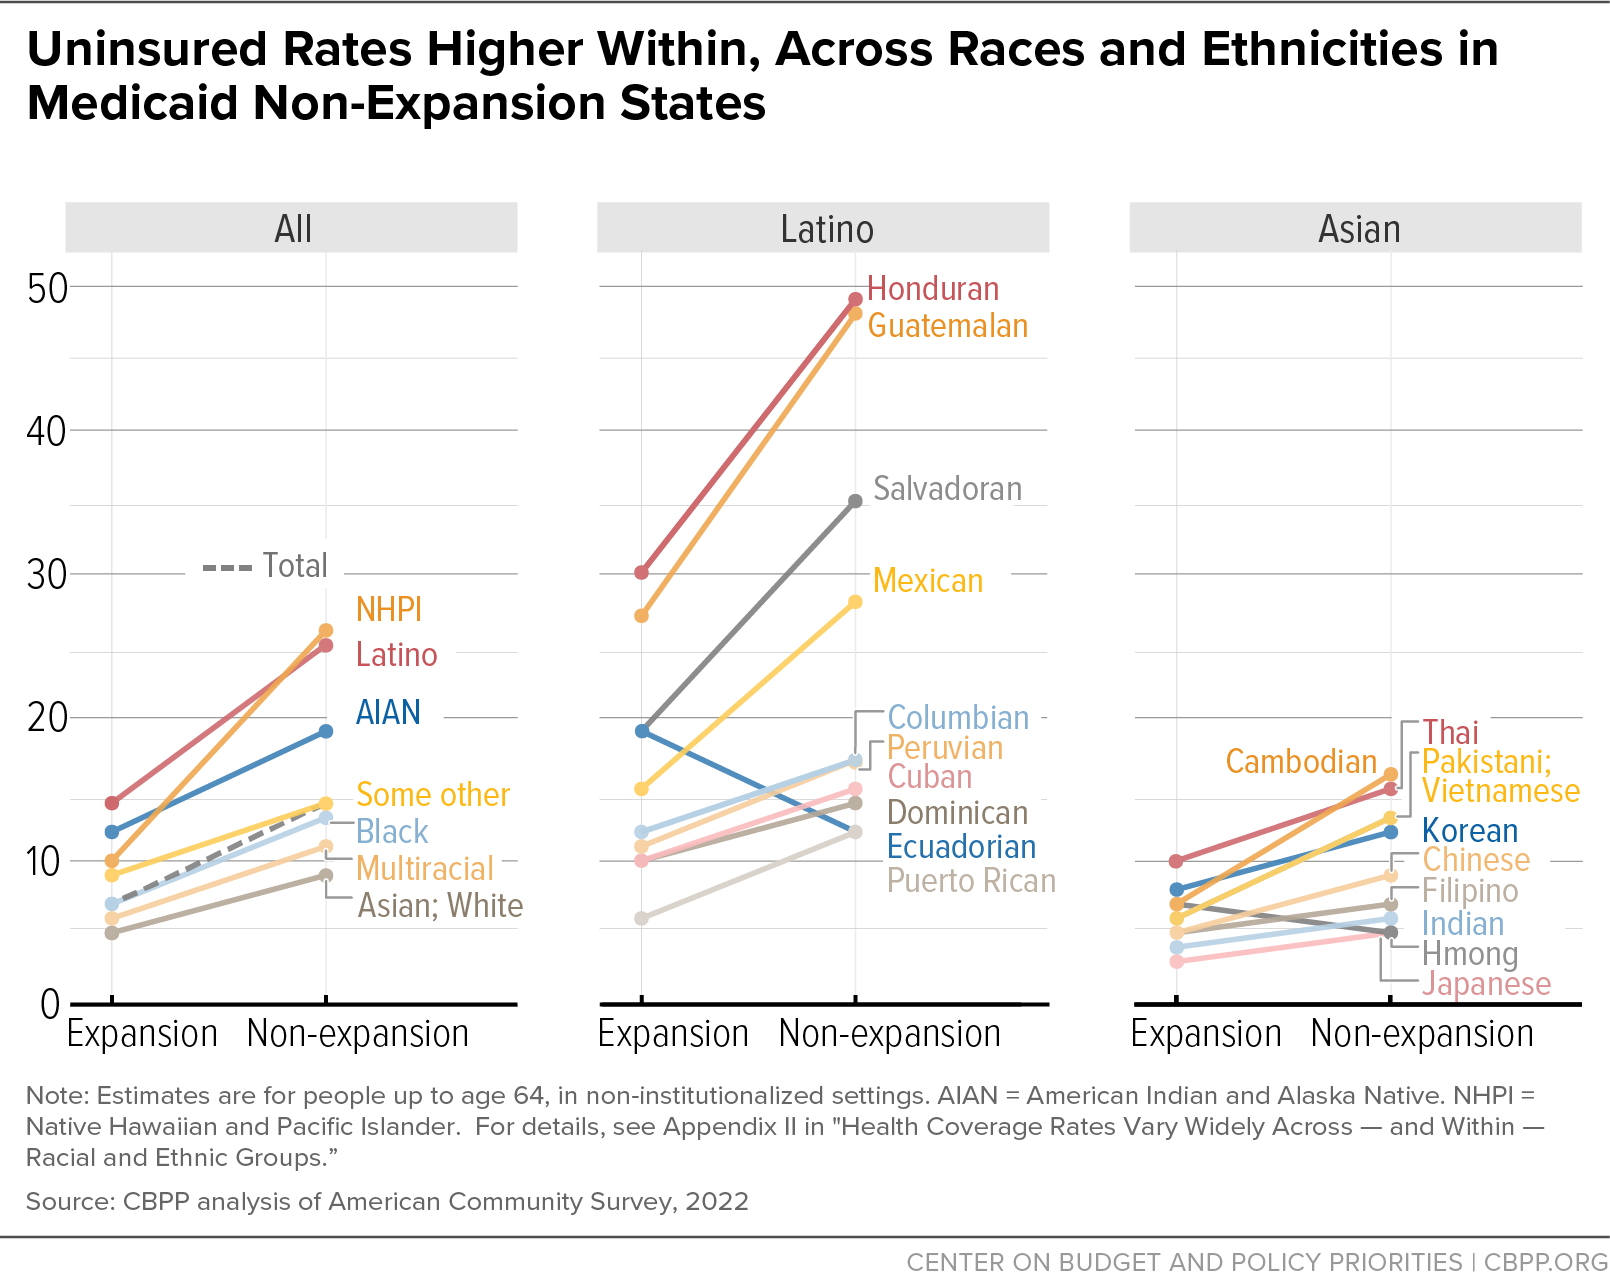
The uninsured rate among low-income adults under age 65 fell from 35 percent in 2013 to 15 percent in 2022 in states that had expanded Medicaid. In non-expansion states, the uninsured rate among this group fell much more modestly, from 44 percent in 2013 to 30 percent in 2022.[66] Adults of all racial and ethnic groups experience higher rates of coverage in Medicaid expansion states, and there is evidence of narrowed inequities between groups in coverage and access after expansion.[67] (See Figure 8.)

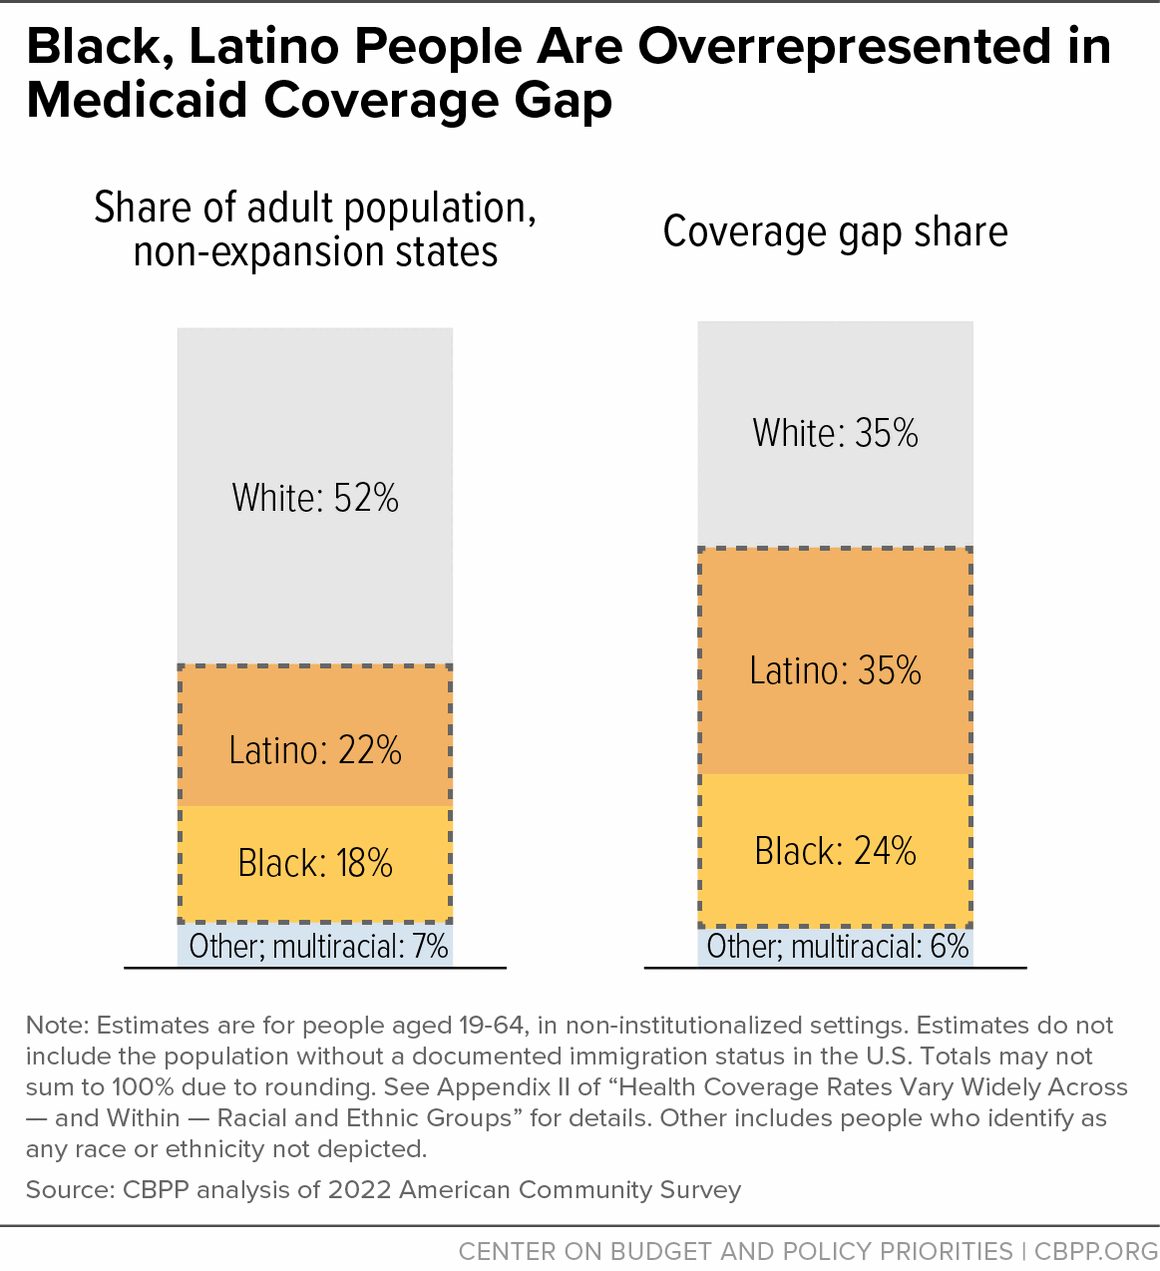
The effects of states’ decisions not to expand Medicaid vary among and within racial and ethnic groups.[68] For example, Black people have relatively high uninsured rates and are disproportionately in the coverage gap in part because they disproportionately reside in non-expansion states: 45 percent of Black people under age 65 live in non-expansion states, compared to the 31 percent share of the total population under age 65 living in those states. (See Appendix Table 1.) However, even within non-expansion states, Black and Latino people are overrepresented in the coverage gap. (See Figure 9.)

Medicaid coverage is critical for eligible American Indians who have no insurance or who rely on the Indian Health Service (IHS). While IHS provides health care to eligible American Indians and Alaska Natives at no cost, it is not health insurance and is chronically underfunded through yearly budgets appropriated by Congress.[69] Additionally, the majority of American Indians and Alaska Natives live in urban areas not served by IHS.[70] AIAN people who are enrolled in Medicaid do not need to pay premiums or enrollment fees. And IHS, Tribal, and Urban Indian (ITU) providers can receive reimbursement for services provided to AIAN patients enrolled in Medicaid managed care, regardless of whether the ITU provider is in a Medicaid managed care plan’s network.[71]

Medicaid expansion has recently boosted the coverage rates for American Indians and Alaska Natives. Before expanding Medicaid in July 2021, Oklahoma was home to among the country’s largest uninsured AIAN population.[72] Of the approximately 243,000 Oklahomans who were enrolled under expansion in February 2024, over 40,000 (1 in 6) were American Indian.[73] More recently, South Dakota expanded Medicaid on July 1, 2023, and there is likely to be meaningful improvement to AIAN health coverage in the state, given that about 1 in 3 uninsured South Dakotans identify as AIAN.[74] As of February 2024, 37 percent of South Dakotans enrolled under Medicaid expansion were American Indians or Alaska Natives.[75]

Latino Subgroups

For Latino people, Medicaid serves an important role for health coverage because, although their rate of employment is roughly average among the adult population, they are substantially less likely to receive employer-sponsored health coverage.[76] The uninsured rate varies among Latino subgroups, but for nearly every subgroup, it is substantially lower in expansion states. (See Figure 8.) However, expansion status likely has a bigger impact on the uninsured rates for some subgroups than others: 73 percent of Cuban people live in non-expansion states compared to 17 percent of Ecuadorian people. (See Appendix Table 1.)

Asian Subgroups

In addition to having higher than average median household incomes, the ten most populous Asian subgroups are all more likely than average to live in expansion states, though there is still large variation among subgroups.[77] (See Appendix Table 1). For example, 29 percent of Vietnamese people live in non-expansion states compared to 11 percent of Japanese people. Across nearly all Asian subgroups, coverage rates are higher in expansion states than in non-expansion states.

Affordability

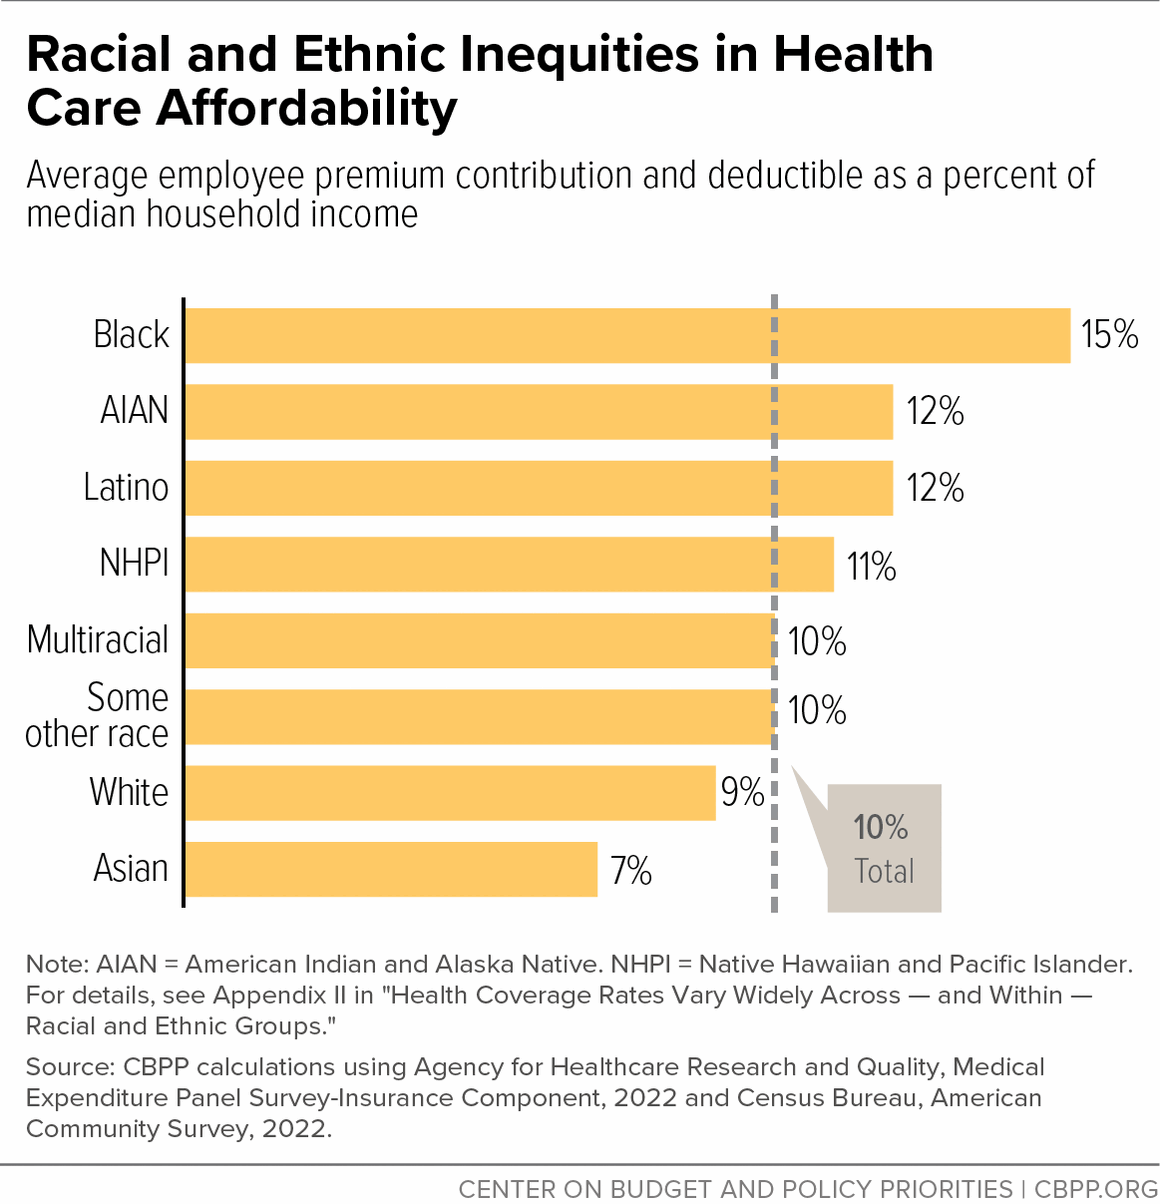
Inability to pay for coverage remains the leading reason uninsured people cite when asked why they lack health coverage: in 2022, 64 percent of uninsured adults said they were uninsured because coverage was not affordable.[78] Most insured people — 57 percent in 2022 — had coverage through their employer.[79] But low-paid workers typically get less employer help with their premiums, are offered less robust coverage, and must pay a greater share of their income toward health care costs compared to higher-income workers. Employee premium contributions and deductibles accounted for about 10 percent of median household income on average in 2022, not including additional out-of-pocket costs such as co-pays and co-insurance, and the burden of these premium costs and deductibles varies greatly among racial and ethnic groups. (See Figure 10.)

Median household incomes are lower among Black people than other broad racial and ethnic groups. (See Appendix Table 11.) The unique harm caused by a history of enslavement along with persistent systemic racism contribute to comparatively low incomes and a relatively low rate of upward income mobility among Black households, and they manifest in residential segregation, labor market discrimination, and housing and educational inequities.[80]

Black workers are disproportionately employed in lower-paid industries such as accommodation and food service and underrepresented in higher-paid industries such as financial services. Income gaps between Black and white workers persist within companies, with Black employees underrepresented in executive roles and less likely to report being supported or sponsored at work for advancement opportunities.[81]

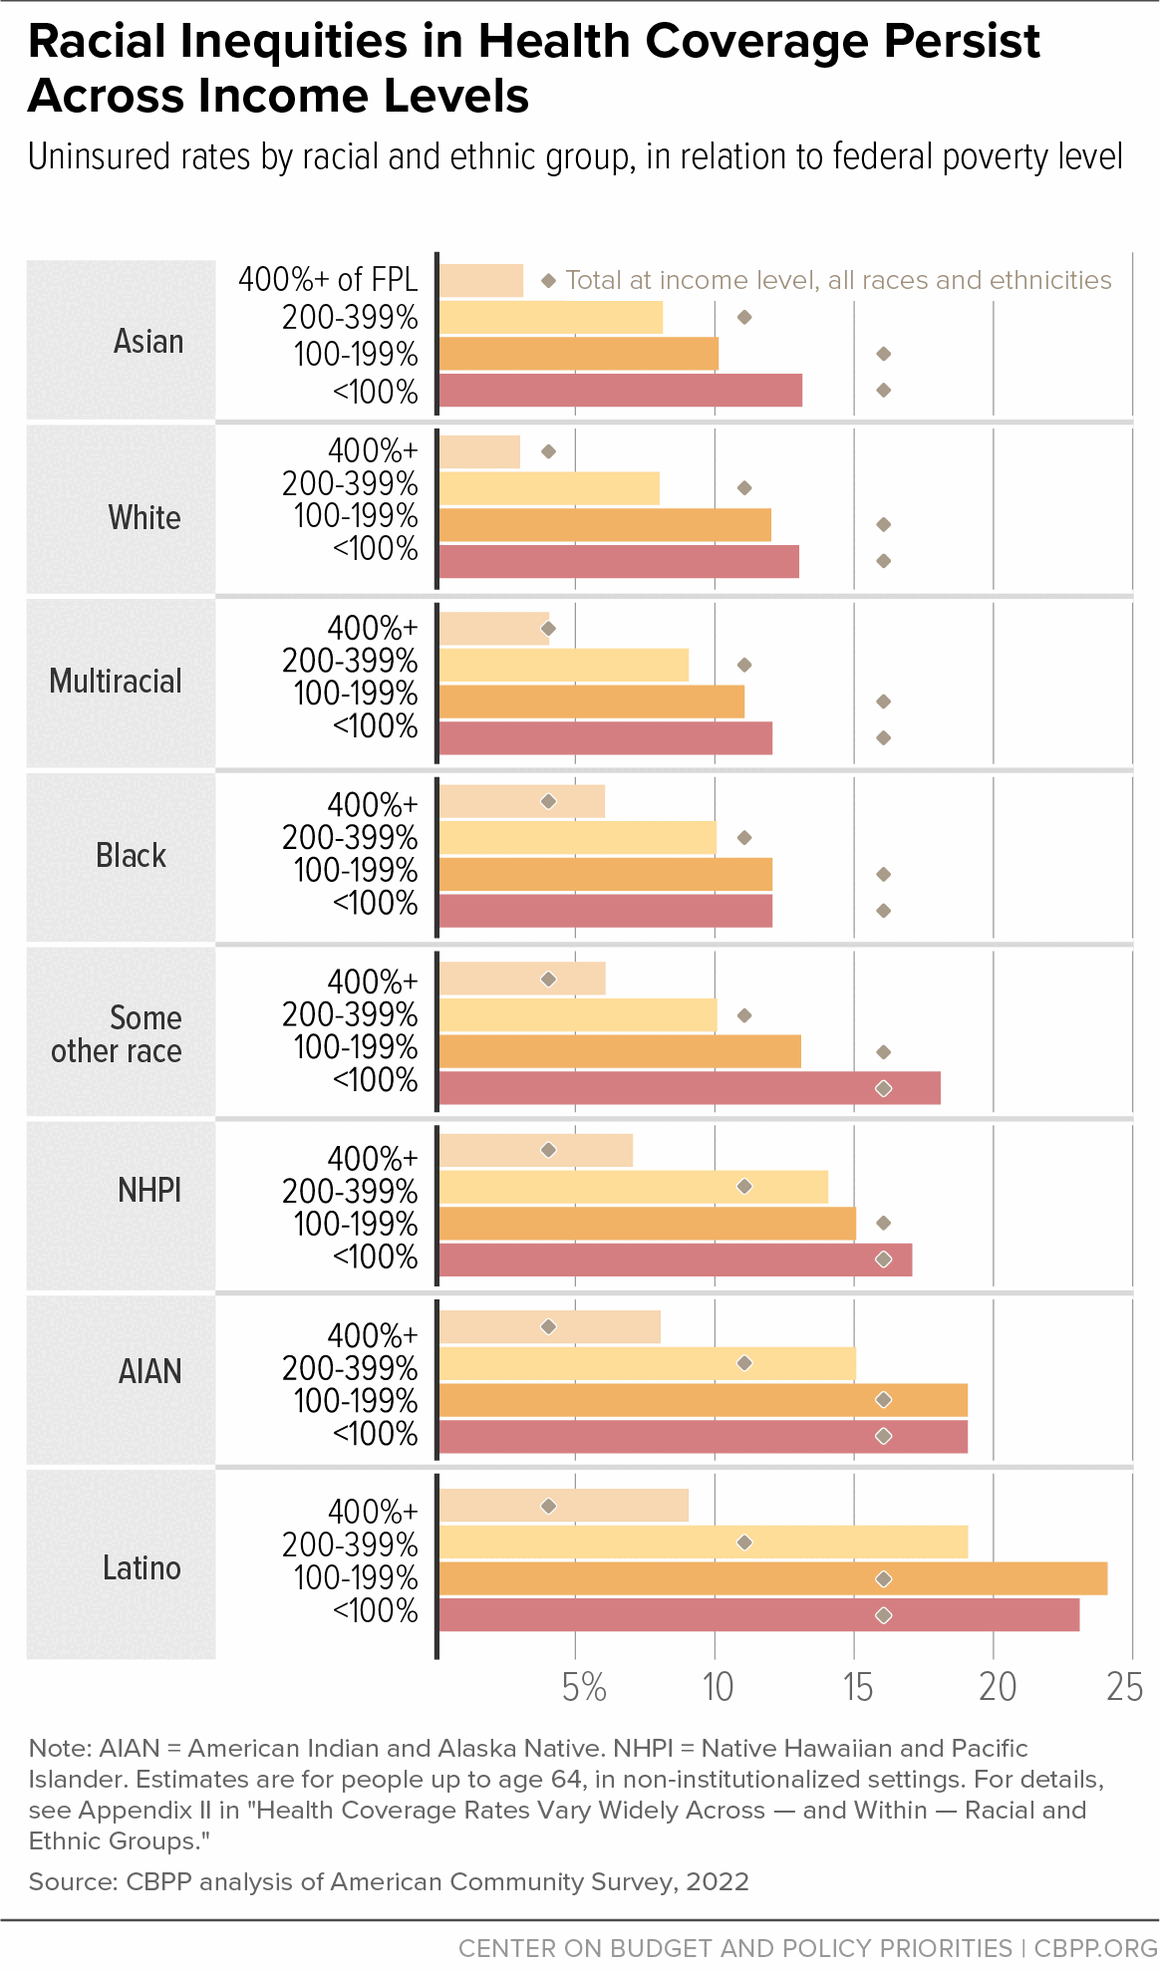
Due in large part to the lack of affordability of private coverage, uninsured rates are higher for people with lower household incomes, though inequities exist across income levels. (See Figure 11.)

Improving health insurance affordability could reduce inequities in health coverage. The American Rescue Plan increased premium tax credits in the marketplace for 2021 and 2022, and the Inflation Reduction Act extended these enhancements through 2025. Marketplace enrollees who signed up during open enrollment saw their average monthly premium costs fall by 32 percent from 2021 to 2024.[82] Partly as a result of premium tax credit increases, a record 21.4 million people enrolled in marketplace coverage for 2024, up 79 percent from the 12 million people who enrolled for 2021, prior to the enhancements.[83] A Department of Health and Human Services study imputed missing race and ethnicity data for marketplace enrollment through the Healthcare.gov platform and found that Latino, Black, and AIAN people saw enrollment increases of 84, 83, and 45 percent, respectively, between 2021 and 2023. Enrollment gains for white and Asian American, Native Hawaiian, and Pacific Islander (AANHPI) people were 31 and 18 percent, respectively.[84] Breakdowns by subgroup are not available.

Administrative Burdens in the Eligibility Process

About a quarter of uninsured people are eligible for Medicaid, but perceptions of ineligibility, confusion about how to apply, and what is sometimes a complex application process deter many of them from enrolling.[85] These administrative burdens disproportionately impact people of color.[86] State and local governments have opportunities to reduce burdens by, for example, using data sources to verify eligibility, communicating via text message, and reducing verification requests.[87]

Administrative burdens are also a barrier to selecting optimal coverage in the marketplace. Many ACA marketplaces create complex choice environments where consumers are likely to select a plan that does not meet their health or affordability needs.[88] Some consumers remain uninsured due to difficulty navigating the application process. Additionally, people without internet in the home face additional application burdens that could dissuade application and enrollment in the online marketplaces.[89] Black and Latino adults are less likely than white adults to report owning a traditional computer or having high-speed internet at home.[90]

In 2022, 22 percent of uninsured people said they lacked coverage because signing up was too difficult or confusing, and 19 percent said that they could not find a plan to meet their needs.[91]

Outreach and Enrollment Assistance

More than 1 in 3 people who were uninsured in 2022 were eligible for subsidized marketplace coverage, in addition to the 1 in 4 who were eligible for Medicaid or CHIP.[92] Many of the remaining uninsured, even those who are eligible for generous subsidies or free coverage through Medicaid, don’t believe they can afford health insurance.[93]

Few people have a complete understanding of health insurance terms and details.[94] People without a strong understanding of health insurance terminology have greater difficulty accessing medical care and avoiding administrative hassles.[95] Familiarity with health insurance terminology is disproportionately low among Latino, Black, and AIAN people.[96] Lack of trust in the health care system is also a common barrier to enrollment.[97] Factors that fuel medical mistrust, particularly among Black patients and other patients of color, include experiences of discrimination in health care and undertreatment by providers.[98] Black people do not receive the same quality of care from their health providers that their white counterparts receive, which contributes to poorer health outcomes and shorter lives.[99] Additionally, the medical establishment has a long history of mistreating Black people through both neglect and inhumane medical experimentation.[100]

Outreach has proven effective in bolstering coverage.[101] For example, the Centers for Medicare & Medicaid Services (CMS) estimated that outreach drove a full 37 percent of HealthCare.gov enrollment during the open enrollment period for 2017.[102] And Kentucky’s television advertising was responsible for 40 percent of unique website visitors and web-based applications in the state’s marketplace in 2014 and 2015.[103]

Another way to boost enrollment and build trust is through Navigators: people who raise awareness about the availability of marketplace plans, help people apply for federal subsidies, provide impartial information about plan options, provide language assistance, and help consumers with other important issues, including filing appeals and submitting documentation to prove their eligibility.[104] Navigators can help simplify what many find to be a complex enrollment process, making health coverage more accessible and plan selection more consumer friendly.

The Trump Administration reduced Navigator funding by 84 percent, contributing to the erosion of coverage during its term.[105] The Biden Administration reversed course, making historic investments in enhanced outreach efforts and one-on-one consumer assistance which, along with other policy changes, coincided with increased rates of health coverage.[106]

AAPI people enroll in health plans through the marketplace at disproportionately high rates. In 33 states using HealthCare.gov during the 2023 open enrollment period for ACA marketplace coverage, AAPI people constituted 7.6 percent of health plan selections but only 4.1 percent of the population in those states.[107] High enrollment in marketplace plans is likely partially attributable to the efforts of non-profits that serve Asian Americans and provide tailored enrollment assistance.[108] Although AAPI people enroll in marketplace coverage at a high rate, considerable variation exists among AAPI subgroups: in 2022 survey data, the share of Vietnamese people with subsidized marketplace coverage was more than five times that of Hmong people, for example.[109]

Language Access

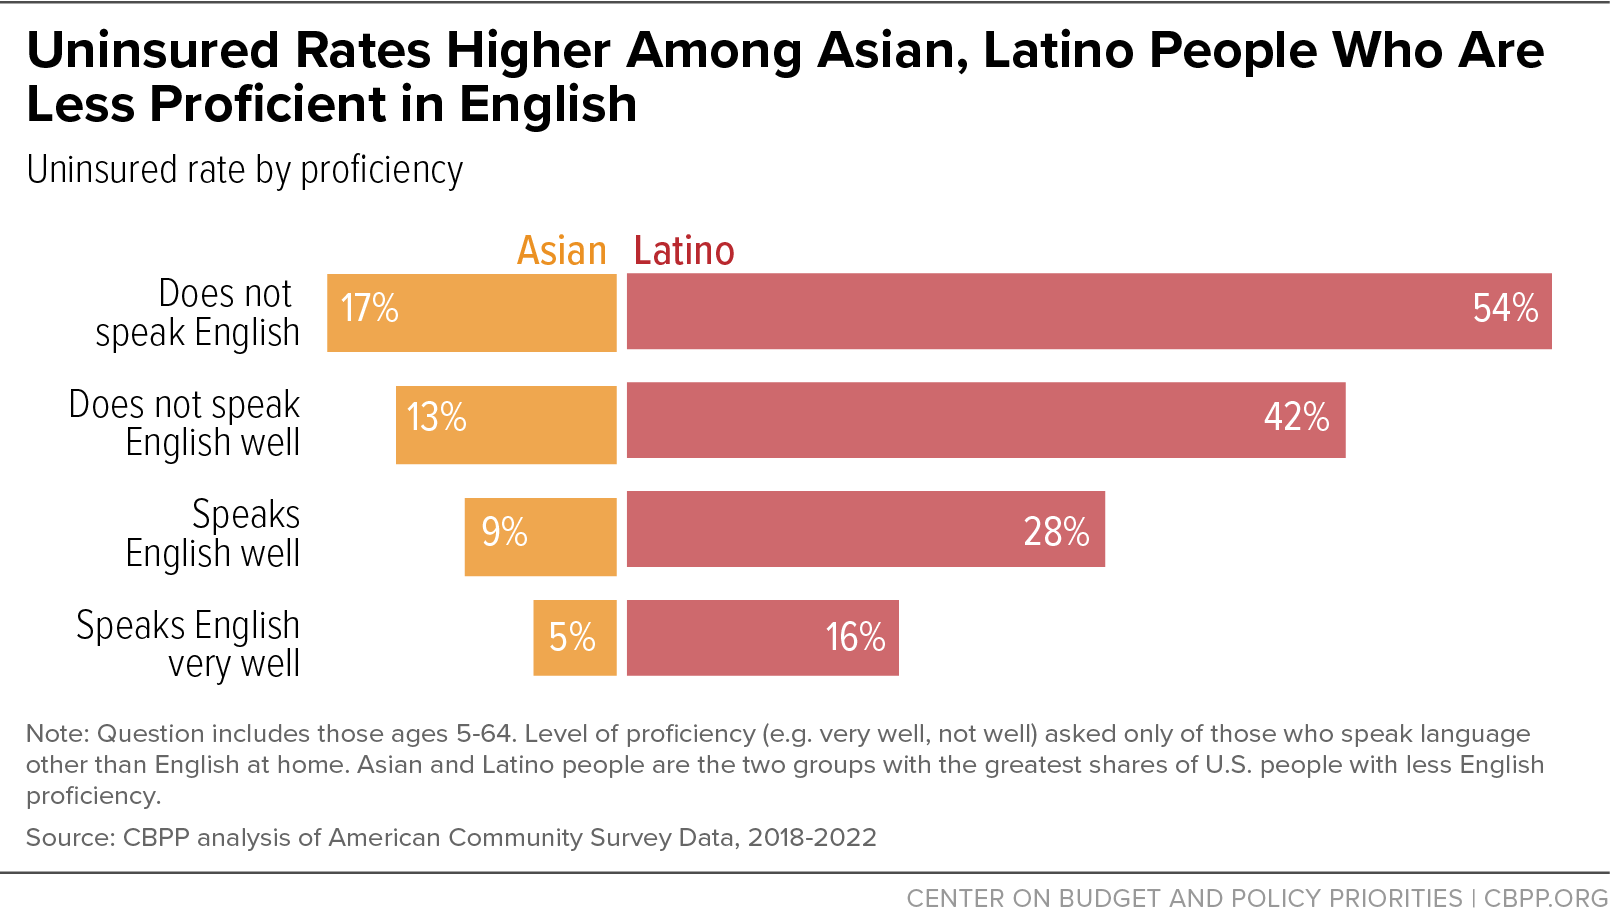
The United States is home to immense language diversity and has been since its founding.[110] More than 1 in 5 people in the U.S. speak a language other than English at home.[111] Federal law, including provisions of the ACA, protects people with limited English language proficiency by requiring meaningful access to federally funded programs and prohibiting discrimination on the basis of national origin. But language barriers to coverage remain.[112] Lower English language proficiency is highly correlated with uninsured rates across groups, but language access potentially plays a bigger role for Latino and Asian groups’ uninsured rates due to larger shares of these groups having less English proficiency. However, there is large variation among subgroups: 3 and 5 percent of Filipino and Puerto Rican people report not speaking English well or at all, compared with 19 percent of Vietnamese people and 30 percent of Guatemalan and Honduran people. (See Appendix Table 1.)

People who are more proficient in English have higher rates of health coverage among Latino as well as Asian populations. (See Figure 12.) This pattern is similarly evident for Asian and Latino subgroups as well as among broader racial and ethnic groups. (See Appendix tables 4-6.)

Given higher uninsured rates among those who do not speak English or do not speak it well, providing culturally and language-specific outreach and enrollment assistance, including through Navigators and advertising, is important for improving health coverage equity. Studies have found Spanish-language ads are more likely to mention enrollment assistance than English-language ads,[113] and relatively high enrollment rates within AAPI subgroups in marketplace plans may be partially attributable to insurance agents that offer enrollment assistance in Asian languages.[114] Where language access measures fail to provide in-language health insurance information, multilingual navigator services can help close the gaps.

Looking Ahead

Inadequate health coverage is one of the greatest barriers to accessing care, and the unequal distribution of coverage contributes to health inequities.[115] Racial health coverage inequities are less stark in states that have expanded Medicaid eligibility, and closing the Medicaid coverage gap is key to reducing these coverage inequities in non-expansion states, particularly among people with low incomes. The removal of barriers to coverage based on immigration status would provide people across racial and ethnic groups — and subgroups — improved access to the financial security and improved health outcomes that come with having health insurance.

Recent coverage gains in the ACA marketplaces show the promise of expanded outreach in spurring coverage gains among groups with high uninsured rates, and continued efforts can build upon those successes. Outreach and enrollment assistance, especially if language appropriate, can connect people who are uninsured with coverage they may not realize they are eligible for.

However, eligibility for coverage is not enough without improving affordability. The high cost of coverage remains the most frequently cited barrier to health insurance, and the affordability of health insurance varies tremendously across racial and ethnic groups. Making the Inflation Reduction Act’s marketplace subsidies permanent would improve access to health coverage in the long term. Combined policy efforts to improve availability, awareness, and affordability of coverage can move the United States closer to universal health coverage for all people and address racial and ethnic inequities.

Appendix I: Tables

Table 1
Selected Characteristics by Race and Ethnicity, 2022
 Uninsured rateMedian household income 
(thousands of $)
Share of whom live in state with no Medicaid expansionShare of whom don’t have U.S. citizenshipShare of whom don’t speak English or don't speak it well
Overall     
American Indian / Alaska Native     
Asian     
Black     
Latino     
Multiracial     
Native Hawaiian / Pacific Islander     
Some Other Race     
White     
Asian Groups
Cambodian     
Chinese     
Filipino     
Hmong     
Indian     
Japanese     
Korean     
Pakistani     
Thai     
Vietnamese     
Latino Groups
Colombian     
Cuban     
Dominican     
Ecuadorian     
Guatemalan     
Honduran     
Mexican     
Peruvian     
Puerto Rican     
Salvadoran     

Note: Estimates for language proficiency are for people aged 5-64 and combine years 2018-2022 to increase sample size. All other estimates are for people up to age 64, in non-institutionalized settings in 2022. See Appendix II for details.

Estimates are statistically different from the overall average at the 90 percent confidence level except for those with an asterisk (*).

Source: CBPP analysis of American Community Survey, 2018-2022

TABLE 2
Uninsured Rates by Racial/Ethnic Group, 2010-2022
 2010201120122013201420152016201720182019202020212022
American Indian and Alaska Native26%25%24%24%20%17%16%16%16%17%*15%14%
Asian17%17%16%16%11%8%7%7%7%7%*6%6%
Black20%19%19%19%15%12%11%11%11%11%*11%10%
Latino32%31%30%30%25%20%19%19%19%20%*19%18%
Multiracial14%14%13%13%10%8%7%7%8%8%*8%7%
Native Hawaiian and Pacific Islander18%17%18%18%14%10%11%11%9%13%*11%12%
Some Other Race21%21%19%21%16%13%12%12%13%14%*11%10%
White13%13%12%12%10%8%7%7%8%8%*7%7%
Total18%17%17%17%13%11%10%10%10%11%*10%9%

Note: Estimates are for people up to age 64, in non-institutionalized settings. See Appendix II for details.

Source: CBPP analysis of American Community Survey, 2010-2022

TABLE 3
Uninsured Rates Among Asian People, 2010-2022
 2010201120122013201420152016201720182019202020212022
Cambodian21%22%20%20%13%11%8%9%9%10%*11%8%
Chinese15%15%15%15%11%8%7%7%6%7%*6%5%
Filipino12%12%13%13%9%7%6%6%6%6%*6%5%
Hmong16%17%15%18%10%10%6%7%8%8%*7%7%
Indian12%13%12%10%7%6%5%5%4%5%*4%4%
Japanese8%9%9%9%7%4%5%4%6%4%*5%3%
Korean29%27%26%26%18%13%10%10%10%11%*9%9%
Pakistani23%23%24%22%18%14%11%10%10%9%*8%8%
Thai25%25%25%21%20%13%12%15%13%11%*14%11%
Vietnamese22%21%21%21%14%10%8%9%8%9%*8%8%

Note: Estimates are for people up to age 64, in non-institutionalized settings. See Appendix II for details.

Source: CBPP analysis of American Community Survey, 2010-2022

TABLE 4
Uninsured Rates Among Latino People, 2010-2022
 2010201120122013201420152016201720182019202020212022
Colombian29%28%28%26%19%16%13%15%14%15%*14%14%
Cuban29%29%27%29%21%16%16%16%16%16%*14%14%
Dominican23%22%21%22%17%13%11%12%11%13%*10%11%
Ecuadorian38%34%32%33%27%23%20%19%18%18%*19%18%
Guatemalan49%47%44%46%40%35%34%33%35%35%*35%33%
Honduran51%47%46%46%42%38%39%36%38%39%*41%39%
Mexican35%33%33%32%27%22%21%20%20%21%*21%19%
Peruvian31%30%30%30%22%17%15%16%14%14%*13%13%
Puerto Rican16%15%15%15%12%9%8%9%9%9%*9%8%
Salvadoran41%39%39%38%31%26%23%25%25%26%*25%24%

Note: Estimates are for people up to age 64, in non-institutionalized settings. See Appendix II for details.

Source: CBPP analysis of American Community Survey, 2010-2022

TABLE 5
Uninsured Rates by Citizenship Status, 2022
 CitizenNon-Citizen
American Indian / Alaska Native12%46%
Asian5%9%
Black9%22%
Latino11%46%
Multiracial7%24%
Native Hawaiian / Pacific Islander10%22%
Some Other Race8%29%
White6%14%
Total8%32%

Note: Estimates are for people up to age 64, in non-institutionalized settings. See Appendix II for details.

Source: CBPP analysis of American Community Survey, 2022

TABLE 6
Uninsured Rates by Citizenship Status Among Asian People, 2022
 CitizenNon-Citizen
Cambodian8%13%
Chinese4%9%
Filipino4%11%
Hmong7%9%
Indian4%5%
Japanese3%3%
Korean7%14%
Pakistani6%15%
Thai9%19%
Vietnamese7%13%

*Estimates not reported due to insufficient sample size.

Note: Estimates are for people up to age 64, in non-institutionalized settings. See Appendix II for details.

Source: CBPP analysis of American Community Survey, 2022

TABLE 7
Uninsured Rates by Citizenship Status Among Latino People, 2022
 CitizenNon-Citizen
Colombian8%34%
Cuban10%29%
Dominican7%23%
Ecuadorian7%45%
Guatemalan12%63%
Honduran13%65%
Mexican13%48%
Peruvian7%33%
Puerto Rican8%18%
Salvadoran11%48%

*Estimates not reported due to insufficient sample size.

Note: Estimates are for people up to age 64, in non-institutionalized settings. See Appendix II for details.

Source: CBPP analysis of American Community Survey, 2022

TABLE 8
Uninsured Rates by Race/Ethnicity and State’s Expansion Status, 2022
 ExpansionNon-Expansion
American Indian / Alaska Native12%19%
Asian5%9%
Black7%13%
Latino14%25%
Multiracial6%11%
Native Hawaiian / Pacific Islander10%26%
Some Other Race9%14%
White5%9%
Total7%14%

Note: Estimates are for people up to age 64, in non-institutionalized settings. See Appendix II for details.

Source: CBPP analysis of American Community Survey, 2022

TABLE 9
Uninsured Rates by Race/Ethnicity and State’s Expansion Status Among Asian People, 2022
 ExpansionNon-Expansion
Cambodian7%16%
Chinese5%9%
Filipino5%7%
Hmong7%5%
Indian4%6%
Japanese3%5%
Korean8%12%
Pakistani6%13%
Thai10%15%
Vietnamese6%13%

Note: Estimates are for people up to age 64, in non-institutionalized settings. See Appendix II for details.

Source: CBPP analysis of American Community Survey, 2022

TABLE 10
Uninsured Rates by Race/Ethnicity and State’s Expansion Status Among Latino People, 2022
 ExpansionNon-Expansion
Colombian12%17%
Cuban10%15%
Dominican10%14%
Ecuadorian19%12%
Guatemalan27%48%
Honduran30%49%
Mexican15%28%
Peruvian11%17%
Puerto Rican6%12%
Salvadoran19%35%

Note: Estimates are for people up to age 64, in non-institutionalized settings. See Appendix II for details.

Source: CBPP analysis of American Community Survey, 2022

TABLE 11
Average Employee Premium Contribution and Deductible as a Percent of Median Household Income
 Median IncomeEmployee Contribution
American Indian/ Alaska Native$67,12012.1%
Asian$118,3006.9%
Black$54,20015.0%
Latino$70,00011.6%
Multiracial$78,20010.4%
Native Hawaiian / Pacific Islander$75,00010.9%
Some Other Race$78,20010.4%
White$93,8008.7%
Total$83,4009.8%

Note: See Appendix II for methodology.

Source: CBPP calculations using Agency for Healthcare Research and Quality, Medical Expenditure Panel Survey-Insurance Component, 2022; and Census Bureau, American Community Survey, 2022

TABLE 12
Average Employee Premium Contribution and Deductible as a Percent of Median Household Income Among Asian People
 Median IncomeEmployee Contribution
Cambodian$88,6009.2%
Chinese$115,7007.0%
Filipino$119,7006.8%
Hmong$87,6009.3%
Indian$159,0005.1%
Japanese$107,5007.6%
Korean$108,4007.5%
Pakistani$113,6007.2%
Thai$93,8008.7%
Vietnamese$94,9008.6%

Note: See Appendix II for methodology.

Source: CBPP calculations using Agency for Healthcare Research and Quality, Medical Expenditure Panel Survey-Insurance Component, 2022; and Census Bureau, American Community Survey, 2022

TABLE 13
Average Employee Premium Contribution and Deductible as a Percent of Median Household Income Among Latino People
 Median IncomeEmployee Contribution
Colombian$79,70010.2%
Cuban$78,20010.4%
Dominican$62,50013.0%
Ecuadorian$76,10010.7%
Guatemalan$62,50013.0%
Honduran$56,90014.3%
Mexican$69,80011.7%
Peruvian$79,60010.2%
Puerto Rican$64,70012.6%
Salvadoran$73,00011.2%

Note: See Appendix II for methodology.

Source: CBPP calculations using Agency for Healthcare Research and Quality, Medical Expenditure Panel Survey-Insurance Component, 2022; and Census Bureau, American Community Survey, 2022

TABLE 14
Uninsured Rates by English Language Proficiency, 2018-2022
 American Indian / Alaska NativeAsianBlackLatinoMulti-racialPacific IslanderSome Other RaceWhiteTotal
Speaks English Very Well16%5%13%16%8%12%13%10%13%
Speaks English Well26%9%18%28%17%17%23%17%21%
Doesn’t Speak English Well39%13%22%42%23%28%37%18%34%
Doesn’t Speak English58%17%38%54%45%*48%31%49%

Note: Question includes those aged 5-64. See Appendix II for details.

*Estimates not reported due to insufficient sample size.

Source: CBPP analysis of American Community Survey, 2018-2022


TABLE 15
Uninsured Rates Among Asian People by English Language Proficiency, 2018-2022
 CambodianChineseFilipinoHmongIndianJapaneseKoreanPakistaniThaiVietnamese
Speaks English Very Well10%4%5%8%4%4%9%8%9%7%
Speaks English Well10%7%8%9%9%5%13%14%14%8%
Doesn't Speak English Well10%13%10%9%13%8%17%17%23%10%
Doesn’t Speak English16%17%13%8%20%6%28%13%*14%

Note: Question includes those aged 5-64. See Appendix II for details.

Source: CBPP analysis of American Community Survey, 2018-2022

TABLE 16
Uninsured Rates Among Latino People by English Language Proficiency, 2018-2022
 ColombianCubanDominicanEcuadorianGuatemalanHonduranMexicanPeruvianPuerto RicanSalvadoran
Speaks English Very Well11%13%10%10%18%24%19%11%9%17%
Speaks English Well20%21%12%24%38%45%31%19%11%30%
Doesn’t Speak English Well31%26%18%42%59%64%45%32%14%44%
Doesn’t Speak English47%32%24%57%76%78%55%40%17%57%

Note: Question includes those aged 5-64. See Appendix II for details.

Source: CBPP analysis of American Community Survey, 2018-2022

Appendix II: Data and Methods

Most of the data for this report are from the Census Bureau’s American Community Survey (ACS) 1-Year Estimates and cover 2010 through 2022. The Census Bureau did not release its standard 1-year ACS for 2020 due to pandemic-related disruptions in data collection that made 2020 data unreliable; therefore, the tables and figures do not include estimates for 2020. After 2019, Census instituted improvements in question wording, processing, and methodology for race and ethnicity measures. Census recommends caution in interpreting changes in estimates by race and ethnicity from 2019 to later years.

The racial and ethnic subgroups included are the ten largest by population up to age 64 in 2022. Estimates are for people up to age 64 in non-institutionalized settings unless stated otherwise. American Indian and Alaska Native (AIAN) people may be AIAN alone or in combination with other races and ethnicities. Latino people include people of any race who identify as being of Hispanic, Latino, or Spanish origin. The Black, Native Hawaiian and Pacific Islander (NHPI), and some other race categories include only people who identify as a single race and not Latino.

Individuals who receive care through the Indian Health Service but do not have health insurance are considered uninsured.

Questions on language proficiency include those aged 5-64, and data from years 2018-2022 are combined to increase sample sizes. Level of proficiency (e.g., very well, not well) was asked only of those who speak a language other than English at home. Expansion states are defined as those that had expanded as of January 1, 2022. Median household income is calculated from the ACS among households with heads under age 65.

Estimates of average employee premium contributions and deductibles come primarily from the 2022 Medical Expenditure Panel Survey – Insurance Component (MEPS-IC) and are measured for all enrolled employees at private-sector establishments that offer health insurance. These estimates are derived by weighting average premiums and deductibles (from MEPS-IC) for family and single coverage by the distribution of family and single households in the ACS with heads under age 65. Premium contributions and deductibles are not broken down by race and ethnicity so that they better represent average costs of coverage as opposed to reflecting the costs of the different plan choices by race and ethnicity.

End Notes

[1] The authors would like to thank Stan Dorn, Cyndi Ferguson, and Peggy Ramin for their helpful comments and suggestions.

[2] CBPP analysis of 2022 American Community Survey data. Total number of uninsured among people in non-institutionalized settings.

[3] Ruqaiijah Yearby, Brietta Clark, and José F. Figueroa, “Structural Racism In Historical And Modern US Health Care Policy,” Health Affairs, Vol. 41, No. 2: Racism & Health, February 2022, https://www.healthaffairs.org/doi/10.1377/hlthaff.2021.01466

[4] This report uses the term “Latino” to refer to people of any race who identify as being of Hispanic, Latino, or Spanish origin, consistent with U.S. Census Bureau usage. This language does not necessarily reflect how everyone who is part of this community would describe themselves. For example, gender-inclusive terms like “Latinx” and “Latine” can also be used to refer to this population. These terms have emerged in recent years to represent the diversity of gender identities and expressions that are present in the community.

[5] Throughout this paper, AIAN people may be AIAN alone or in combination with other races and ethnicities. Latino people include people of any race who identify as being of Hispanic, Latino or Spanish origin. The Asian, Black, Native Hawaiian/Pacific Islander, and “some other race” categories include only people who identify as a single race and not Latino, and the multiracial category does not include people who identify as Latino.

[6] Rabah Kamal et al., “How Repeal of the Individual Mandate and Expansion of Loosely Regulated Plans are Affecting 2019 Premiums,” KFF, October 26, 2018, https://www.kff.org/health-costs/issue-brief/how-repeal-of-the-individual-mandate-and-expansion-of-loosely-regulated-plans-are-affecting-2019-premiums/.

[7] Emily Gee, “Less Coverage and Higher Costs: The Trump’s Administration’s Health Care Legacy,” Center for American Progress, September 25, 2020, https://www.americanprogress.org/article/less-coverage-higher-costs-trumps-administrations-health-care-legacy/.

[8]Ibid.

[9]Gideon Lukens, “Record Low Uninsured Rate Offers Roadmap to Long-Term Coverage Gains,” CBPP, September 14, 2023, https://www.cbpp.org/blog/record-low-uninsured-rate-offers-roadmap-to-long-term-coverage-gains.

[10] Farah Kader et al., “Disaggregating Race/Ethnicity Data Categories: Criticisms, Dangers, And Opposing Viewpoints,” Health Affairs, March 25, 2022, https://www.healthaffairs.org/do/10.1377/forefront.20220323.555023.

[11]Ibid.

[12] U.S. Office of Management and Budget, “Standards for Maintaining, Collecting, and Presenting Federal Data on Race and Ethnicity,” 81 Fed. Reg. 67398, September 30, 2016, https://www.federalregister.gov/documents/2016/09/30/2016-23672/standards-for-maintaining-collecting-and-presenting-federal-data-on-race-and-ethnicity.

[13] Heather Saunders and Priya Chidambaram, “Medicaid Administrative Data: Challenges with Race, Ethnicity, and Other Demographic Variables,” KFF, April 28, 2022, https://www.kff.org/medicaid/issue-brief/medicaid-administrative-data-challenges-with-race-ethnicity-and-other-demographic-variables/. D’Vera Cohn, Anna Brown, and Mark Hugo Lopez, “Only about half of Americans say census questions reflect their identity very well,” Pew Research Center, May 14, 2021, https://www.pewresearch.org/social-trends/2021/05/14/only-about-half-of-americans-say-census-questions-reflect-their-identity-very-well/.

[14] Linda Charmaraman et al., “How have researchers studied multiracial populations: A content and methodological review of 20 years of research,” National Library of Medicine, National Center for Biotechnology Information, July 1, 2015, https://www.ncbi.nlm.nih.gov/pmc/articles/PMC4106007/.

[15] U.S. Office of Management and Budget, “Review of the Racial and Ethnic Standards to the OMB Concerning Changes…,” July 9, 1997, https://obamawhitehouse.archives.gov/omb/fedreg_directive_15/.

[16] Cheryl Ulmer et al., “Race, Ethnicity, and Language Data: Standardization for Health Care Quality Improvement,” Subcommittee on Standardized Collection of Race/Ethnicity Data for Healthcare Quality Improvement Board on Health Care Services, April 2018, https://www.ahrq.gov/research/findings/final-reports/iomracereport/index.html.

[17] Robert Maxim, Gabriel R. Sanchez, and Kimberly R. Huyser, “Why the federal government needs to change how it collects data on Native Americans,” Brookings, March 30 2023, https://www.brookings.edu/articles/why-the-federal-government-needs-to-change-how-it-collects-data-on-native-americans/.

[18] U.S. Commission on Civil Rights, “Broken Promises: Continuing Federal Funding Shortfall for Native Americans,” December 2018, https://www.usccr.gov/files/pubs/2018/12-20-Broken-Promises.pdf. Diane M. Korngiebel, et al., “Addressing the Challenges of Research With Small Populations,” American Journal of Public Health, September 2015, https://www.ncbi.nlm.nih.gov/pmc/articles/PMC4539838/

[19] Malia Villegas et al., “Disaggregating American Indian & Alaska Native Data: A Review of Literature,” National Congress of American Indians, July 2016, https://nationalequityatlas.org/sites/default/files/AIAN-report.pdf.

[20] Saundra Mitrovich and Steph Glascock, “Why Collecting Disaggregated Data for Native Communities Matters,” the Leadership Conference on Civil and Human Rights, January 19, 2023, https://civilrights.org/blog/why-collecting-disaggregated-data-for-native-communities-matters/

[21] Mitrovich and Glascock, op. cit.

[22] Villegas, op. cit.

[23] United States Census Bureau, “Understanding and Using American Community Survey Data: What Users of Data for American Indians and Alaska Natives Need to Know,” April 2019, https://www.census.gov/content/dam/Census/library/publications/2019/acs/acs_aian_handbook_2019.pdf

[24]Federal Register, “Revisions to OMB’s Statistical Policy Directive No. 15: Standards for Maintaining, Collecting, and Presenting Federal Data on Race and Ethnicity,” 89 Fed. Reg. 22182, March 29, 2024, https://www.federalregister.gov/documents/2024/03/29/2024-06469/revisions-to-ombs-statistical-policy-directive-no-15-standards-for-maintaining-collecting-and

[25] With the updates, the revised minimum categories are: American Indian or Alaska Native, Asian, Black or African American, Hispanic or Latino, Middle Eastern or North African, Native Hawaiian or Pacific Islander, and white.

[26] Kader et al., op. cit.

[27] Centers for Medicare & Medicaid Services (CMS), 2024 Marketplace Open Enrollment Period Public Use Files, https://www.cms.gov/data-research/statistics-trends-reports/marketplace-products/2024-marketplace-open-enrollment-period-public-use-files.

[28]State Health Access Data Assistance Center at the University of Minnesota, “Collection of Race, Ethnicity, Language (REL) Data in Medicaid Applications: A 50-state Review of the Current Landscape,” May 25, 2021, https://www.shvs.org/wp-content/uploads/2021/05/SHVS-50-State-Review-EDITED.pdf.

[29]Colin Planalp, “New York State of Health Pilot Yields Increased Race and Ethnicity Question Response Rates,” State Health Access Data Assistance Center at the University of Minnesota, September 9, 2021, https://www.shvs.org/new-york-state-of-health-pilot-yields-increased-race-and-ethnicity-question-response-rates/.

[30]CBPP analysis of 2022 American Community Survey.

[31] William R. Kerr and Martin Mandorff, “Social Networks, Ethnicity, and Entrepreneurship,” Harvard Business School, November 13, 2020, https://www.hbs.edu/ris/Publication%20Files/1%20KM%20Networks%20Full_9825ec3f-5568-40bf-8af4-962c983a4e2d.pdf.

[32]CBPP analysis of 2022 American Community Survey.

[33] CBPP analysis of 2022 American Community Survey.

[34]Mary Hanna and Jeanne Batalova, “Indian Immigrants in the United States,” Migration Policy Institute, October 16, 2021, https://www.migrationpolicy.org/article/indian-immigrants-united-states-2019.

[35]Sucheng Chan, “Cambodians in the United States: Refugees, Immigrants, American Ethnic Minority,” Oxford Research Encyclopedia of American History, September 3, 2015, https://doi.org/10.1093/acrefore/9780199329175.013.317.

[36]CBBP analysis of 2022 American Community Survey.

[37]Erin Babich and Jeanne Batalova, “Central American Immigrants in the United States,” Migration Policy Institute, August 11, 2021, https://www.migrationpolicy.org/article/central-american-immigrants-united-states.

[38]Silva Mathema and Joel Martinez, “Temporary Protected Status Is Critical To Tackling the Root Causes of Migration in the Americas,” Center for American Progress, October 28, 2021, https://www.americanprogress.org/article/temporary-protected-status-critical-tackling-root-causes-migration-americas/.

[39] Babich and Batalova, op cit.

[40] “Immigrants” includes both naturalized citizens and non-citizens. United States Census Bureau, 2022 American Community Survey, “Table B05002: Place of Birth by Nativity and Citizenship Status,” https://data.census.gov/table?q=B05002&g=0100000US.

[41] Ibid.

[42] Farah Z. Ahmad and Christian E. Weller, “Reading Between the Data: The Incomplete Story of Asian Americans, Native Hawaiians, and Pacific Islanders,” Center for American Progress, February 2014, https://www.asianpacificpolicyandplanningcouncil.org/wp-content/uploads/AAPI-report.pdf.

[43]Hasna Chowdhury, “Immigration Healthcare and the Five Year Bar,” the Alliance for Citizen Engagement, August 23, 2022, https://ace-usa.org/blog/research/research-immigration/immigration-healthcare-and-the-five-year-bar/.

[44]Kyle Hayes, “Eliminating Structural Barriers Can Improve Latino People’s Access to Health Coverage,” CBPP, October 5, 2021, https://www.cbpp.org/blog/eliminating-structural-barriers-can-improve-latino-peoples-access-to-health-coverage.

[45]Akash Pillai, Drishti Pillai, and Samantha Artiga, “State Health Coverage for Immigrants and Implications for Health Coverage and Care,” May 1, 2024, https://www.kff.org/racial-equity-and-health-policy/fact-sheet/health-coverage-and-care-of-immigrants/.

[46]Valerie Lacarte, Mark Greenberg, and Randy Capps, “Medicaid Access and Participation: A Data Profile of Eligible and Ineligible Immigrant Adults,” Migration Policy Institute, October 2021, https://www.migrationpolicy.org/research/medicaid-immigrant-adults.

[47] Charles Kamasaki, “US Immigration Policy: A Classic, Unappreciated Example of Structural Racism,” Brookings Institute, March 26, 2021, https://www.brookings.edu/articles/us-immigration-policy-a-classic-unappreciated-example-of-structural-racism/.

[48] Ibid.

[49] Erica Williams, Eric Figueroa, and Wesley Tharpe, “Inclusive Approach to Immigrants Who Are Undocumented Can Help Families and States Prosper,” CBPP, December 19, 2019, https://www.cbpp.org/research/state-budget-and-tax/inclusive-approach-to-immigrants-who-are-undocumented-can-help.

[50] Pillai, Pillai, and Artiga, op. cit.

[51]Drishti Pillai et al., “Health and Health Care Experiences of Immigrants: The 2023 KFF/LA Times Survey of Immigrants,” KFF, September 17, 2023, https://www.kff.org/racial-equity-and-health-policy/issue-brief/health-and-health-care-experiences-of-immigrants-the-2023-kff-la-times-survey-of-immigrants/.

[52]Matthew Buettgens and Urmi Ramchandani, “The Health Coverage of Noncitizens in the United States, 2024,” Urban Institute, May 2023, https://www.urban.org/sites/default/files/2023-05/The%20Health%20Coverage%20of%20Noncitizens%20in%20the%20United%20States%202024.pdf.

[53]Given Puerto Rico’s status as a U.S. territory, Puerto Ricans who did not immigrate to Puerto Rico are U.S. citizens.

[54] CMS, “Trends in Subsidized and Unsubsidized Enrollment,” August 12, 2019, https://www.cms.gov/CCIIO/Resources/Forms-Reports-and-Other-Resources/Downloads/Trends-Subsidized-Unsubsidized-Enrollment-BY17-18.pdf.

[55] Jennifer M. Haley et al., “One in Five Adults in Immigrant Families with Children Reported Chilling Effects on Public Benefit Receipt in 2019,” Urban Institute, June 2020, https://www.urban.org/sites/default/files/publication/102406/one-in-five-adults-in-immigrant-families-with-children-reported-chilling-effects-on-public-benefit-receipt-in-2019_1.pdf. Shelby Gonzalez, “Agencies Should Quickly End Trump Public Charge Policies, Remove Other Barriers to Public Supports,” CBPP, February 9, 2021, https://www.cbpp.org/blog/agencies-should-quickly-end-trump-public-charge-policies-remove-other-barriers-to-public.

[56] Tracy L. Renaud, Letter to USCIS Interagency Partners, U.S. Citizenship and Immigration Services Office of the Director, April 12, 2021, https://www.uscis.gov/sites/default/files/document/notices/SOPDD-Letter-to-USCIS-Interagency-Partners-on-Public-Charge.pdf. HHS Press Office, “HHS Encourages States to Educate Eligible Immigrants about Medicaid Coverage,” July 22, 2021, https://public3.pagefreezer.com/browse/HHS.gov/30-12-2021T15:27/https://www.hhs.gov/about/news/2021/07/22/hhs-encourages-states-to-educate-eligible-immigrants-about-medicaid-coverage.html. Fed. Reg. 53991, “Suspension of entry of immigrants who will financially burden the United States healthcare system, in order to protect the availability of healthcare benefits for Americans,” October 9, 2019, https://www.govinfo.gov/content/pkg/FR-2019-10-09/pdf/FR-2019-10-09.pdf.

[57]Jennifer M. Haley et al., “Many Immigrant Families with Children Continued to Avoid Public Benefits in 2020, Despite Facing Hardships,” Urban Institute, May 2021, https://www.urban.org/sites/default/files/publication/104279/many-immigrant-families-with-children-continued-avoiding-benefits-despite-hardships.pdf.

[58] Claire Heyison and Shelby Gonzales, “States Are Providing Affordable Health Coverage to People Barred From Certain Health Programs Due to Immigration Status,” CBPP, updated February 1, 2024, https://www.cbpp.org/research/immigration/states-are-providing-affordable-health-coverage-to-people-barred-from-certain.

[59] Pillai, Pillai, and Artiga, op. cit.

[60] Tricia Brooks et al., “Medicaid and CHIP Eligibility, Enrollment, and Renewal Policies as States Prepare for the Unwinding of the Pandemic-Era Continuous Enrollment Provision,” KFF, April 4, 2023, https://www.kff.org/medicaid/report/medicaid-and-chip-eligibility-enrollment-and-renewal-policies-as-states-prepare-for-the-unwinding-of-the-pandemic-era-continuous-enrollment-provision/

[61] Eric Figueroa and Iris Hinh, “More States Adopting Inclusive Policies for Immigrants,” CBPP, April 12, 2022, https://www.cbpp.org/blog/more-states-adopting-inclusive-policies-for-immigrants.

[62]Lynne Terry, “Oregon expands free health insurance for low-income residents – regardless of immigration status,” Oregon Capital Chronicle, July 6, 2023, https://oregoncapitalchronicle.com/2023/07/06/oregon-expands-free-health-insurance-for-low-income-oregonians-regardless-of-immigration-status/.

[63] Covered California, “Information for Immigrants,” https://www.coveredca.com/learning-center/information-for-immigrants/. Kristen Hwang, “California expands health insurance to all eligible undocumented adults,” Cal Matters, January 19, 2024, https://calmatters.org/health/2023/12/undocumented-health-insurance-new-california-laws-2024/. Minnesota Legislature, SF 2995, https://www.revisor.mn.gov/bills/bill.php?f=SF2995&b=senate&y=2023&ssn=0.

[64] Adults with incomes between 100 and 138 percent of the poverty level were made eligible under the ACA for both Medicaid and marketplace coverage, but they are generally not eligible for federal subsidies for marketplace coverage when Medicaid is available.

[65] CBPP, “The Medicaid Coverage Gap: State Fact Sheets,” updated April 3, 2024, https://www.cbpp.org/research/health/the-medicaid-coverage-gap.

[66] CBPP analysis of American Community Survey data. Low income is defined here as income less than 200 percent of the federal poverty level. Results would be similar using data from 2019, prior to the pandemic, instead of 2022: the uninsured rate declines from 2013 to 2019 were 35 to 17 percent in expansion states and 43 to 34 percent in non-expansion states.

[67] Jesse C. Baumgartner, Sara R. Collins, and David C. Radley, “Racial and Ethnic Inequities in Health Care Coverage and Access, 2013–2019,” the Commonwealth Fund, June 9, 2021, https://www.commonwealthfund.org/publications/issue-briefs/2021/jun/racial-ethnic-inequities-health-care-coverage-access-2013-2019.

[68] Office of the Assistant Secretary for Planning and Evaluation, U.S. Department of Health and Human Services Office of Health Policy, “Health Insurance Coverage and Access to Care Among Latinos: Recent Trends and Key Challenges,” October 8, 2021, https://aspe.hhs.gov/reports/health-insurance-coverage-access-care-among-latinos.

[69] Donald Warne and Linda Bane Frizzell, “American Indian Health Policy: Historical Trends and Contemporary Issues,” American Journal of Public Health, June 2014, https://www.ncbi.nlm.nih.gov/pmc/articles/PMC4035886/.

[70]Leah Frerichs et al., “Regional Differences In Coverage Among American Indians And Alaska Natives Before And After The ACA,” Health Affairs, September 2019, https://www.healthaffairs.org/doi/pdf/10.1377/hlthaff.2019.00076. Shira Rutman, Leslie Phillips, and Aren Sparck, “Health Care Access and Use by Urban American Indians and Alaska Natives: Findings from the National Health Interview Survey (2006-09),” National Institutes of Health, National Library of Medicine, 2016, https://pubmed.ncbi.nlm.nih.gov/27524782/.

[71] CMS, “Medicaid & CHIP For American Indians/Alaska Natives,” CMS Product 909442-N, February 2017, https://www.cms.gov/Outreach-and-Education/American-Indian-Alaska-Native/AIAN/Downloads/Medicaid-and-CHIP-Pocket-Card.pdf.

[72] Oklahoma had the second highest population of uninsured AIAN people (behind Texas) when AIAN includes people who also identify as other races and/or Latino, and the highest population of uninsured AIAN people when AIAN includes only those identifying as a single race and not Latino. CBPP analysis of 2021 American Community Survey.

[73] Oklahoma Health Care Authority, Data and Reports, https://oklahoma.gov/ohca/research/data-and-reports.html.

[74]CBPP analysis of 2022 American Community Survey.

[75]South Dakota Department of Social Services, https://dss.sd.gov/keyresources/statistics.aspx.

[76]CBPP analysis of 2022 American Community Survey. Employment rates and uninsured rates measured among people aged 18-64 in non-institutionalized settings. Respondents are sorted into one type of coverage using the following hierarchy: Medicaid, Medicare, employer-sponsored, military (VA or Tricare), and direct purchase.

[77] Approximately 81 percent of Asian people under age 65 live in expansion states. In contrast, only 55 percent of Black people and 65 percent of Latino people live in expansion states.

[78] Jennifer Tolbert, Patrick Drake, and Anthony Damico, “Key facts about the Uninsured Population,” KFF, December 18, 2023, https://www.kff.org/uninsured/issue-brief/key-facts-about-the-uninsured-population/.

[79]CBPP analysis of 2022 American Community Survey. Respondents may report more than one type of coverage. Respondents are sorted into one type of coverage only using the following hierarchy: Medicaid, Medicare, employer-sponsored, military (VA or Tricare), and direct purchase.

[80]Raj Chetty et al. “Race and Economic Opportunity in the United States: An Intergenerational Perspective,” Harvard University, March 2018, https://scholar.harvard.edu/files/hendren/files/race_paper.pdf.

[81]McKinsey & Company, “Race in the workplace: The Black experience in the US private sector,” February 21, 2021, https://www.mckinsey.com/featured-insights/diversity-and-inclusion/race-in-the-workplace-the-black-experience-in-the-us-private-sector.

[82]CMS, “Health Insurance Marketplaces 2024 Open Enrollment Report,” March 22, 2024, https://www.cms.gov/files/document/health-insurance-exchanges-2024-open-enrollment-report-final.pdf.

[83] CMS, Marketplace Open Enrollment Period Public Use Files for 2021-2024, https://www.cms.gov/data-research/statistics-trends-and-reports/marketplace-products.

[84]In this study, AIAN is defined as people who identify as AIAN alone, not including AIAN people who also identify as other races or Latino. Also, the study combines Asian Americans and NHPI people into a single group that it labels AANHPI. Anu Warrier et al., “HealthCare.gov Enrollment by Race and Ethnicity, 2015-2023,” Office of the Assistant Secretary for Planning and Evaluation, U.S. Department of Health and Human Services, March 22, 2024, https://aspe.hhs.gov/reports/marketplace-enrollment-race-ethnicity-2015-2023.

[85]KFF, “Distribution of Eligibility for ACA Health Coverage Among the Remaining Uninsured,” 2021, https://www.kff.org/health-reform/state-indicator/distribution-of-eligibility-for-aca-coverage-among-the-remaining-uninsured/. Jennifer M. Haley and Erik Wengle, “Many Uninsured Adults Have Not Tried to Enroll in Medicaid or Marketplace Coverage: Findings from the September 2020 Coronavirus Tracking Survey,” Urban Institute, January 2021, https://www.urban.org/sites/default/files/publication/103558/many-uninsured-adults-have-not-tried-to-enroll-in-medicaid-or-marketplace-coverage.pdf.

[86]Suzanne Wikle et al., “States Can Reduce Medicaid’s Administrative Burdens to Advance Health and Racial Equity,” CBPP, July 19, 2022, https://www.cbpp.org/research/health/states-can-reduce-medicaids-administrative-burdens-to-advance-health-and-racial.

[87]Ibid.

[88]David M. Anderson and Patrick O’Mahen, “How to Improve Consumer Plan Selection In ACA Marketplaces—Part 2,” Health Affairs, June 4, 2021, https://www.healthaffairs.org/do/10.1377/forefront.20210602.122238/full/.

[89]Michel H. Boudreaux et al., “Residential High-Speed Internet Among Those Likely to Benefit From an Online Health Insurance Marketplace,” National Institutes of Health, National Library of Medicine, January 16 2018, https://www.ncbi.nlm.nih.gov/pmc/articles/PMC5798681/.

[90]Sara Atske and Andrew Perrin, “Home broadband adoption, computer ownership vary by race, ethnicity in the U.S.,” Pew Research Center, July 16, 2021, https://www.pewresearch.org/fact-tank/2021/07/16/home-broadband-adoption-computer-ownership-vary-by-race-ethnicity-in-the-u-s/.

[91]Jennifer Tolbert, Patrick Drake, and Anthony Damico, “Key Facts about the Uninsured Population,” KFF, December 18, 2023, https://www.kff.org/uninsured/issue-brief/key-facts-about-the-uninsured-population/.

[92] Patrick Drake et al., “A Closer Look at the Remaining Uninsured Population Eligible for Medicaid and CHIP,” KFF, March 15, 2024, https://www.kff.org/uninsured/issue-brief/a-closer-look-at-the-remaining-uninsured-population-eligible-for-medicaid-and-chip/.

[93]Christen Linke Young et al., “How To Boost Health Insurance Enrollment: Three Practical Steps That Merit Bipartisan Support,” Health Affairs, August 17, 2020, https://www.healthaffairs.org/do/10.1377/forefront.20200814.107187/full/.

[94]Renuka Tipirneni et al., “Association Between Health Insurance Literacy and Avoidance of Health Care Services Owing to Cost,” JAMA Network Open, November 16, 2018, https://jamanetwork.com/journals/jamanetworkopen/fullarticle/2714507.

[95]Lauren Woods, “Health Insurance Plans ‘Too Complicated to Understand,’” UConn Today, April 5, 2017, https://today.uconn.edu/2017/04/health-insurance-plans-complicated-understand/#.

[96] Victor G. Villagra et al., “Health Insurance Literacy: Disparities by Race, Ethnicity, and Language Preference,” American Journal of Managed Care, March 2019, https://www.ajmc.com/view/health-insurance-literacy-disparities-by-race-ethnicity-and-language-preference. U.S. Department of Education, “The Health Literacy of America’s Adults: Results From the 2003 National Assessment of Adult Literacy,” September 2006, https://nces.ed.gov/pubs2006/2006483.pdf.

[97] Nida M. Ali et al., “Addressing Health Insurance Literacy Gaps in an Urban African American Population: A Qualitative Study,” Journal of Community Health, June 20, 2018, https://link.springer.com/article/10.1007/s10900-018-0541-x.

[98] Martha Hostetter and Sarah Klein, “Understanding and Ameliorating Medical Mistrust Among Black Americans,” the Commonwealth Fund, January 14, 2021, https://www.commonwealthfund.org/publications/newsletter-article/2021/jan/medical-mistrust-among-black-americans.

[99] Khiara M. Bridges, “Implicit Bias and Racial Disparities in Health Care,” American Bar Association, December 7, 2018, https://www.americanbar.org/groups/crsj/publications/human_rights_magazine_home/the-state-of-healthcare-in-the-united-states/racial-disparities-in-health-care/.

[100] Kat Stafford, Aaron Morrison, and Annie Ma, “Medical Racism in History,” AP News, May 23, 2023, https://projects.apnews.com/features/2023/from-birth-to-death/medical-racism-in-history.html.

[101] Office of the Assistant Secretary for Planning and Evaluation, U.S. Department of Health and Human Services Office of Health Policy, “Reaching the Remaining Uninsured: An Evidence Review on Outreach and Enrollment,” October 1, 2021, https://aspe.hhs.gov/reports/reaching-remaining-uninsured-outreach-enrollment.

[102] Outreach included a combination of television, radio, direct response (text messaging, email, and autodial), internet search buys, and paid digital ads, and reflected the results of a partial open enrollment period. Centers for Medicare & Medicaid Services, “Preliminary OE4 Lessons Learned,” https://downloads.cms.gov/files/359411146-preliminary-oe4-lessons-learned.pdf.

[103] Paul R. Shafer et al., “Television Advertising and Health Insurance Marketplace Consumer Engagement in Kentucky: A Natural Experiment,” Journal of Medical Internet Research, October 2018, https://www.jmir.org/2018/10/e10872/PDF.

[104] Joseph B. Richardson et al., “The Challenges and Strategies of Affordable Care Act Navigators and In-Person Assisters with Enrolling Uninsured, Violently Injured Young Black Men into Healthcare Insurance Coverage,” American Journal of Men’s Health, April 13, 2021, https://journals.sagepub.com/doi/full/10.1177/15579883211005552. Karen Pollitz et al., “Consumer Assistance in Health Insurance: Evidence of Impact and Unmet Need,” KFF, August 7, 2020, https://www.kff.org/report-section/consumer-assistance-in-health-insurance-evidence-of-impact-and-unmet-need-issue-brief/.

[105] Karen Pollitz, Jennifer Tolbert, and Maria Diaz, “Data Note: Further Reductions in Navigator Funding for Federal Marketplace States,” KFF, September 2018, https://files.kff.org/attachment/Data-Note-Further-Reductions-in-Navigator-Funding-for-Federal-Marketplace-States.

[106] Tara Straw, “Marketplaces Poised for Further Gains as Open Enrollment Begins,” CBPP, October 29, 2021, https://www.cbpp.org/research/health/marketplaces-poised-for-further-gains-as-open-enrollment-begins.

[107]CBPP calculations using 2022 ACS data. Warrier et al., op. cit.

[108] Karthick Ramakrishnan and Farah Z. Ahman, “State of Asian Americans and Pacific Islanders Series,” Center for American Progress, April 23, 2014, https://www.americanprogress.org/article/state-of-asian-americans-and-pacific-islanders-series/.

[109] Estimates for people up to age 64 in non-institutionalized settings. CBPP analysis of 2022 American Community Survey.

[110] Rubén G. Rumbaut and Douglas S. Massey, “Immigration and Language Diversity in the United States,” National Institutes of Health, National Library of Medicine, Summer 2013, https://www.ncbi.nlm.nih.gov/pmc/articles/PMC4092008/.

[111] CBPP analysis of 2022 American Community Survey.

[112] Kathy Ko Chin, “HHS Must Improve Language Access To Make Meaningful Access A Reality,” Health Affairs, July 22, 2016, https://www.healthaffairs.org/do/10.1377/forefront.20160722.055907/.

[113] Colleen L. Barry et al., “Assessing the Content of Television Health Insurance Advertising during Three Open Enrollment Periods of the ACA,” Journal of Health Politics, Policy and Law, December 2018, https://pubmed.ncbi.nlm.nih.gov/31091327/.

[114] Lisa Aliferis, “Insurance Agents Key to California Success Enrolling Asian-Americans,” KFF Health News, March 25, 2014, https://khn.org/news/insurance-agents-key-to-california-success-enrolling-asian-americans/.

[115] Brian D. Smedley et al., “Unequal Treatment: Confronting Racial and Ethnic Disparities in Health Care,” Institute of Medicine, 2003, https://pubmed.ncbi.nlm.nih.gov/25032386/. Kathleen T. Call, “Barriers to care in an ethnically diverse publicly insured population: is health care reform enough?” Medical Care, August 2014, https://pubmed.ncbi.nlm.nih.gov/25023917/.