- Home
- Income Security
- State Fact Sheets: Trends In State TANF-...
State Fact Sheets: Trends in State TANF-to-Poverty Ratios
The Temporary Assistance for Needy Families (TANF) block grant, created in 1996, provides temporary financial assistance to few families below the poverty line — including those with no other means to meet basic needs — and its reach has shrunk considerably over time. In 2020, for every 100 families in poverty, just 21 families received TANF cash assistance — down from 68 families when TANF was first enacted. This “TANF-to-poverty ratio” (TPR) is at the lowest point in TANF’s history.
The TPR varies widely among states, ranging from 71 in California and Vermont to just 4 in Arkansas, Louisiana, Mississippi, and Texas. In 14 states, the ratio is 10 or less, meaning that for every 100 families living in poverty, 10 or fewer receive TANF cash assistance.
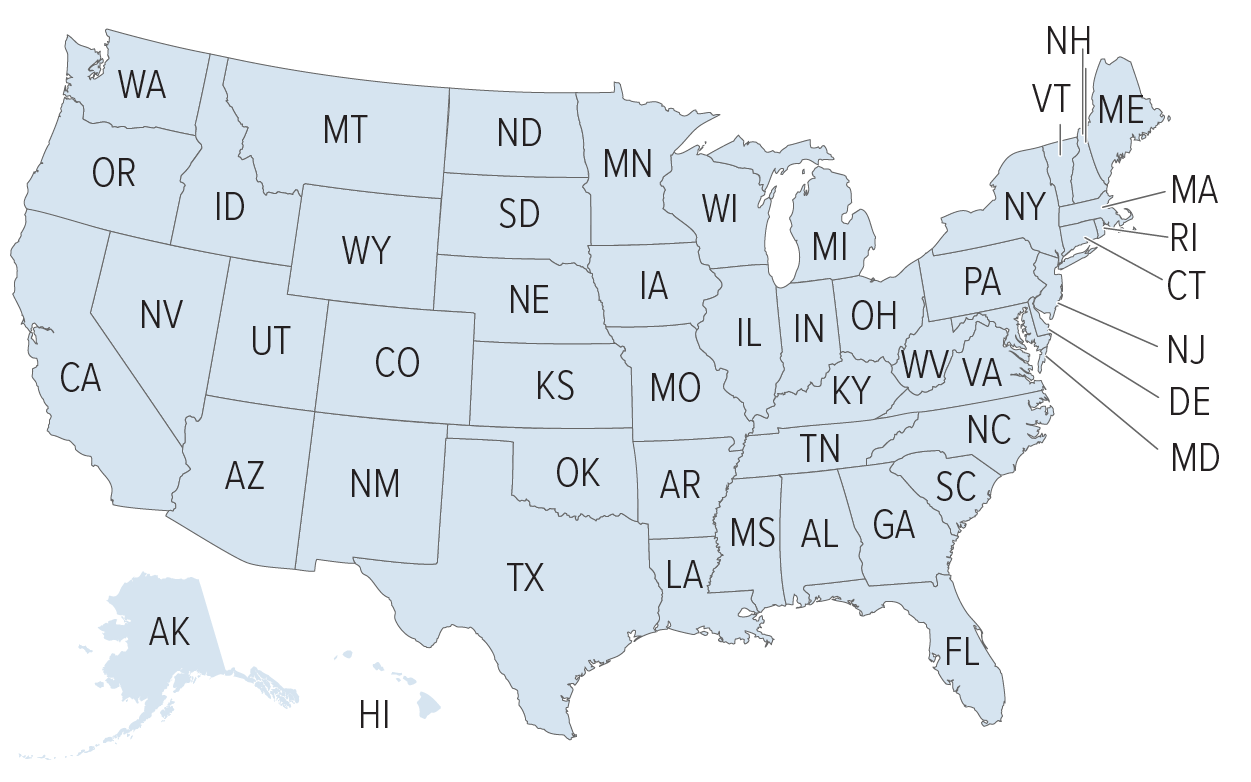
In the map below, click on a state for a fact sheet detailing trends in its TANF caseload and the program’s ability to reach families in poverty.

Click on the state abbreviation (above) or name (below) to jump to its fact sheets.