What the 2015 Trustees’ Report Shows About Social Security
Social Security has the resources to pay full benefits for close to two decades, the trustees’ latest annual report shows, but will then face a significant, though manageable, funding shortfall that the President and Congress should address in the near future. Doing so would permit changes that are gradual rather than sudden and allow people to plan their work, savings, and retirement with greater certainty.
Several key points emerge from the report:
- Policymakers will have to replenish Social Security’s Disability Insurance (DI) trust fund by late 2016. Ideally, they would do so as part of a comprehensive solvency package, because the retirement and disability components of Social Security are closely woven together. But regardless of whether lawmakers achieve a balanced and well-designed solvency package by 2016 (which seems unlikely), it is reasonable and essential to reallocate taxes between the disability and retirement programs, as policymakers have often done in the past.
- The trustees estimate that, even if policymakers took no further action, Social Security’s combined Old-Age and Survivors Insurance (OASI) and DI trust funds will be exhausted in 2034 — a year later than in last year’s report. That date fluctuates slightly in each trustees’ report depending on economic, demographic, and other variables; over the last two decades, it has ranged between 2029 and 2042, but the overall story has been consistent.
- After 2034, Social Security could still pay three-fourths of scheduled benefits using its tax income even if policymakers took no steps to shore up the program. Those who claim that Social Security won’t be around at all when today’s young adults retire and that young workers will receive no benefits misunderstand or misrepresent the trustees’ projections.
- The program’s shortfall amounts to 1 percent of gross domestic product (GDP) over the next 75 years (and 1.60 percent of GDP in 2089, the 75th year). A mix of tax increases and benefit modifications, carefully crafted to shield recipients with limited means and to give ample notice to all participants, could put the program on a sound footing indefinitely. Social Security benefits are hardly lavish; the average retiree receives about $16,000 a year and the average widow or disabled worker even less. Accordingly, taxes should make up a large proportion of a solvency package.
Report Holds Few Surprises
The trustees’ report focuses on the outlook for the next 75 years — a horizon that spans the lifetime of just about everybody now old enough to work.[1] The trustees expect the program’s tax income to climb slightly from today’s levels, remaining near 13 percent of taxable payroll.[2] (Taxable payroll — the wages and self-employment income up to Social Security’s taxable maximum, currently $118,500 a year — represents slightly over one-third of GDP.) Meanwhile, program costs are expected to climb to 18 percent of taxable payroll from 14 percent today, largely due to the aging of the population. Interest earnings, long an important component of the trust funds’ income, will shrink after the mid-2020s and eventually disappear unless lawmakers take steps to restore solvency.
Over the entire 75-year period, the trustees put the Social Security shortfall at 2.68 percent of taxable payroll; the shortfall is concentrated in the later decades of the projection. Expressed as a share of the nation’s economy, the 75-year shortfall is just under 1 percent of GDP.
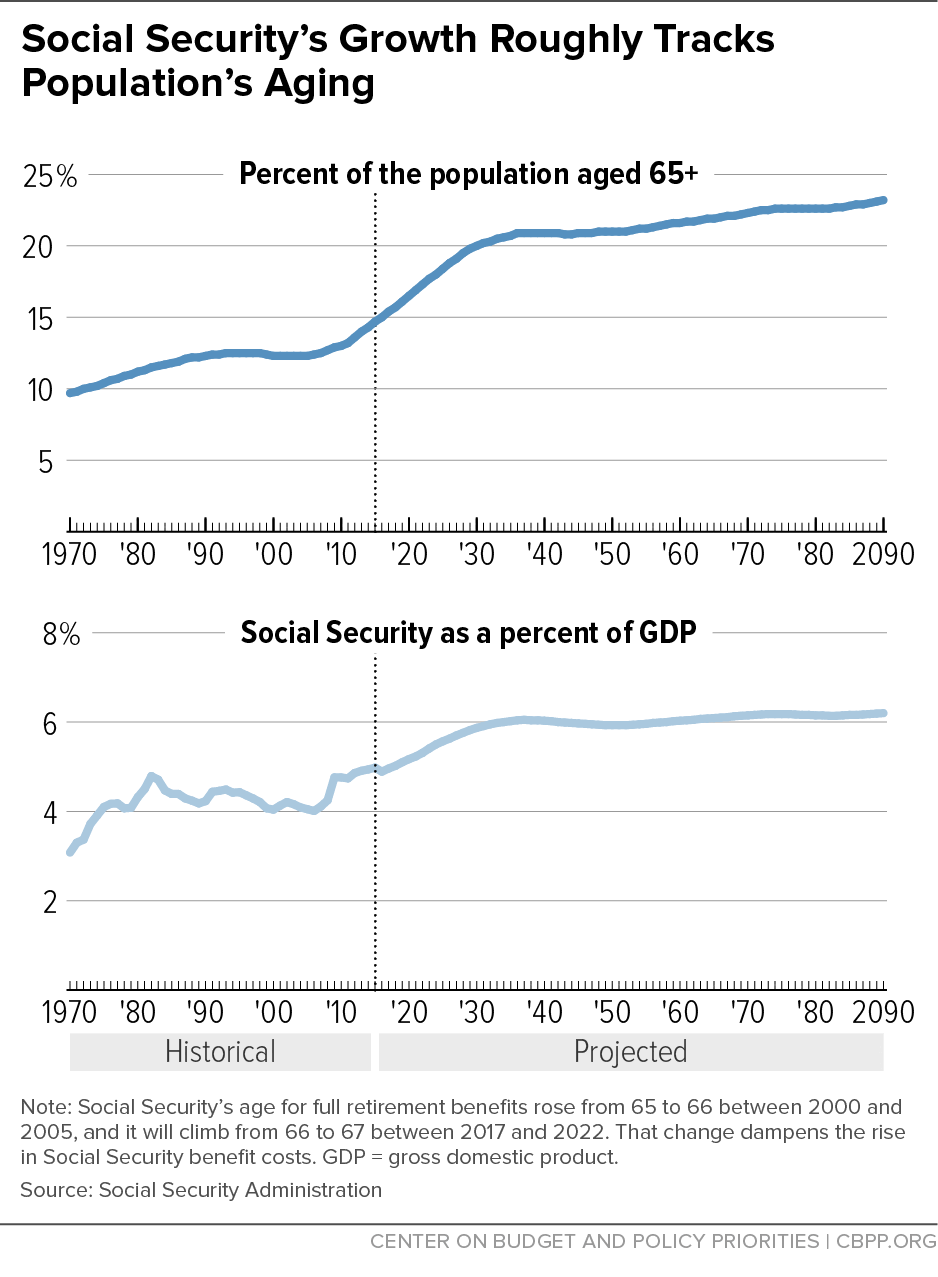
Program costs will grow steadily for the next two decades and then stabilize. The trustees expect costs to reach 16 percent of taxable payroll in 2030 but then take 60 years to rise another two percentage points. (As a percentage of GDP, costs will rise from slightly under 5 percent today to just over 6 percent in the 2030s, and then remain close to that level.)
While Social Security provides a safety net to people of all ages — young children and their surviving parents who have lost a family breadwinner, working-age adults who have suffered a serious disability, and retired workers and elderly widows and widowers — about three-fourths of its benefits go to people age 65 or older. The share of the population that is 65 or older will climb steeply through 2035, from one in seven Americans today to one in five by the 2030s, and then inch up thereafter. The rise in Social Security’s cost as a percentage of GDP lags slightly behind that growth due to already enacted increases in the age for full retirement benefits (previously 65, now 66, and eventually 67), which dampen the rise in benefit costs.[3] (See Figure 1.) These facts reinforce the point that Social Security’s fundamental challenge is demographic, traceable to a rising number of beneficiaries rather than to escalating costs per beneficiary.
Social Security’s shortfall over the next 75 years is slightly smaller than in the 2014 report (see Table 1). A variety of regulatory, demographic, economic, and methodological changes that are individually small combine to improve the shortfall by 0.26 percentage points. That’s partly offset by the change in the 75-year “valuation period” — which last year ended in 2088, and now ends in 2089 — which worsens the shortfall by 0.06 percentage points. That change, which results from adding one distant year with a relatively large shortfall, occurs naturally in every trustees’ report. Altogether, the 75-year balance improved by 0.2 percentage points.
At first blush, the projected deficit — 2.68 percent of taxable payroll — appears larger than most projections over the last two decades. In many of those years, the 75-year deficit was around 2 percent of taxable payroll or even less. Those figures are not, however, strictly comparable, because the period covered by the reports has shifted. The 1995 report, for example, spanned the period through 2069; this year’s report goes through 2089. Each one-year shift in the valuation period moves the 75-year balance further into the red by a small amount, so it is not appropriate to compare today’s actuarial deficit with one estimated in the 1990s. Unlike the program’s deficit, the date of trust-fund exhaustion is not affected by the 75-year valuation period, and it has ranged between 2029 and 2042.
In short, trustees’ reports over the last two decades have told a consistent story, although they have not yet spurred policymakers to action.
| TABLE 1 | ||||||
|---|---|---|---|---|---|---|
| Trustees’ Estimates Have Fluctuated But Tell a Consistent Story | ||||||
| Change in actuarial balance (as percentage of taxable payroll over 75 years) since previous report due to… |
||||||
| Year of report | Legislation and regulations | Valuation period | All other* | Total change | Actuarial balance | Year of exhaustion |
| 1996 | 0.03 | -0.08 | 0.03 | -0.02 | -2.19 | 2029 |
| 1997 | 0.03 | -0.08 | 0.02 | -0.03 | -2.23 | 2029 |
| 1998 | 0.00 | -0.08 | 0.12 | 0.04 | -2.19 | 2032 |
| 1999 | 0.00 | -0.08 | 0.20 | 0.12 | -2.07 | 2034 |
| 2000 | 0.00 | -0.07 | 0.24 | 0.17 | -1.89 | 2037 |
| 2001 | 0.00 | -0.07 | 0.10 | 0.03 | -1.86 | 2038 |
| 2002 | 0.00 | -0.07 | 0.06 | -0.01 | -1.87 | 2041 |
| 2003 | 0.00 | -0.07 | 0.03 | -0.04 | -1.92 | 2042 |
| 2004 | 0.00 | -0.07 | 0.10 | 0.03 | -1.89 | 2042 |
| 2005 | 0.00 | -0.07 | 0.03 | -0.04 | -1.92 | 2041 |
| 2006 | 0.00 | -0.06 | -0.03 | -0.09 | -2.02 | 2040 |
| 2007 | 0.00 | -0.06 | 0.13 | 0.06 | -1.95 | 2041 |
| 2008 | 0.00 | -0.06 | 0.32 | 0.26 | -1.70 | 2041 |
| 2009 | 0.00 | -0.05 | -0.25 | -0.30 | -2.00 | 2037 |
| 2010 | 0.14 | -0.06 | 0.00 | 0.08 | -1.92 | 2037 |
| 2011 | 0.00 | -0.05 | -0.25 | -0.30 | -2.22 | 2036 |
| 2012 | 0.00 | -0.05 | -0.39 | -0.44 | -2.67 | 2033 |
| 2013 | -0.15 | -0.06 | 0.16 | -0.05 | -2.72 | 2033 |
| 2014 | -0.01 | -0.06 | -0.09 | -0.16 | -2.88 | 2033 |
| 2015 | 0.02 | -0.06 | 0.24 | 0.20 | -2.68 | 2034 |
Some commentators cite huge dollar figures that appear in the trustees’ report, such as the $10.7 trillion shortfall through 2089 (or even the $26 trillion shortfall through eternity, a figure whose validity many experts question[4]). Except over relatively short periods, however, it is not useful to express Social Security’s income, expenditures, or funding gap in dollar terms, which does not convey a sense of the economy’s ability to support the program. Expressing them in relation to taxable payroll or GDP, in contrast, puts them in proper perspective. Over the next 75 years, for example, taxable payroll — discounted to today’s dollars just as the $10.7 trillion shortfall figure is — will exceed $400 trillion, and GDP will be nearly $1,200 trillion. Thus, the shortfall over the next 75 years equals about 2.5 percent of taxable payroll and 0.9 percent of GDP.[5]
Key Dates and What They Mean
2034 is the “headline date” in the trustees’ report, because that is when the combined Social Security trust funds are expected to run out of Treasury bonds to cash in. At that point, if nothing else is done, benefits would have to be cut to match the program’s annual tax income. The program could then pay 79 percent of scheduled benefits, a figure that would slip to 73 percent by 2089. Contrary to popular misconception, benefits would not stop.
Although the exhaustion date attracts keen attention, the trustees caution that their projections are uncertain. For example, while 2034 is their best estimate of when the trust funds will be depleted, they judge there is an 80 percent probability that trust fund exhaustion will occur sometime between 2030 and 2040 — and a 95 percent chance that depletion will happen between 2029 and 2046.[6] Chiefly because it assumes slightly faster improvements in mortality, the Congressional Budget Office (CBO) expects the combined trust funds to be exhausted in 2029; last year, CBO estimated there was roughly an 80 percent probability that the combined trust funds would be exhausted between 2026 and 2036.[7] In short, all reasonable estimates show a long-run problem that needs to be addressed but not an immediate crisis.
Two other, earlier dates also receive attention but have little significance for Social Security financing:
- 2010 marked the first year since 1983 in which the program’s total expenses (for benefits and administrative costs) exceeded its tax income (from payroll taxes and income taxes that higher-income beneficiaries pay on a portion of their Social Security benefits). That was long expected to happen in the mid-2010s as demographic pressures built; the economic downturn led it to occur several years sooner. The trust funds are nevertheless still growing because of the interest income they receive on their Treasury bonds. In 2014, for example, Social Security’s interest income of $98 billion more than offset its so-called cash deficit of $73 billion, leading the trust funds to grow by $25 billion.[8]
- 2020 will be the first year in which the program’s expenses exceed its total income, including its interest income. At that point, the trust funds — after peaking at nearly $2.9 trillion — will start to shrink as Social Security redeems its Treasury bonds to pay benefits.
Neither of these dates affects Social Security beneficiaries. From 1984 through 2009, Social Security collected more in taxes each year than it paid out in benefits, lent the excess revenue to the Treasury, and received Treasury bonds in return. Together with compound interest, that accounts for the $2.8 trillion in Treasury bonds that the trust funds hold today.
The 1983 Social Security amendments designed program financing in this manner to help pre-fund some of the costs of the baby boomers’ retirement. The interest income from the trust funds’ bonds, as well as the eventual proceeds from redeeming the bond principal, will enable Social Security to keep paying full benefits until 2034. Of course, policymakers should restore Social Security’s long-run solvency well before then. Social Security’s diminishing cash flow does affect the task of the Treasury, which manages the government’s overall financing needs. Nevertheless, the bonds have the full faith and credit of the United States government, and — as long as the solvency of the federal government itself is not called into question — Social Security will be able to redeem its bonds just as any private investor might do.[9]
What Congress Should Do Soon
The report reminds policymakers that they must act soon to replenish the Social Security disability fund. Most analyses of the trustees’ report — including this one — focus on the combined OASI and DI trust funds, commonly known as the Social Security trust funds. In fact, these two trust funds are separate, and the DI trust fund faces exhaustion in late 2016. (The much bigger OASI fund would last until 2035. Combined, the two funds would be depleted in 2034.)
DI’s insolvency is not a surprise and need pose no crisis.[10] Furthermore, DI and OASI are closely related, and policymakers should strengthen both by addressing overall Social Security solvency. Both components of Social Security face fairly similar long-run shortfalls, and key features — including the tax base, the work history required to become insured for benefits, the benefit formula, and cost-of-living adjustments — are similar or identical for the two programs. In addition, most DI recipients are close to or past Social Security’s early-retirement age of 62. Tackling DI in isolation would leave policymakers with few — and unduly harsh — options and require them to ignore the strong interactions between Social Security’s disability and retirement components.
Small or Zero Cost-of-Living Adjustment Expected in 2016
The Social Security trustees expect that there will be no cost-of-living adjustment (COLA) in benefits next January. If they’re right — which we won’t know until late October — that has several consequences for beneficiaries and for covered workers.
COLAs are based on the Consumer Price Index for Urban Wage and Clerical Workers (the CPI-W) in the third quarter of the year. Because of declining energy prices, the CPI-W fell sharply in late 2014. Although it has been rising since February, it still might not exceed last year’s value in the July-September quarter. It’s reasonable to expect that the COLA will be between zero and 0.5 percent. (A 0.5 percent COLA would mean an extra $6 a month for an average beneficiary.)
A zero COLA wouldn’t be a novelty: there were no COLAs in 2010 or 2011, also because of volatile energy prices. Since the purpose of COLAs is to preserve beneficiaries’ purchasing power, stable prices mean that beneficiaries do not need a COLA to keep up with inflation. And the Social Security Act provides that there are no negative COLAs, so when prices fall, benefits can’t be reduced. This protected beneficiaries in 2010 and 2011 and could do so again.
A zero COLA has several consequences for Social Security. Two key program amounts that normally rise with average wages are instead frozen when there’s no COLA: the taxable maximum (the maximum wage or self-employment income, currently $118,500, on which workers and their employers pay tax) and the retirement earnings test (the amount, currently $15,720, that most beneficiaries under age 66 may earn without a reduction in their current monthly benefit). That was arguably an oversight in drafting, and lawmakers should fix it to allow both amounts to rise in 2015. We estimate that would mean allowing the taxable maximum to rise to $122,400 and the retirement test to $16,200.
Most Social Security beneficiaries over age 65 (and disabled beneficiaries under 65) enroll in Medicare Part B for doctor and outpatient services and have the premium — currently $104.90 a month — deducted from their checks. By law, in most cases, their net check can’t fall when Medicare premiums go up. If there’s no COLA, this provision will shield about 70 percent of enrollees from a premium hike — but because premiums must, by law, cover one-fourth of total Part B spending, it means that the other 30 percent, including people newly signing up for Medicare at 65, will pay disproportionately more.
For more information see The 2015 Annual Report of the Board of Trustees of the Federal Old-Age and Survivors Insurance and Federal Disability Insurance Trust Funds, July 2015, Tables V.C1 and V.C2; Phil Galewitz, “Good News, Bad News In Medicare Trustees Report,” Kaiser Health News, July 23, 2015, http://khn.org/news/good-news-bad-news-in-medicare-trustees-report/; and the following CBPP reports: “Social Security COLA Is Back for 2012,” October 21, 2011, https://www.cbpp.org/blog/social-security-cola-is-back-for-2012, “No Fizz in Upcoming COLA,” October 14, 2010, https://www.cbpp.org/blog/no-fizz-in-upcoming-cola, and Case For a Social Security Cost-of-Living Adjustment in 2010 Is Weak, October 15, 2009, https://www.cbpp.org/research/case-for-a-social-security-cost-of-living-adjustment-in-2010-is-weak.
But regardless of whether policymakers craft a sensible solvency package by 2016 — which now seems unlikely — they should reallocate revenues between Social Security’s retirement and disability funds. That’s a traditional and historically noncontroversial action that they have often taken between the two trust funds, in either direction, and this time-honored step would avert a sudden and unacceptable cut in disability benefits.[11] And even before then, lawmakers should take steps to allow the taxable maximum to rise in 2016 even if there’s no cost-of-living adjustment (see box).
Policymakers need to get Social Security reform right. Nearly every American participates in Social Security, first as a worker and eventually as a beneficiary. The program’s benefits are the foundation of income security in old age, though they are modest both in dollar terms (elderly retirees receive an average Social Security benefit of about $16,000 a year, widows and disabled workers even less) and compared with benefits in other countries (Social Security benefits replace a smaller share of pre-retirement earnings than comparable programs in most other developed nations).[12] In fact, the median income of elderly married couples from all sources other than Social Security equaled just $22,000 in 2012; for non-married elderly people (including widows and widowers), median income from other sources was only $2,400.[13] Moreover, millions of beneficiaries have no income other than Social Security.[14]
Because Social Security benefits are so modest and make up the principal source of income for most beneficiaries, policymakers should restore solvency through a mix of revenue increases and benefit changes, with increased revenues contributing a majority of the savings. Revenues could come from raising the maximum amount of wages subject to the payroll tax (which now encompasses only about 83 percent of covered earnings, well short of the 90 percent figure envisioned in the 1977 Social Security amendments); broadening the tax base by subjecting voluntary salary-reduction plans, such as cafeteria plans and health care Flexible Spending Accounts, to the payroll tax (as 401(k) plans and similar retirement accounts are); and raising the payroll tax rate by small steps starting at some point in the future.
Future workers are expected to be more prosperous than today’s. Under the trustees’ assumptions, the average worker will be about 40 percent better off — in real terms — in 2040 than in 2015, and twice as well off by 2070. It is appropriate to devote a small portion of those gains to the payroll tax, while still leaving future workers with much higher take-home pay. Social Security is a popular program, and poll respondents of all ages and incomes express a willingness to support it through higher taxes.[15]
Policymakers need to design reforms judiciously so that Social Security remains the most effective and successful income-security program in the nation’s history.
Other versions of this report
End Notes
[1] The 2015 Annual Report of the Board of Trustees of the Federal Old-Age and Survivors Insurance and Federal Disability Insurance Trust Funds, July 2015, http://www.ssa.gov/OACT/TR/2015/index.html.
[2] See Table IV.B1, “Annual Income Rates, Cost Rates, and Balances,” http://www.ssa.gov/OACT/TR/2015/lrIndex.html. Payroll taxes equal 12.4 percent of taxable payroll, while dedicated income taxes that higher-income beneficiaries pay on a portion of their Social Security benefits contribute a gradually rising percentage of taxable payroll.
[3] The scheduled rise in the full retirement age from 66 to 67, to be phased in between 2017 and 2022, causes the growth of program costs to be less than it otherwise would be, as the previous rise from 65 to 66 also did. For an explanation, see the box, “Why Does Raising the Retirement Age Reduce Benefits?” in Kathy Ruffing and Paul N. Van de Water, Social Security Benefits Are Modest, Center on Budget and Policy Priorities, updated May 5, 2015, https://www.cbpp.org/research/social-security/social-security-benefits-are-modest.
[4] See letter from the American Academy of Actuaries to the Trustees of the Social Security System and the Social Security Advisory Board, December 19, 2003, http://www.actuary.org/pdf/socialsecurity/tech_dec03.pdf. See also Kathy Ruffing, Paul N. Van de Water, and Richard Kogan, “Generational Accounting” Is Complex, Confusing, and Uninformative, Center on Budget and Policy Priorities, February 6, 2014, https://www.cbpp.org/research/generational-accounting-is-complex-confusing-and-uninformative.
[5] Trustees’ Report, Tables IV.B5 and VI.F1. The more prominent 75-year figures — 2.68 percent of taxable payroll (and 0.96 percent of GDP) — include an extra margin for a target trust-fund balance at the end of 2089. Without that buffer, which is set at 100 percent of the next year’s estimated Social Security outlays, the shortfall is 2.53 percent of taxable payroll (and 0.9 percent of GDP) over 75 years.
[6] Trustees’ Report, Table VI.E1.
[7] Date of projected depletion from Congressional Budget Office, The 2015 Long-Term Budget Outlook, June 2015, http://www.cbo.gov/publication/50250. Probability range from The 2014 Long-Term Projections for Social Security: Additional Information, December 2014, http://www.cbo.gov/publication/49795. An update to the second report is expected later this year.
[8] Trustees’ Report, Table VI.G8.
[9] Paul N. Van de Water, Understanding the Social Security Trust Funds, Center on Budget and Policy Priorities, updated August 18, 2014, https://www.cbpp.org/research/social-security/understanding-the-social-security-trust-funds.
[10] For more information on DI and why it needs to be replenished in 2016, see https://www.cbpp.org/topics/disability.
[11] Kathy Ruffing and Paul N. Van de Water, Congress Needs to Boost Disability Insurance Share of Payroll Tax by 2016, Center on Budget and Policy Priorities, July 31, 2014, https://www.cbpp.org/cms/index.cfm?fa=view&id=4168.
[12] Kathy A. Ruffing and Paul N. Van de Water, Social Security Benefits Are Modest; Kathy A. Ruffing, “Social Security Benefits Are Modest by International Standards,” December 4, 2013, https://www.cbpp.org/blog/social-security-benefits-are-modest-by-international-standards.
[13] Social Security Administration, Income of the Population 55 or Older, 2012, April 2014, Table 3.A7, http://www.ssa.gov/policy/docs/statcomps/income_pop55/2012/index.html. Data cited here are for “beneficiary units,” meaning married couples in which at least one member was over 65 (or unmarried people who were over 65) and collected Social Security.
[14] Center on Budget and Policy Priorities, Top Ten Facts About Social Security, August 9, 2015, https://www.cbpp.org/research/social-security/policy-basics-top-ten-facts-about-social-security.
[15] Jasmine V. Tucker, Virginia P. Reno, and Thomas N. Bethell, Strengthening Social Security: What Do Americans Want?, National Academy of Social Insurance, January 2013, http://www.nasi.org/research/2013/report-strengthening-social-security-what-do-americans-want. A recent report about polarization among Americans on many issues nevertheless found strong support for maintaining and even enhancing Social Security benefits; see Matthew Yglesias, “Americans are divided on everything, except their love of Social Security,” Vox, June 12, 2014, http://www.vox.com/2014/6/12/5803160/americans-are-divided-on-everything-except-their-love-of-social.
More from the Authors