What the 2017 Trustees’ Report Shows About Social Security
Social Security can pay full benefits for close to two decades, the trustees’ latest annual report shows, but will then face a significant, though manageable, funding shortfall. Several key points emerge from the report:
- The trustees estimate that, if policymakers take no further action, Social Security’s combined Old-Age and Survivors Insurance (OASI) and Disability Insurance (DI) trust fund reserves will be depleted in 2034 — same as last year’s report.
- After 2034, Social Security could still pay three-fourths of scheduled benefits using its tax income even if policymakers took no steps to shore up the program. Those who claim that Social Security won’t be around at all when today’s young adults retire and that young workers will receive no benefits either misunderstand or misrepresent the trustees’ projections.
- The program’s shortfall amounts to 1 percent of gross domestic product (GDP) over the next 75 years (and about 1.5 percent of GDP in the 75th year).
- The trustees project that the DI trust fund reserves will last through 2028 — five years later than in last year’s report — because of lower-than-expected applications for, and awards of, DI benefits. The number of DI beneficiaries has declined over the past several years as demographic and economic pressures on the program have eased, and the trustees project that the share of Americans receiving DI will remain stable in the coming decades.
Policymakers should address Social Security’s long-term shortfall primarily by increasing Social Security’s tax revenues.Policymakers should address Social Security’s long-term shortfall primarily by increasing Social Security’s tax revenues. Social Security will necessarily require an increasing share of our nation’s resources in the coming decades as the population ages, and polls show a widespread willingness to support it through higher tax contributions. Recent trends also justify boosting Social Security’s payroll tax revenue: Social Security’s tax base has eroded since the last time policymakers addressed solvency in 1983, largely due to increased inequality and the rising cost of non-taxed fringe benefits, such as health insurance.
Report Holds Few Surprises
The outlook in the 2017 trustees’ report remains similar to last year’s. The report focuses on the next 75 years — a horizon that spans the lifetime of just about everybody now old enough to work.[1] With no tax increases scheduled, the trustees project that the program’s tax income will remain around 13 percent of taxable payroll.[2] (Taxable payroll — the wages and self-employment income up to Social Security’s taxable maximum, currently $127,200 a year — represents slightly over one-third of GDP.) Meanwhile, program costs are expected to climb, largely due to the aging of the population. Costs will grow more steeply for about 20 years and then moderate, rising to roughly 18 percent of taxable payroll in 75 years. Interest earnings, long an important component of the trust funds’ income, will shrink and eventually disappear.
Over the entire 75-year period, the trustees put the Social Security shortfall at 2.83 percent of taxable payroll; the shortfall is concentrated in the later decades of the projection. Expressed as a share of the nation’s economy, the 75-year shortfall equals 1 percent of GDP.
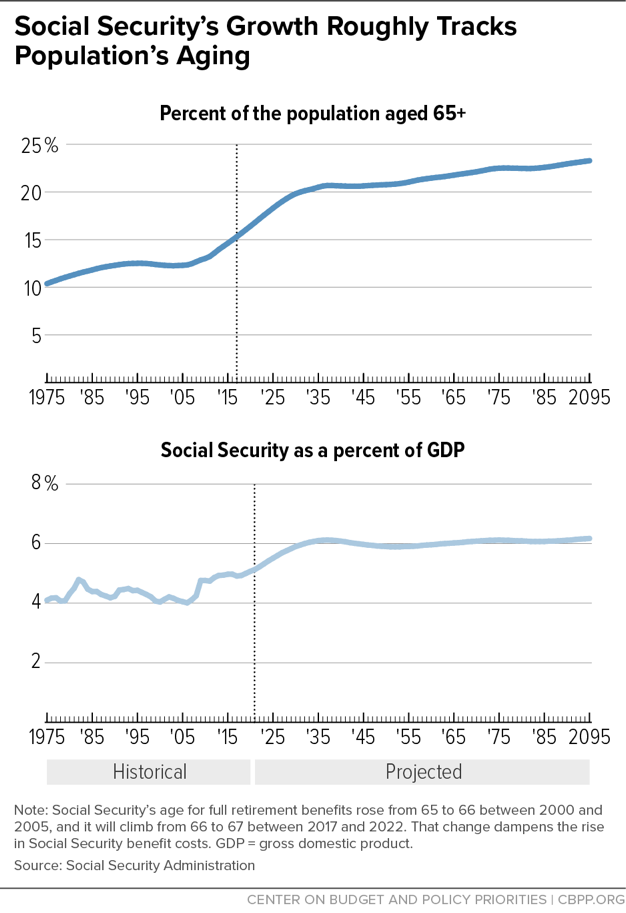
While Social Security provides a safety net to people of all ages — young children and their surviving parents who have lost a family breadwinner, working-age adults who have suffered a serious disability, and retired workers and elderly widows and widowers — about 4 in 5 beneficiaries are older Americans. The elderly share of the population will climb steeply over the next 20 years, from about 1 in 7 Americans to 1 in 5, and then inch up thereafter. Social Security costs as a percentage of GDP will rise slightly less than that due to already enacted increases in the age for full retirement benefits (previously 65, now 66, and eventually 67), which dampen the rise in benefit costs.[3] (See Figure 1.) These facts reinforce the point that Social Security’s fundamental challenge is demographic, traceable to a rising number of beneficiaries rather than to escalating costs per beneficiary.
At first blush, the projected long-term deficit — 2.83 percent of taxable payroll — appears larger than past projections. Those figures are not comparable, however, because the period covered by the reports has shifted. Each one-year shift in the valuation period moves the 75-year balance further into the red by a small amount. Unlike the program’s deficit, the date of trust-fund exhaustion is not affected by the 75-year valuation period, and over the past 20 years the trustees’ projections have ranged between 2032 and 2042. (See Table 1.)
| TABLE 1 | ||||||
|---|---|---|---|---|---|---|
| Trustees’ Estimates Have Fluctuated But Tell a Consistent Story | ||||||
| Change in actuarial balance (as percentage of taxable payroll over 75 years) since previous report due to… | ||||||
| Year of report | Legislation and regulations | Change in valuation period | All other* | Total change | Actuarial balance | Year of exhaustion |
| 1998 | 0.00 | -0.08 | 0.12 | 0.04 | -2.19 | 2032 |
| 1999 | 0.00 | -0.08 | 0.20 | 0.12 | -2.07 | 2034 |
| 2000 | 0.00 | -0.07 | 0.24 | 0.17 | -1.89 | 2037 |
| 2001 | 0.00 | -0.07 | 0.10 | 0.03 | -1.86 | 2038 |
| 2002 | 0.00 | -0.07 | 0.06 | -0.01 | -1.87 | 2041 |
| 2003 | 0.00 | -0.07 | 0.03 | -0.04 | -1.92 | 2042 |
| 2004 | 0.00 | -0.07 | 0.10 | 0.03 | -1.89 | 2042 |
| 2005 | 0.00 | -0.07 | 0.03 | -0.04 | -1.92 | 2041 |
| 2006 | 0.00 | -0.06 | -0.03 | -0.09 | -2.02 | 2040 |
| 2007 | 0.00 | -0.06 | 0.13 | 0.06 | -1.95 | 2041 |
| 2008 | 0.00 | -0.06 | 0.32 | 0.26 | -1.70 | 2041 |
| 2009 | 0.00 | -0.05 | -0.25 | -0.30 | -2.00 | 2037 |
| 2010 | 0.14 | -0.06 | 0.00 | 0.08 | -1.92 | 2037 |
| 2011 | 0.00 | -0.05 | -0.25 | -0.30 | -2.22 | 2036 |
| 2012 | 0.00 | -0.05 | -0.39 | -0.44 | -2.67 | 2033 |
| 2013 | -0.15 | -0.06 | 0.16 | -0.05 | -2.72 | 2033 |
| 2014 | -0.01 | -0.06 | -0.09 | -0.16 | -2.88 | 2033 |
| 2015 | 0.02 | -0.06 | 0.24 | 0.20 | -2.68 | 2034 |
| 2016 | 0.03 | -0.06 | 0.04 | 0.02 | -2.66 | 2034 |
| 2017 | 0.00 | -0.05 | -0.12 | -0.17 | -2.83 | 2034 |
Some commentators cite huge dollar figures that appear in the trustees’ report, such as the $12.5 trillion shortfall over 75 years (or even over the shortfall over the infinite horizon, a measure whose validity many experts question[4]). Except over relatively short periods, however, it is not useful to express Social Security’s income, expenditures, or funding gap in dollar terms, which does not convey a sense of our ability to support the program. Expressing them in relation to taxable payroll or GDP, in contrast, puts them in perspective. Over the next 75 years, for example, taxable payroll will be nearly $470 trillion, and GDP will exceed $1,300 trillion.[5] Thus, the shortfall over the next 75 years equals 2.83 percent of taxable payroll and 1 percent of GDP.[6]
Social Security Will Not Go “Bankrupt” But Needs Shoring Up
2034 is the “headline date” in the trustees’ report, because that is when the combined Social Security trust funds are expected to run out of Treasury bonds to cash in. At that point, if nothing else is done, the program could then pay 77 percent of scheduled benefits, a figure that would slip to 73 percent in 75 years. Contrary to popular misconception, benefits would not stop. [7]
The trustees project that the DI trust fund reserves will last through 2028 — five years later than in last year’s report — because of lower-than-expected applications for, and awards of, DI benefits.[8] The number of DI beneficiaries has declined over the past several years as demographic and economic pressures on the program have eased, and the trustees project that the share of Americans receiving DI will remain stable in the coming decades. The trustees show the number of DI beneficiaries will rise over the next seven years — but that’s mostly because of overall population growth and a legislative change from the 1983 Social Security deal: Social Security’s full retirement age will gradually rise from 66 to 67 over that period. DI beneficiaries are automatically converted to retirement beneficiaries when they reach retirement age, so this long-planned change in the retirement age will increase the number of beneficiaries who are classified as “disabled” rather than “retired.”
Although the exhaustion dates attract media attention, the trustees caution that their projections are uncertain. For example, while 2034 is their best estimate of when the trust funds will be depleted, they judge there is an 80 percent probability that the reserves will be depleted between 2031 and 2039.[9] The Congressional Budget Office (CBO) expects the trust funds to be depleted in 2029.[10] In short, all reasonable estimates show a long-run problem that needs to be addressed but not an immediate crisis.
Following the 1983 Social Security amendments, the trust funds grew dramatically, which has helped to finance the retirement of the baby boom. The principal and interest from the trust funds’ bonds will enable Social Security to keep paying full benefits until 2034. The bonds have the full faith and credit of the United States government, and — as long as the solvency of the federal government itself is not called into question — Social Security will be able to redeem its bonds just as any private investor might do.[11] When Social Security needs to start cashing bonds to pay benefits, the federal government will have to increase its borrowing from the public, raise taxes, or spend less. That will be a concern for the Treasury — but not for Social Security.
DI and OASI are closely related, so policymakers should strengthen both by addressing overall Social Security solvency. Both components of Social Security face similar long-run shortfalls, and their key features — including the tax base, the work history required to become insured for benefits, the benefit formula, and cost-of-living adjustments — are similar or identical. In addition, most DI beneficiaries are close to or past Social Security’s early retirement age of 62. Tackling DI in isolation would leave policymakers with few — and unduly harsh — options. The fact that the trustees project that the DI and OASI trust fund reserves will deplete within seven years of one another makes it more likely that policymakers will address Social Security comprehensively.
Getting Social Security Solvency Right
Policymakers need to strengthen Social Security. Nearly every American participates in Social Security, first as a worker and eventually as a beneficiary. The program’s benefits are the foundation of income security in old age, though they are modest both in dollar terms and compared with benefits in other countries.[12] Millions of beneficiaries have no income other than Social Security.[13]
Because Social Security benefits are so modest and make up the principal source of income for most beneficiaries, policymakers should restore solvency primarily by increasing Social Security’s tax revenues. Revenues could come from raising the maximum amount of wages subject to the payroll tax (which now covers only about 83 percent of covered earnings, well short of the 90 percent figure envisioned in the 1977 Social Security amendments); broadening the tax base by subjecting voluntary salary-reduction plans, such as cafeteria plans and health care Flexible Spending Accounts, to the payroll tax (as 401(k) plans are); and raising the payroll tax rate by small steps.[14]
Future workers are expected to be more prosperous than today’s. Under the trustees’ assumptions, the average worker will be about a third better off — in real terms — in 2035 than in 2017, and more than twice as well off by 2075. It is appropriate to devote a small portion of those gains to the payroll tax, while still leaving future workers with much higher take-home pay. Social Security is a popular program, and poll respondents of all ages and incomes express a willingness to support it through higher taxes.[15] Policymakers need to design reforms judiciously so that Social Security remains the most effective and successful income security program in the nation’s history.
Other versions of this report
End Notes
[1] The 2017 Annual Report of the Board of Trustees of the Federal Old-Age and Survivors Insurance and Federal Disability Insurance Trust Funds, July 2017, https://www.ssa.gov/OACT/TR/2017/index.html.
[2] See Table IV.B1, “Annual Income Rates, Cost Rates, and Balances,” https://www.ssa.gov/OACT/TR/2016/lrIndex.html. Payroll taxes equal 12.4 percent of taxable payroll, while dedicated income taxes that higher-income beneficiaries pay on a portion of their Social Security benefits contribute a gradually rising percentage of taxable payroll.
[3] The scheduled rise in the full retirement age from 66 to 67, to phase in between 2017 and 2022, slows the growth of program costs, as the previous rise from 65 to 66 did. For an explanation, see the box, “Why Does Raising the Retirement Age Reduce Benefits?” in Kathy Ruffing and Paul N. Van de Water, Social Security Benefits Are Modest, Center on Budget and Policy Priorities, updated December 11, 2015, https://www.cbpp.org/research/social-security/social-security-benefits-are-modest.
[4] See letter from the American Academy of Actuaries to the Trustees of the Social Security System and the Social Security Advisory Board, December 19, 2003, http://www.actuary.org/pdf/socialsecurity/tech_dec03.pdf. See also Kathy Ruffing, Paul N. Van de Water, and Richard Kogan, “Generational Accounting” Is Complex, Confusing, and Uninformative, Center on Budget and Policy Priorities, February 6, 2014, https://www.cbpp.org/research/generational-accounting-is-complex-confusing-and-uninformative.
[5] All figures discounted to today’s dollars.
[6] Trustees’ Report, Tables IV.B5 and VI.F1. Note that both these 75-year figures include an extra margin for a target trust-fund balance at the end of the 75-year projection period. Without that buffer, which is set at 100 percent of the next year’s estimated Social Security outlays, the shortfall would be slightly smaller.
[7] Noah P. Meyerson, “Social Security: What Would Happen If the Trust Funds Ran Out?” Congressional Research Service, August 28, 2014, https://www.fas.org/sgp/crs/misc/RL33514.pdf.
[8] In addition, the 2015 bipartisan budget agreement extended DI solvency by temporarily reallocating payroll taxes between the DI and OASI trust funds, which extended the solvency of the DI trust fund but did not affect the projected exhaustion year of the OASI fund.
[9] Trustees’ Report, Table VI.E1.
[10] The 2016 Long-Term Projections for Social Security: Additional Information, December 2016, https://www.cbo.gov/sites/default/files/114th-congress-2015-2016/reports/52298-socialsecuritychartbook.pdf.
[11] Paul N. Van de Water, Understanding the Social Security Trust Funds, Center on Budget and Policy Priorities, updated August 9, 2016, https://www.cbpp.org/research/social-security/understanding-the-social-security-trust-funds.
[12] Kathy A. Ruffing and Paul N. Van de Water, Social Security Benefits Are Modest, Center on Budget and Policy Priorities, updated December 11, 2015, https://www.cbpp.org/research/social-security/social-security-benefits-are-modest.
[13] Policy Basics: Top Ten Facts About Social Security, Center on Budget and Policy Priorities, updated August 12, 2016, https://www.cbpp.org/research/social-security/policy-basics-top-ten-facts-about-social-security.
[14] Kathleen Romig, Increasing Payroll Taxes Would Strengthen Social Security, Center on Budget and Policy Priorities, September 27, 2016, https://www.cbpp.org/research/social-security/increasing-payroll-taxes-would-strengthen-social-security.
[15] Elisa A. Walker, Virginia P. Reno, and Thomas N. Bethell, Americans Make Hard Choices on Social Security: A Survey with Trade-Off Analysis, National Academy of Social Insurance, October 2014, https://www.nasi.org/research/2014/report-americans-make-hard-choices-social-security-survey-tr. Another report about polarization among Americans on many issues nevertheless found strong support for maintaining and even enhancing Social Security benefits; see Matthew Yglesias, “Americans are divided on everything, except their love of Social Security,” Vox, June 12, 2014, http://www.vox.com/2014/6/12/5803160/americans-are-divided-on-everything-except-their-love-of-social.
More from the Authors