After Decades of Costly, Regressive, and Ineffective Tax Cuts, a New Course Is Needed

Testimony of Samantha Jacoby, Senior Tax Legal Analyst, Center on Budget and Policy Priorities, Before the Senate Committee on the Budget

Chairman Whitehouse, Ranking Member Grassley, members of the Committee, thank you for the opportunity to testify before you this morning at this important hearing. I am Samantha Jacoby, Senior Tax Legal Analyst at the Center on Budget and Policy Priorities, a nonpartisan research and policy institute in Washington, D.C.

In my testimony, I will make three main points:

  • First, tax cuts enacted in the last 25 years — namely, the tax cuts enacted in 2001 and 2003 under President Bush, most of which were made permanent in 2012, and those enacted in 2017 under President Trump — gave windfall tax cuts to households in the top 1 percent and large corporations, exacerbating income and wealth inequality. These tax cuts cost significant federal revenue, adding to the federal debt and limiting our ability to invest in policies that broaden opportunity and contribute to shared prosperity.
  • Second, extending the Trump tax cuts that expire at the end of 2025 would continue to mostly benefit the well-off and, if not paid for, would add considerably to the nation’s long-term fiscal challenges. Permanently extending the cuts would benefit households in the top 1 percent more than twice as much as those in the bottom 60 percent as a share of their incomes — providing a roughly $41,000 annual tax cut for the top 1 percent compared to $500 for households in the bottom 60 percent, on average — at a cost of around $300 billion per year. This would be on top of the large benefits high-income households will continue to receive from the 2017 tax law’s permanent provisions.
  • Third, instead of doubling down on the failed trickle-down path of the Bush and Trump tax cuts, policymakers should set a new course by partially reversing the 2017 law’s flawed corporate tax cut, strengthening its international tax provisions, and reconsidering the tax code’s large tax breaks for high-income and high-wealth households. Doing so would make the tax code more progressive and raise substantial revenues that could be used to address the nation’s long-term fiscal challenges and pay for important policy priorities. This approach stands in stark contrast to the House Republican debt limit bill, which would force deep cuts in a host of national priorities; leave more people hungry, homeless, and without health coverage; and make it easier for wealthy people to cheat on their taxes.[1]

The Wealthy and Corporations Have Received Massive Tax Cuts in Recent Decades

U.S. policymakers have substantially reduced taxes for wealthy households in recent decades. The 2001 and 2003 Bush tax cuts[2] reduced individual income tax rates, taxes on capital gains and dividends, and the tax on estates, all of which provided the largest benefits to the highest-income taxpayers. Though policymakers let many of the Bush tax cuts for high-income households expire in 2013, the 2017 Trump tax cuts again lowered individual income tax rates (including the top rate) and weakened the estate tax, so that it applied only to the wealthiest estates: those worth more than $11 million per person or $22 million per couple, indexed for inflation. The 2017 law also created a large new tax deduction on “pass-through” business income (business income from partnerships, S corporations, and sole proprietorships) and enacted large and permanent tax cuts for corporations.

Taken together, these tax cuts disproportionately flowed to households at the top and cost significant federal revenues, adding trillions to the national debt since their enactment.[3] By shrinking revenues, these tax cuts limit policymakers’ ability and willingness to make public investments that pay off in tangible and important ways for individuals, families, communities, and the country as a whole.

Bush Tax Cuts Disproportionately Benefited High-Income Households

The 2001 tax cuts dramatically reduced the top four marginal income tax rates.[4] The top rate dropped from 39.6 percent to 35 percent, and the next bracket fell from 36 percent to 33 percent. The 2001 law also phased out the estate tax, repealing it entirely in 2010.

The 2003 law cut taxes on capital gains and dividends. Before the law, long-term capital gains were taxed at 20 percent and dividends were subject to ordinary income tax rates. The law reduced the rate on long-term capital gains and qualified dividends to 15 percent.

In addition, the tax cuts included three components that are often referred to as “middle-class” tax cuts, including a new bottom income tax rate of 10 percent, an increase in the Child Tax Credit from $500 to $1,000 per child and changes that made many working families with low incomes eligible for the credit, and “marriage penalty relief” that reduced taxes for some married couples. Many higher-income people benefited from these provisions as well.[5]

The largest benefits from the Bush tax cuts flowed to high-income taxpayers. From 2004-2012 (the years for which the Tax Policy Center (TPC) provides data that are comparable from year to year), the top 1 percent of households received average tax cuts of more than $65,000 each year, totaling nearly $700,000 in tax cuts over this period.[6]

High-income taxpayers also received the largest tax cuts as a share of their after-tax incomes. TPC estimated that in 2010, the year the tax cuts were fully phased in, they raised the after-tax incomes of the top 1 percent of households by 6.7 percent, while only raising the after-tax incomes of the middle 20 percent of households by 2.8 percent.[7] The bottom 20 percent of households received the smallest tax cuts, with their after-tax incomes increasing by just 1.0 percent.[8]

These cuts lost significant revenue: the cost of the tax laws enacted during George W. Bush’s administration is equal to roughly 2 percent of GDP in 2010.[9]

Evidence suggests that instead of “paying for themselves” by delivering increased economic growth, as advocates promised, the tax cuts enacted in 2001 and 2003 — particularly those for high-income households — ballooned deficits and debt and contributed to a rise in income inequality.[10] And there is little evidence they boosted growth. An analysis of the tax cuts by Brookings Institution economist William Gale and Dartmouth professor Andrew Samwick, former chief economist on George W. Bush’s Council of Economic Advisers, found that “there is, in short, no first-order evidence in the aggregate data that these tax cuts generated growth.”[11]

Nearly all of the tax cuts were originally scheduled to expire at the end of 2010, but policymakers extended many of their provisions for two years as part of a budget deal in December 2010. This agreement reinstated the estate tax starting in 2011, but with a lower tax rate and higher exemption levels, applying only to the wealthiest estates (those worth more than $5 million per person or $10 million per couple, indexed for inflation). And in 2012 policymakers agreed to make permanent the tax provisions affecting households with low and moderate incomes, but allowed certain tax rate cuts that affected only the highest-income taxpayers to expire, including restoring the top income tax rate to its previous level of 39.6 percent. This agreement made about 82 percent of the cost of the Bush tax cuts permanent.[12]

Trump Tax Cuts Created New Costly Tax Advantages for the Wealthy

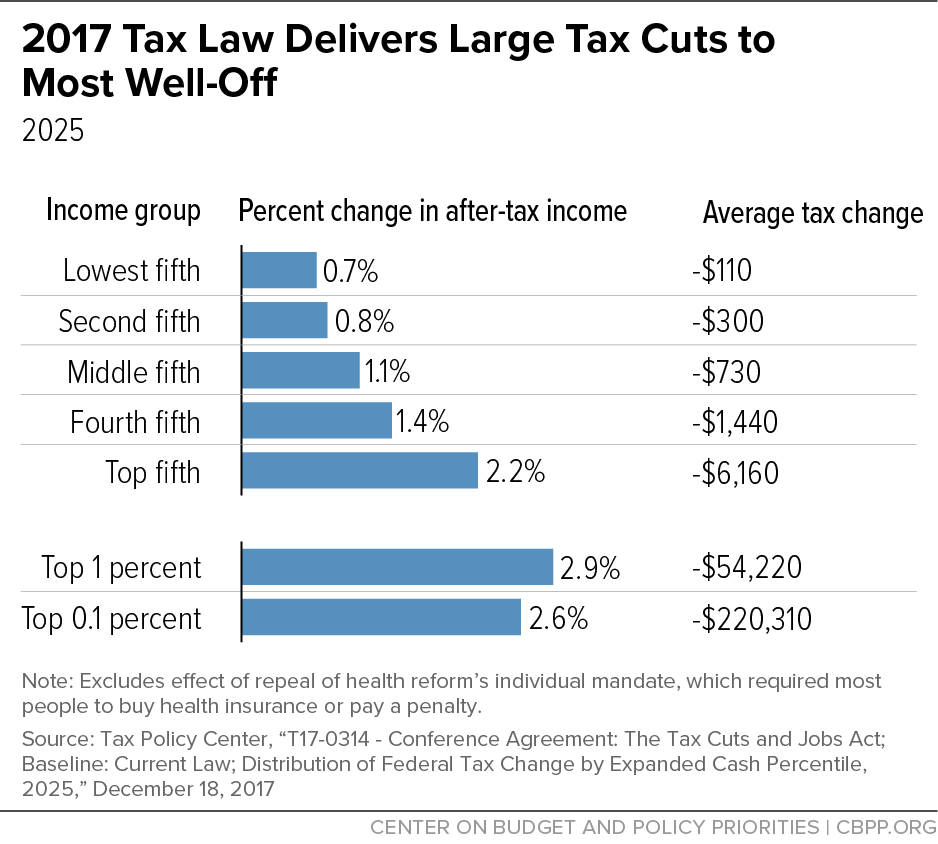
Like the Bush tax cuts, the tax cuts enacted in 2017 under President Trump benefited high-income households far more than households with low and moderate incomes. The 2017 tax law will boost the after-tax incomes of households in the top 1 percent by 2.9 percent in 2025, roughly three times the 0.9 percent gain for households in the bottom 60 percent, TPC estimates.[13] The tax cuts that year will average $54,220 for the top 1 percent — and $220,310 for the top one-tenth of 1 percent. (See Figure 1.) The 2017 tax law also widens racial disparities in after-tax income.[14]

The law’s tilt to the top reflects several costly provisions that primarily benefit the most well-off:

  • Large, permanent corporate tax cuts. The centerpiece of the 2017 tax law was a deep, permanent cut in the corporate tax rate — from 35 percent to 21 percent — and a shift toward a territorial tax system, which exempts certain foreign income of multinational corporations from U.S. tax. At a cost of $1.3 trillion over ten years,[15] the deep cut in the corporate tax rate was the most expensive provision of the 2017 tax law, largely benefiting the most well-off. TPC estimates that over a third of the benefits from corporate rate cuts flows to the top 1 percent of households.[16] Proponents of these regressive corporate rate cuts argued that the benefits would trickle down in the form of broadly shared economic growth.[17] But a careful new study from researchers at the University of California, Berkeley, the Federal Reserve Board, and the Joint Committee on Taxation (JCT) finds that none of the earnings gains from the 2017 corporate rate cuts accrued to the bottom 90 percent of the income distribution, and this group received just a small fraction of the overall economic gains.[18]
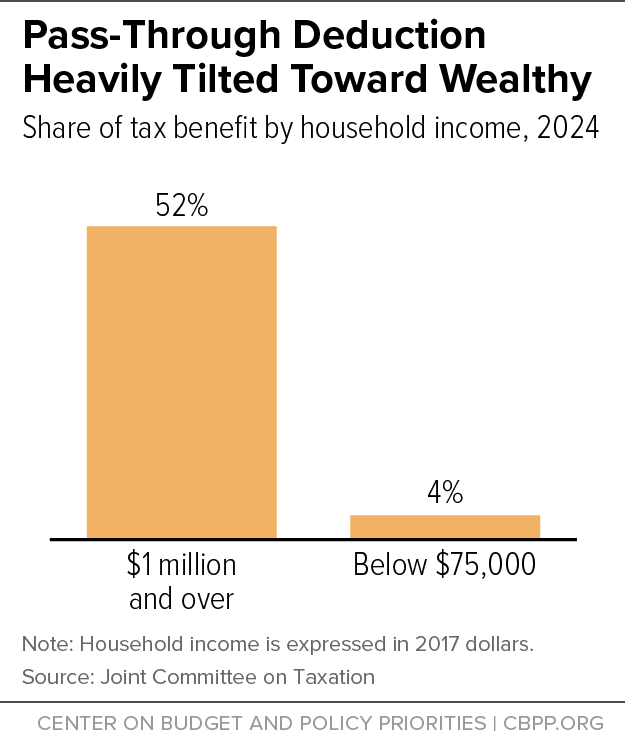
  • 20 percent deduction for pass-through income. The law adopted a new 20 percent deduction for certain income that owners of pass-through businesses (partnerships, S corporations, and sole proprietorships) report on their individual tax returns, which previously was generally taxed at the same rates as wage and salary income. The deduction costs around $50 billion a year through 2025[19] and its benefits are highly tilted toward the wealthy; over half of its benefits will go to households with more than $1 million in income in 2024, according to JCT.[20] (See Figure 2.)

    Wealthy households benefit the most from the deduction because they receive most pass-through income,[21] they get a much larger share of their income from pass-throughs than the middle class does,[22] and they receive the largest tax break per dollar of income deducted (because they are in the top income tax brackets). The deduction also creates new opportunities for high-income taxpayers to game the provision to maximize deductions.[23] Complex and valuable tax benefits like the pass-through deduction encourage taxpayers to push the boundary between lawful tax avoidance — itself engaged in by people with access to well-paid tax advisors — and unlawful evasion, and plummeting pass-through audit rates give them more leeway to do so.[24]

  • In addition to these and other flaws,[25] recent research from economists at the Treasury and the Federal Reserve found no evidence that the deduction provided any boost in economic activity in the two years following the deduction’s enactment — no additional investment, jobs, or higher wages for employees of pass-through businesses.[26]
  • Cutting individual income tax rates for those at the top. The law cut the top individual income tax rate from 39.6 percent to 37 percent for married couples with over $600,000 in taxable income. By itself, this provided a couple with $2 million in taxable income a $36,400 tax cut. The law also weakened the alternative minimum tax (AMT), which is designed to ensure that higher-income people who take large amounts of deductions and other tax breaks pay at least a minimum level of tax. The law raised both the AMT’s exemption threshold and its phaseout, delivering another tax cut to affluent households.
  • Doubling the estate tax exemption. The law doubled the amount that the wealthiest households can pass on tax free to their heirs, from $11 million per couple to $22 million, (indexed for inflation). The few estates large enough to remain taxable — fewer than 1 in 1,000 estates nationwide — will receive a tax cut of $4.4 million per couple.[27]

Extending the Trump Tax Cuts Would Double Down on the Law’s Flaws

Most of the 2017 law’s corporate tax provisions are permanent, but nearly all of its other changes — including changes to the individual income tax and the estate tax — are set to expire after 2025. Extending all of these provisions would be an expensive policy mistake, costing around $300 billion per year.[28]

These expiring provisions include some provisions affecting families with low and moderate incomes, but often in offsetting ways. For example, the law lowered statutory tax rates at all income levels, nearly doubled of the size of the standard deduction from $13,000 to $24,000 for a married couple in 2018, and doubled the size of the Child Tax Credit for many families.[29] Yet other provisions raised taxes on families, such as the elimination of personal exemptions and the new, permanent inflation adjustment for key tax parameters.[30] The end result of these offsetting changes is only modest tax cuts overall for most families, which pale in comparison to the law’s large net tax cuts for the wealthy.

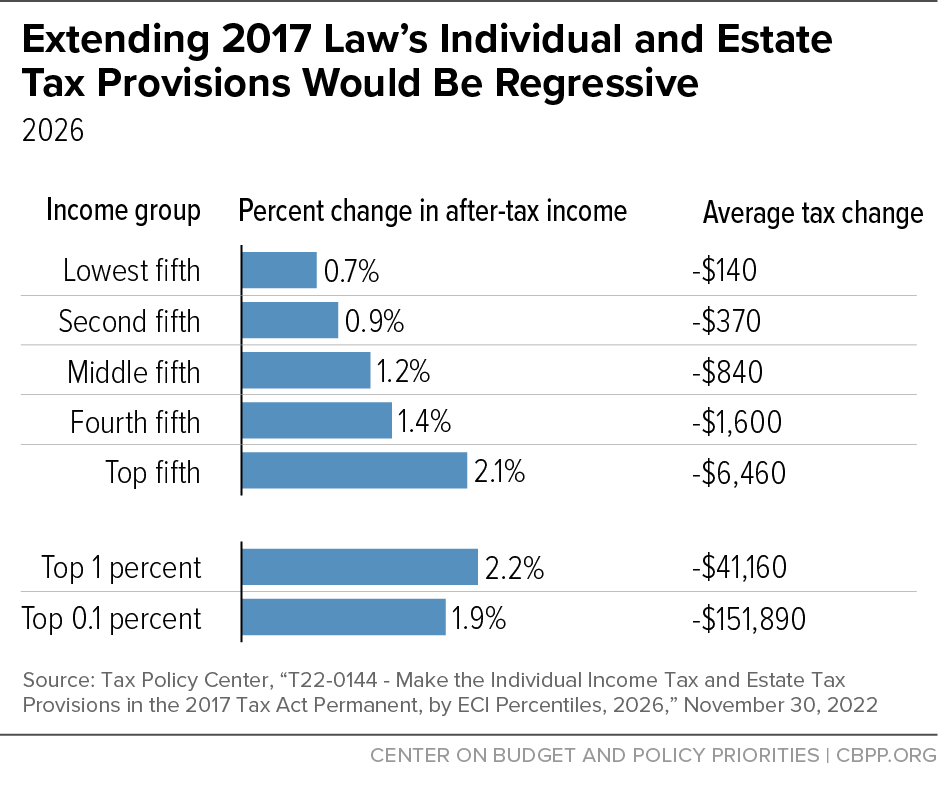
The expiring provisions primarily benefiting affluent households — the cut in the top tax rate, the pass-through deduction, the weakened AMT, and estate tax cuts — account for a majority of the total cost of extending the law’s expiring provisions.[31] Extending the individual income tax and estate tax provisions would boost after-tax incomes for the top 1 percent more than twice as much as for the bottom 60 percent as a percentage of their incomes.[32] (See Figure 3.) In dollar terms, this is a $41,000 annual tax cut for households in the top 1 percent but only about $500 for those in the bottom 60 percent of households, on average.[33] These benefits would be on top of the very large benefits wealthy households receive from the law’s permanent corporate tax cuts.

CBO estimated in 2018 that the 2017 law would cost $1.9 trillion over ten years (not including the cost of interest payments on the debt from resulting larger deficits).[34] Making the individual tax cuts permanent would add another roughly $2.6 trillion in cost from 2024 to 2033, or $300 billion a year beginning in 2027.[35] Making other parts of the law permanent, such as the “expensing” tax break for business investments, which some policymakers have called for, would add hundreds of billions more to this cost.[36]

Steps to Creating a Better Tax System

Instead of doubling down on the flawed trickle-down path of the Bush and Trump tax cuts, there are opportunities to work toward a tax code that raises more needed revenues, is more progressive and equitable, and supports investments that make the economy work for everyone. A crucial first step is allowing the 2017 tax law’s provisions primarily benefiting high-income households to expire. Additional steps include scaling back the 2017 law’s large corporate tax cuts, ensuring that more income of very wealthy households faces annual taxation, and limiting other tax breaks primarily benefiting high-income households.

Reforming the 2017 Law’s Costly and Regressive Corporate Provisions

The 2017 law’s permanent corporate provisions are heavily tilted in favor of large corporations and their shareholders, who are disproportionately wealthy. Cutting corporate taxes costs significant revenue, and evidence is sorely lacking that the benefits have trickled down. Executives, disproportionately wealthy corporate shareholders, and highly paid employees have reaped virtually all the economic gains from the corporate rate cuts, research suggests.[37]

Reforming the corporate tax — such as by partially reversing the law’s deep rate cut to 28 percent, or halfway between the pre-2017 law 35 percent and the current 21 percent rate — would make the tax code more progressive while generating substantial revenue to fund national priorities.

The 2017 law’s international tax rules also require reforms to more effectively deter costly profit shifting and to better align with the global minimum tax agreement.[38] The 2017 law exempted certain foreign income of U.S. multinationals from U.S. tax and added several provisions, including the global intangible low tax income (GILTI) minimum tax, to try to limit incentives for foreign profit shifting. These provisions have serious design flaws, however, and leave significant room for multinationals to avoid taxes by shifting their profits to low-tax countries.[39]

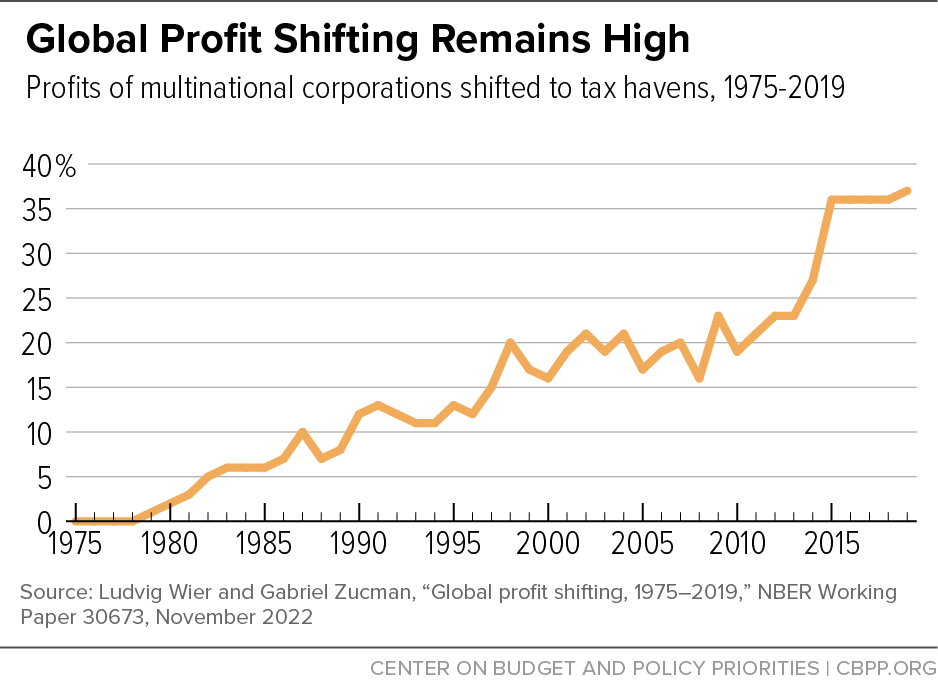
In 2019, two years after the 2017 tax law was enacted, economists Ludvig Wier and Gabriel Zucman found “no discernible decline in global profit shifting or in profit shifting by U.S. multinationals.”[40] (See Figure 4.) This profit shifting costs significant revenue: globally, multinational corporations shift to tax havens about 36 cents of every dollar they make in profits, research suggests.[41]

Strengthening international tax rules by aligning them with the recent multilateral minimum tax agreement would increase the taxes multinationals pay to the United States. It would do so by ensuring that U.S. multinationals’ foreign profits are taxed at a rate closer to that which applies to domestic profits, and that more foreign profits are subject to the tax, which would greatly reduce the tax savings from reporting income offshore. It would also penalize foreign multinationals that operate in the U.S. if they earn profits in a country that does not impose adequate taxes. On the other hand, failing to update our rules would mean that another country could levy extra taxes on a U.S. multinational that operates within its borders — tax revenue that should be flowing to the U.S.[42]

There is little evidence that previous corporate tax cuts delivered the economic growth that proponents promised, particularly for lower- and middle-income workers. And there is no reason to believe that partially unwinding those cuts — by reducing the large cut in the corporate tax rate and restructuring international tax provisions to adhere to the global minimum tax agreement — would significantly harm the economy. Moreover, using the revenue from corporate tax increases to finance high-return public investments can boost growth. For example, compelling research finds that infants in families with lower incomes who receive more support from child-related tax benefits go on to have higher test scores, high school graduation rates, and earnings into young adulthood, all of which support a strong economy.[43]

Ensuring That More Income of Very Wealthy People Faces Annual Taxation, Reducing Special Breaks

Despite accumulating large capital gains as their assets appreciate, wealthy households won’t owe income tax on those gains until they sell their assets. And if they never sell, neither they nor their heirs will ever owe income tax on those gains. This makes taxes on capital gains largely voluntary for many of the nation’s wealthiest people.

Moreover, even when wealthy households do pay tax, they benefit from special low tax rates on capital income and other tax breaks that reduce their taxes. As a result of these policies, the progressive federal income tax breaks down at the very top of the income distribution.[44]

To address this dynamic, policymakers could institute a tax similar to the 25 percent minimum tax on multimillionaires in President Biden’s 2023 budget proposal. The proposal would treat unrealized capital gains as taxable income for the wealthiest people in the country and includes several helpful features to mitigate concerns about liquidity or losses due to stock market declines.[45]

In addition, policymakers could end the “stepped-up basis” loophole by taxing capital gains of affluent households when assets are transferred to heirs. This would prevent the wealthy from permanently avoiding income tax on massive amounts of their income, helping to counter income and wealth inequality[46] and generating significant revenue that our nation needs.

Policymakers should also consider rolling back other special tax breaks that primarily benefit high-income households. One of the simplest ways to do so is by taxing income from capital gains and dividends — which are highly concentrated at the top — at the same rates as wage and salary income. Other proposals include closing a loophole that allows certain pass-through business owners to avoid a 3.8 percent Medicare tax that others pay;[47] ending the “carried interest” loophole, which lets private equity executives treat their compensation as capital gains;[48] and repealing the “like-kind” exchange tax break, which lets real estate developers avoid capital gains tax even when they sell buildings and receive profits.[49]

Critics of increasing taxes on high-income and high-wealth households often argue that doing so would stifle economic growth by reducing the return to capital investment and discouraging economic activity. Yet this belief, which has been subject to extensive research and analysis, does not fare well under scrutiny.[50]

These proposed reforms to the corporate and high-income provisions of the tax code — in addition to letting the 2017 law provisions benefiting affluent households expire as scheduled — belong at the center of future tax debates. They would generate substantial progressive revenue that the U.S. could use to fund new investments or address long-term fiscal challenges, benefiting workers, families, and businesses.

Topics:

End Notes

[1] Sharon Parrott et al., “McCarthy Bill Uses Debt Ceiling to Force Harmful Policies, Deep Cuts,” CBPP, April 24, 2023, https://www.cbpp.org/research/federal-budget/mccarthy-bill-uses-debt-ceiling-to-force-harmful-policies-deep-cuts.

[2] The most significant tax policy changes enacted under President George W. Bush were the 2001 and 2003 tax cuts, often referred to as the “Bush tax cuts” but formally named the Economic Growth and Tax Relief Reconciliation Act of 2001 (EGTRRA) and the Jobs and Growth Tax Relief Reconciliation Act of 2003 (JGTRRA).

[3] The Center for American Progress estimates that the Bush and Trump tax cuts combined will have added $10 trillion to the federal debt by the end of 2023, taking into account both the revenue lost and the associated debt service costs since their enactment. See Bobby Kogan, “Tax Cuts Are Primarily Responsible for the Increasing Debt Ratio,” Center for American Progress, March 27, 2023, https://www.americanprogress.org/article/tax-cuts-are-primarily-responsible-for-the-increasing-debt-ratio/.

[4] Emily Horton, “The Legacy of the 2001 and 2003 ‘Bush’ Tax Cuts,” CBPP, updated October 23, 2017, https://www.cbpp.org/research/federal-tax/the-legacy-of-the-2001-and-2003-bush-tax-cuts.

[5] All high-income taxpayers benefited from the creation of a new 10 percent rate at the bottom, and some high-income married couples benefited from the “marriage penalty relief” provision.

[6] Average tax cuts are expressed in 2023 dollars. Tax change is distributed by percentiles of cash income adjusted for family size. These tax cuts include the amount by which the tax cuts increased the cost of raising the threshold for the alternative minimum tax (AMT). Partly due to the Bush tax cuts, the AMT — designed to ensure that higher-income people who take large amounts of deductions and other tax breaks pay at least a minimum level of tax — would have hit a growing number of middle-class taxpayers. See Aviva Aron-Dine and Robert Greenstein, “The AMT’s Growth Was Not ‘Unintended,’” CBPP, November 30, 2007, https://www.cbpp.org/research/the-amts-growth-was-not-unintended. These cuts also include the rebates in the 2008 stimulus package (passed under President Bush), and the initial phasedown of the estate tax through 2010. They do not include the tax provisions of the 2009 stimulus package (passed under President Obama) or the estate tax cuts in 2011 and 2012 that prevented the estate tax from returning to its original level after 2010. Chye-Ching Huang and Nathaniel Frentz, “Bush Tax Cuts Have Provided Extremely Large Benefits to Wealthiest Americans Over Last Nine Years,” CBPP, July 30, 2012, https://www.cbpp.org/research/bush-tax-cuts-have-provided-extremely-large-benefits-to-wealthiest-americans-over-last-nine.

[7] Tax Policy Center, “T10-0232 - Current Law; Baseline: Pre-EGTRRA Law; Distribution by Cash Income Percentile, 2010,” September 14, 2010, https://www.taxpolicycenter.org/model-estimates/distributional-impact-bush-tax-cuts-2004-2010/current-law-baseline-pre-egtrra-law-12.

[8] Ibid.

[9] This figure is based on a compilation of Congressional Budget Office (CBO) cost estimates that includes both the revenue and outlay effects of all major tax legislation enacted during the George W. Bush Administration. Based on analysis in Kathy Ruffing and Joel Friedman, “Economic Downturn and Legacy of Bush Policies Continue to Drive Large Deficits,” CBPP, February 28, 2013, https://www.cbpp.org/research/economic-downturn-and-legacy-of-bush-policies-continue-to-drive-large-deficits. For a detailed description of methodology used in this analysis, see box, “What Did Bush-Era Tax Cuts Cost through 2011?” in Kathy Ruffing and James R. Horney, “Downturn and Legacy of Bush Policies Drive Large Current Deficits,” CBPP, updated October 10, 2012, https://www.cbpp.org/research/downturn-and-legacy-of-bush-policies-drive-large-current-deficits.

[10] “Chart Book: The Bush Tax Cuts,” CBPP, December 12, 2012, https://www.cbpp.org/research/chart-book-the-bush-tax-cuts.

[11] William Gale and Andrew Samwick, “Effects of Income Tax Changes on Economic Growth,” Brookings Institution, February 2016, https://www.brookings.edu/wp-content/uploads/2016/07/09_Effects_Income_Tax_Changes_Economic_Growth_Gale_Samwick_.pdf.

[12] Chye-Ching Huang, “Budget Deal Makes Permanent 82 Percent of President Bush’s Tax Cuts,” CBPP, January 3, 2013, https://www.cbpp.org/research/budget-deal-makes-permanent-82-percent-of-president-bushs-tax-cuts.

[13] 2025 is when the law is fully phased in and is before many provisions in the law are scheduled to expire. Tax Policy Center, “T17-0314 - Conference Agreement: The Tax Cuts and Jobs Act; Baseline: Current Law; Distribution of Federal Tax Changes by Expanded Cash Income Percentile, 2025,” December 18, 2017, https://www.taxpolicycenter.org/model-estimates/conference-agreement-tax-cuts-and-jobs-act-dec-2017/t17-0314-conference-agreement.

[14] Due to racial barriers to economic opportunity, households of color are overrepresented at the bottom of the income distribution while non-Hispanic white households are heavily overrepresented at the top. The 2017 tax law’s core provisions tilt heavily toward households at the top of the income distribution: white households in the highest-earning 1 percent receive 23.7 percent of the law’s total tax cuts, far more than the 13.8 percentage share that the bottom 60 percent of households of all races receive. Chye-Ching Huang and Roderick Taylor, “How the Federal Tax Code Can Better Advance Racial Equity,” CBPP, July 25, 2019, https://www.cbpp.org/research/federal-tax/how-the-federal-tax-code-can-better-advance-racial-equity.

[15] Joint Committee on Taxation, “Estimated Budget Effects Of The Conference Agreement For H.R.1, The Tax Cuts And Jobs Act,” JCX-67-17, December 18, 2017, https://www.jct.gov/publications/2017/jcx-67-17/.

[16] Tax Policy Center, “T17-0180 - Share of Change in Corporate Income Tax Burden; By Expanded Cash Income Percentile, 2017,” June 6, 2017, https://www.taxpolicycenter.org/model-estimates/distribution-change-corporate-tax-burden-june-2017/t17-0180-share-change-corporate.

[17] Council of Economic Advisers, “Corporate Tax Reform and Wages: Theory and Evidence,” October 2017, https://trumpwhitehouse.archives.gov/sites/whitehouse.gov/files/documents/Tax%20Reform%20and%20Wages.pdf#:~:text=Using%20conservative%20estimates%20from%20the%20academic%20literature%20on,in%20current%20dollars%20by%20at%20least%20%244%2C000%2C%20conservatively.

[18] Patrick J. Kennedy et al., “The Efficiency-Equity Tradeoff of the Corporate Income Tax: Evidence from the Tax Cuts and Jobs Act,” January 20, 2022, https://eml.berkeley.edu/~saez/course/kennedyetal2023TCJA.pdfWhen accounting for the fact that some workers benefit indirectly from equity ownership, the study finds that 78 percent of the overall economic gains accrue to the top 10 percent of the income distribution and just 22 percent flow to the bottom 90 percent. (Breakdowns within the bottom 90 percent are not reported, but equity ownership is highly concentrated toward the top of the income distribution).

[19] Joint Committee on Taxation, op cit.

[20] Household income is expressed in 2017 dollars. Joint Committee on Taxation, “Tables Related to the Federal Tax System as in Effect 2017 through 2026,” JCX-32r-18, April 24, 2018, https://www.jct.gov/publications/2018/jcx-32r-18/.

[21] For example, around 70 percent of the income of partnerships, a common pass-through structure, flows to the top 1 percent of households. Michael Cooper et al., “Business in the United States: Who Owns It, and How Much Tax Do They Pay?” Tax Policy and the Economy, Vol. 30, No. 1, 2016, https://www.journals.uchicago.edu/doi/full/10.1086/685594#.

[22] Congressional Budget Office, “The Distribution of Household Income, 2019,” November 15, 2022, https://www.cbo.gov/publication/58353.

[23] For example, see Lucas Goodman et al., “How Do Business Owners Respond to a Tax Cut? Examining the 199A Deduction for Pass-through Firms,” NBER Working Paper 28680, November 2022, https://www.nber.org/system/files/working_papers/w28680/w28680.pdf.

[24] Since 2011, the audit rate for partnerships has declined by almost 90 percent, with less than 0.05 percent of partnerships audited in 2019. IRS, “SOI Tax Stats - IRS Data Book,” 2021, Table 17.

[25] Samantha Jacoby, “Repealing Flawed ‘Pass-Through’ Deduction Should Be Part of Recovery Legislation,” CBPP, June 1, 2021, https://www.cbpp.org/research/federal-tax/repealing-flawed-pass-through-deduction-should-be-part-of-recovery-legislation.

[26] Lucas Goodman et al., op. cit.

[27] CBPP, “2017 Tax Law Weakens Estate Tax, Benefiting Wealthiest and Expanding Avoidance Opportunities,” June 1, 2018, https://www.cbpp.org/research/federal-tax/2017-tax-law-weakens-estate-tax-benefiting-wealthiest-and-expanding-avoidance.

[28] See Congressional Budget Office, Budget and Economic Data, 10-Year Budget Projections, Revenue Projections by Category, May 2022, https://www.cbo.gov/system/files/2022-05/51138-2022-05-Revenue-Projections.xlsx. This figure does not include the cost of interest payments on the debt from resulting larger deficits.

[29] The law doubled the Child Tax Credit’s maximum value from $1,000 to $2,000 per child but denied millions of children in families with low and moderate incomes the full increase. In tax year 2022, roughly 19 million children get less than the full $2,000 Child Tax Credit or no credit at all because their families’ incomes are too low. Tax Policy Center, “T22-0123 – Distribution of Tax Units and Qualifying Children by Amount of Child Tax Credit (CTC), 2022,” October 18, 2022, https://www.taxpolicycenter.org/model-estimates/children-and-other-dependents-receipt-child-tax-credit-and-other-dependent-tax. Further, the law was estimated in 2017 to have ended the Child Tax Credit for about 1 million children who weren’t eligible for a Social Security number because of their immigration status but might have been claimed as tax dependents using an Individual Tax Identification Number. CBPP, “2017 Tax Law’s Child Credit: A Token or Less-Than-Full Increase for 26 Million Kids in Working Families,” August 27, 2018, https://www.cbpp.org/research/federal-tax/2017-tax-laws-child-credit-a-token-or-less-than-full-increase-for-26-million.

[30] The 2017 law permanently switched from the Consumer Price Index for all urban consumers (CPI-U) to the “chained” CPI to adjust tax brackets and certain provisions for inflation each year. The chained CPI generally rises more slowly over time than traditional the CPI-U. This slower growth erodes the value of certain provisions, such as the Earned Income Tax Credit, and is expected to push more taxpayers into higher tax brackets over time.

[31] See CBO, Budget and Economic Data, op. cit.

[32] Tax Policy Center, “T22-0144 – Make the Individual Income Tax and Estate Tax Provisions in the 2017 Tax Act Permanent, by ECI Percentiles, 2026,” https://www.taxpolicycenter.org/model-estimates/make-individual-income-tax-and-estate-tax-provisions-2017-tax-act-permanent-1.

[33] Ibid.

[34] CBO, “The Budget and Economic Outlook: 2018 to 2028,” April 9, 2018, https://www.cbo.gov/publication/53651.

[35] Chuck Marr and Samantha Jacoby, “President Biden’s Budget Charts a Needed Course Correction as 2025 Tax Debate Begins,” CBPP, March 29, 2023, https://www.cbpp.org/research/federal-tax/president-bidens-budget-charts-a-needed-course-correction-as-2025-tax-debate. See CBO, Budget and Economic Data, https://www.cbo.gov/data/budget-economic-data.

[36] CBO, Budget and Economic Data, op. cit.; Chuck Marr and Samantha Jacoby, “Corporate Lobby’s New Math Doesn’t Add Up for Kids,” CBPP, December 8, 2022, https://www.cbpp.org/research/federal-tax/corporate-lobbys-new-math-doesnt-add-up-for-kids.

[37] Patrick J. Kennedy et al., op. cit.; William Gale and Claire Haldeman, “Searching for supply-side effects of the Tax Cuts and Jobs Act,” Brookings Institution, July 6, 2021, https://www.brookings.edu/research/searching-for-supply-side-effects-of-the-tax-cuts-and-jobs-act/.

[38] OECD, “Statement on a Two-Pillar Solution to Address the Tax Challenges Arising from the Digitalisation of the Economy,” October 8, 2021, https://www.oecd.org/tax/beps/statement-on-a-two-pillar-solution-to-address-the-tax-challenges-arising-from-the-digitalisation-of-the-economy-october-2021.htm. See also Samantha Jacoby, “International Tax Reform Proposals Would Limit Overseas Profit Shifting, End ‘Race to the Bottom,’” CBPP, July 11, 2022, https://www.cbpp.org/research/federal-tax/international-tax-reform-proposals-would-limit-overseas-profit-shifting-end.

[39] See Kimberly A. Clausing, Testimony Before the U.S. Senate Committee on the Budget, April 18, 2023, https://www.budget.senate.gov/imo/media/doc/Dr.%20Kimberly%20A.%20Clausing%20-%20Testimony%20-%20Senate%20Budget%20Committee.pdf.

[40] Ludvig Wier and Gabriel Zucman, “New global estimates on profits in tax havens suggest the tax loss continues to rise,” Centre for Economic Policy Research, December 4, 2022, https://cepr.org/voxeu/columns/new-global-estimates-profits-tax-havens-suggest-tax-loss-continues-rise.

[41] Thomas Tørsløv, Ludvig Wier, and Gabriel Zucman, “The Missing Profits of Nations,” August 10, 2021, https://gabriel-zucman.eu/files/TWZ2021.pdf.

[42] Rebecca Kysar, “US must follow Europe’s lead on global minimum tax — or be left behind,” Financial Times, December 19, 2022, https://www.ft.com/content/0e13dbd3-70e6-4733-b546-a50cd9454f8d.

[43] Andrew Barr, Jonathan Eggleston, and Alexander A. Smith, “Investing in Infants: the Lasting Effects of Cash Transfers to New Families,” Quarterly Journal of Economics, April 20, 2022, https://doi.org/10.1093/qje/qjac023

[44] According to IRS tax return data, in 2020 the average tax rate for households in the top 0.001 percent of income was 23.73 percent, 2 percentage points lower than the effective tax rate for the top 1 percent as a whole. TPC, “Effective Tax Rate by AGI,” May 8, 2023, https://www.taxpolicycenter.org/statistics/effective-tax-rate-agi. These amounts only include taxable income and therefore exclude unrealized capital gains, which are highly concentrated at the very top of the income distribution. If unrealized gains are included in total income, effective tax rates for the wealthy would be much lower. See Greg Leiserson and Danny Yagan, “What Is the Average Federal Individual Income Tax Rate on the Wealthiest Americans?” September 23, 2021, https://www.whitehouse.gov/cea/written-materials/2021/09/23/what-is-the-average-federal-individual-income-tax-rate-on-the-wealthiest-americans/.

[45] See Samantha Jacoby, “Biden Proposal Would Eliminate Tax-Free Treatment for Much of Wealthiest Households’ Annual Income,” CBPP, May 6, 2022, https://www.cbpp.org/blog/biden-proposal-would-eliminate-tax-free-treatment-for-much-of-wealthiest-households-annual; Jason Furman, “Biden’s Better Plan to Tax the Rich,” Wall Street Journal, March 28, 2022, https://www.wsj.com/articles/bidens-better-plan-to-tax-the-rich-unrealized-capital-gains-assets-treasury-distortion-11648497984?mod=hp_opin_pos_5.

[46] Income and wealth have grown increasingly concentrated at the top of the income distribution in recent decades. See box, “Income, Wealth Are Highly Concentrated and Growing More So,” in Chuck Marr, Samantha Jacoby, and Kathleen Bryant, “Substantial Income of Wealthy Households Escapes Annual Taxation or Enjoys Special Tax Breaks,” CBPP, November 13, 2019, https://www.cbpp.org/research/federal-tax/substantial-income-of-wealthy-households-escapes-annual-taxation-or-enjoys.

[47] Karen C. Burke, “Exploiting the Medicare Tax Loophole,” Florida Tax Review, May 16, 2018, https://journals.upress.ufl.edu/ftr/article/view/639.

[48] For discussions of proposals to tax carried interest as ordinary income, see Steven M. Rosenthal, “Taxing Private Equity Funds as Corporate ‘Developers,’” Tax Notes, January 21, 2013, https://www.taxpolicycenter.org/publications/taxing-private-equity-funds-corporate-developers/full; Victor Fleischer, “Two and Twenty Revisited: Taxing Carried Interest as Ordinary Income Through Executive Action Instead of Legislation,” September 18, 2015, https://papers.ssrn.com/sol3/papers.cfm?abstract_id=2661623.

[49] Chuck Marr, “Real Estate Tax Breaks, Low-Income Rent Hikes Reflect Skewed Priorities,” CBPP, May 7, 2018, https://www.cbpp.org/blog/real-estate-tax-breaks-low-income-rent-hikes-reflect-skewed-priorities.

[50] For example, leading tax scholar Joel Slemrod has noted that “there is no evidence that links aggregate economic performance to capital gains tax rates.” Joel Slemrod, “The Truth About Taxes and Economic Growth,” Challenge, Vol. 46, No. 1, January/February 2003, pp. 5-14, https://www.jstor.org/stable/40722179?seq=1. A Congressional Research Service report finds that cuts in the top capital gains rates since 1945 “have had little association with saving, investment, or productivity growth.” Thomas L. Hungerford, “Taxes and the Economy: Analysis of the Top Tax Rates Since 1945,” Congressional Research Service, December 2012, https://sgp.fas.org/crs/misc/R42729.pdf.