

SNAP Provides Needed Food Assistance to Millions of People with Disabilities
Millions of Americans live with disabilities. Having a disability can raise expenses and make it harder for people with disabilities and their caregivers to work, put food on the table, and afford adequate health care. While programs like Supplemental Security Income (SSI), Social Security Disability Insurance (SSDI), Medicaid, and Medicare provide critical support to many of those with disabilities, the importance of the Supplemental Nutrition Assistance Program’s (SNAP) nutrition benefits for the economic well-being and food security of low-income people with disabilities is less recognized.
SNAP provides millions of people with a broad range of functional impairments and limitations with billions of dollars in benefits annually. Our examination of the intersection of SNAP and disability in the United States shows that:
- Disability affects millions of Americans of all ages. While there is no single definition of disability, between 40 and 57 million Americans — children, working-age adults, and seniors — are estimated to have an impairment or work limitation. For some, disability is a short-term or episodic impairment; for others, it is long-lasting.
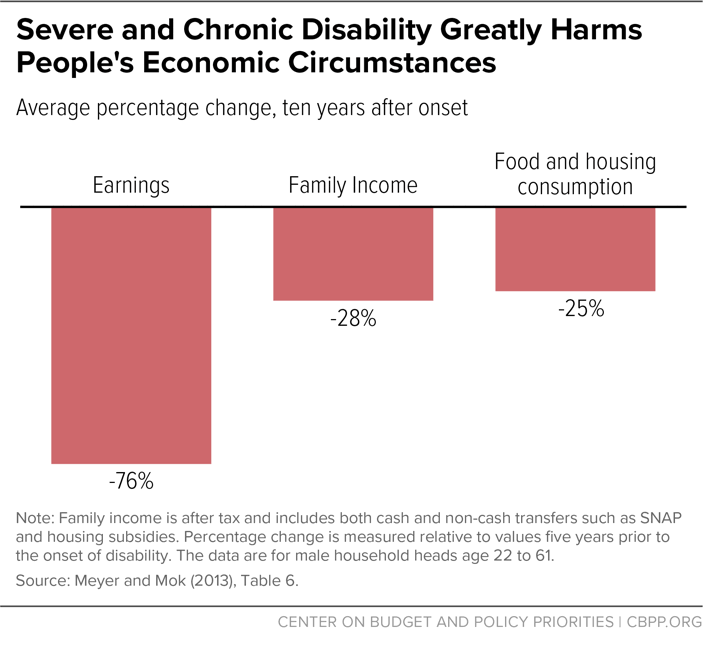
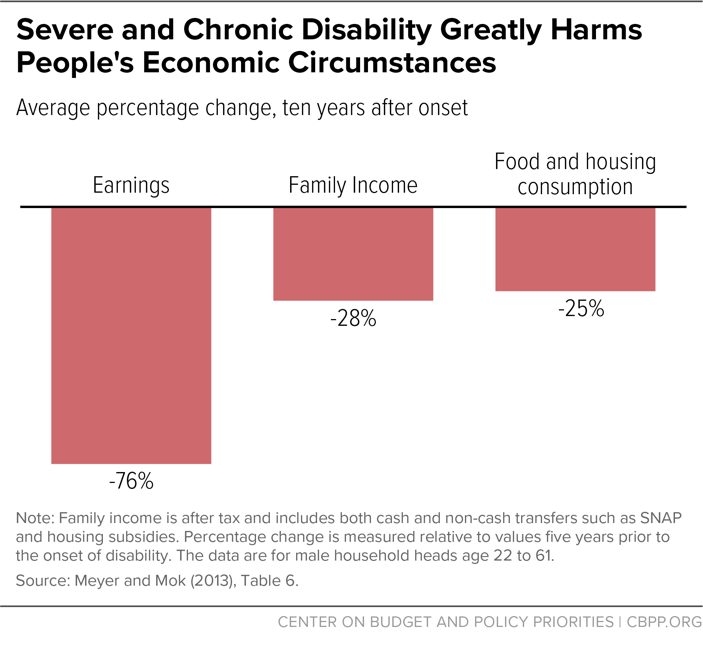
- Disability can have serious economic consequences. For example, one study estimates that by the tenth year after onset of a chronic and severe disability, average earnings fall by 76 percent, family income falls by 28 percent, and food and housing consumption falls by 25 percent.
- People with disabilities are more likely to live in poverty, endure material hardships, and experience food insecurity. Lower family income, higher disability-related expenses, and the challenges of providing needed assistance and care to disabled family members undermine the economic well-being of people with disabilities and their families. People with disabilities are at least twice as likely to live in poverty and struggle to put enough food on the table as people without disabilities. Disabling or chronic health conditions may be made worse by insufficient food or a low-quality diet.
- SNAP provides needed food assistance to millions of people with disabilities. Over 1 in 4 SNAP participants, equivalent to over 11 million individuals in 2015, have a functional or work limitation or receives federal government disability benefits, according to CBPP analysis of data from the 2015 National Health Interview Survey (NHIS).
- SNAP helps people who may not qualify for disability benefits or who have not yet completed the often lengthy process to obtain disability benefits. SNAP assists many people with disabilities that limit work or daily life activities but who are not considered disabled under SNAP rules. This is because SNAP identifies individuals as having a disability based heavily on their receipt of government disability payments (such as SSI and SSDI), which in turn generally limit payments to people who experience some of the most severe and more long-lasting impairments. Many individuals have disabilities that are more temporary or episodic, or otherwise do not meet the strict disability benefit standards; many others have not yet successfully completed the lengthy application, approval, and appeal process for government disability benefits. CBPP estimates based on survey data show that about 28 percent of non-elderly adult SNAP participants have disabilities, and of those, more than two-fifths do not receive SSI or SSDI benefits. This suggests that SNAP serves significantly more adults with disabilities than are recognized as disabled under current SNAP rules.
- Recognizing the additional expenses and challenges many people with disabilities face, SNAP program rules give them consideration when determining eligibility and benefits. These accommodations can boost benefits and help individuals with disabilities with higher expenses qualify for SNAP, but they do not apply to individuals with disabilities who are not receiving disability benefits such as SSI or SSDI. Thus, these individuals could be vulnerable to future eligibility restrictions or benefit cuts in SNAP, even if those changes exempt people who meet the program’s strict disability definition.
- Research shows that SNAP works. While more research is needed to demonstrate SNAP’s specific effectiveness in improving the well-being of people with disabilities, an extensive body of evidence demonstrates that SNAP lifts millions of people out of poverty, helps families put food on the table, and can improve long-term health and economic outcomes.
- SNAP can be strengthened to ensure that people with disabilities fully benefit from existing accommodations and extend these accommodations to people who have impairments but whom SNAP does not recognize as disabled. States can ensure that individuals with disabilities receive full accommodations in the application process and are aware of and take full advantage of rules to benefit them, such as the medical expense deduction, which can enable them to qualify for larger benefits.
Disability in the United States
Estimating the number and describing the characteristics of people with disabilities in the United States is difficult because individuals face a broad range of physical, mental, and sensory impairments, and the definition of disability depends on the context for which it is defined. In general, disability refers to a physical, mental, or emotional condition that limits participation in the usual roles and activities of everyday life. As the World Health Organization notes:
The disability experience resulting from the interaction of health conditions, personal factors, and environmental factors varies greatly. Persons with disabilities are diverse and heterogeneous, while stereotypical views of disability emphasize wheelchair users and a few other “classic” groups such as blind people and deaf people. Disability encompasses the child born with a congenital condition such as cerebral palsy or the young soldier who loses his leg to a land-mine, or the middle-aged woman with severe arthritis, or the older person with dementia, among many others. Health conditions can be visible or invisible; temporary or long term; static, episodic, or degenerating; painful or inconsequential.[2]
While the concept of disability encompasses a range of diverse conditions, the definition used for programmatic and policy contexts is often narrower. The set of laws that establishes standards for accommodations and prevents discrimination in the workplace, public and commercial spaces, and government programs, such as the Americans with Disabilities Act (ADA), has specific standards used to determine disability. The ADA, modified by the ADA Amendments Act of 2008, defines disability as “a physical or mental impairment which substantially limits one or more major life activities” compared to the general population. ADA protections apply even if this impairment is episodic, can be ameliorated through adaptive equipment (except for eyeglasses), or limits one activity but not others.[3]
Most federal programs that provide individuals with disabilities with benefits — such as SSI and SSDI — define disability even more narrowly, generally providing benefits only for individuals with severe and long-lasting impairments that prevent them from engaging in substantial work (see box). It is not uncommon for an individual to be considered to have a disability under one set of criteria but not under another.
Because of the varying definition of disability, data sources produce varying estimates of the number of people with disabilities (see Appendix B). In recent years, the federal government has made a concerted effort to adopt a consistent set of survey questions that capture a broad range of difficulties with hearing, vision, cognition, mobility, self-care, and independent living. Some surveys augment the standard questions with more detailed measures of work limitations, health status, and disability. With these survey data, it is possible to paint a broad picture of disability and its consequences in the United States. This section uses the 2015 NHIS to identify individuals with a disability, defined as individuals who have a physical or mental limitation, a work-limiting disability, or, among the non-elderly, who receive SSI or SSDI.[4]
Disability Affects Millions of Americans of All Ages
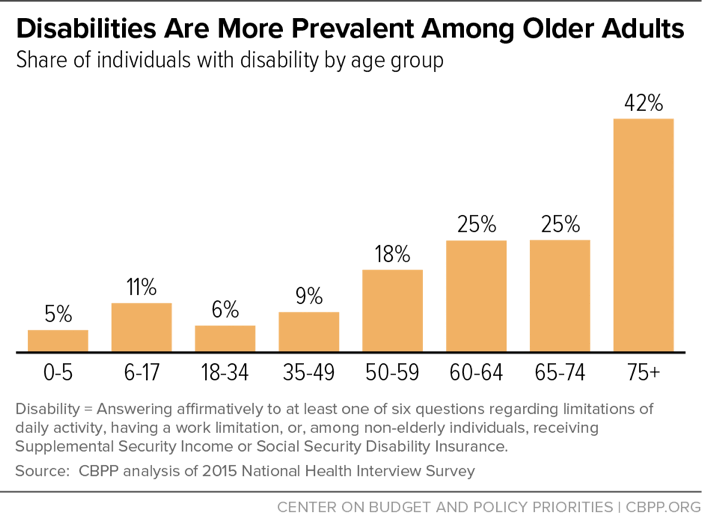
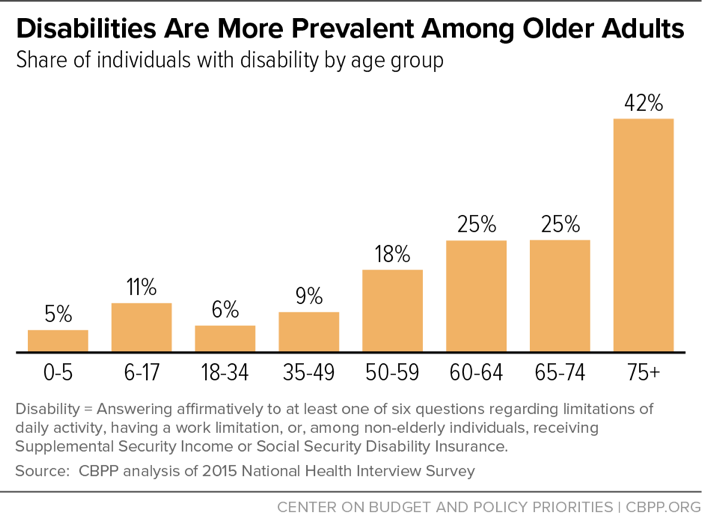
Between 40 million and 57 million (and potentially more) people living in the United States are estimated to have some disability.[5] While disabilities are up to eight times more prevalent among those over age 75 than among young children (see Figure 1), disability can strike at any age. Actuaries at the Social Security Administration, for example, estimate that a young adult entering the work force has a 1 in 4 chance of developing a severe disability before age 65.[6] While most people with disabilities are either working-age adults (41 percent) or seniors over age 60 (44 percent), close to 7 million (15 percent) are children.[7]
Disability Can Have Serious Economic Consequences
Developing a disability can lead to reductions in earnings, total family income, and purchases of essentials like food and housing, especially among those with the most severe disabilities. Researchers associated with the National Bureau of Economic Research estimate that a person with a chronic and severe disability will, on average, experience a 76 percent drop in earnings, a 28 percent decline in family income, and a 25 percent reduction in food and housing consumption ten years after onset (see Figure 2).[8]
Disability can also affect the income and well-being of family caregivers of individuals with disabilities. Family members may have to reduce work hours or stop working altogether to provide necessary care and assistance, making it difficult to pay for health care, adaptive equipment, and other disability-related expenses. They also may invest significant amounts of time and energy, and perform tasks that are physically, socially, or financially demanding. For some, “[c]aregiving exacts a tremendous toll on caregivers’ health and well-being, and accounts for significant costs to families and society as well. Family caregiving has been associated with increased levels of depression and anxiety as well as higher use of psychoactive medications, poorer self-reported physical health, compromised immune function, and increased mortality.”[9]
Many People With Disabilities Live in Poverty and Endure Material Hardships
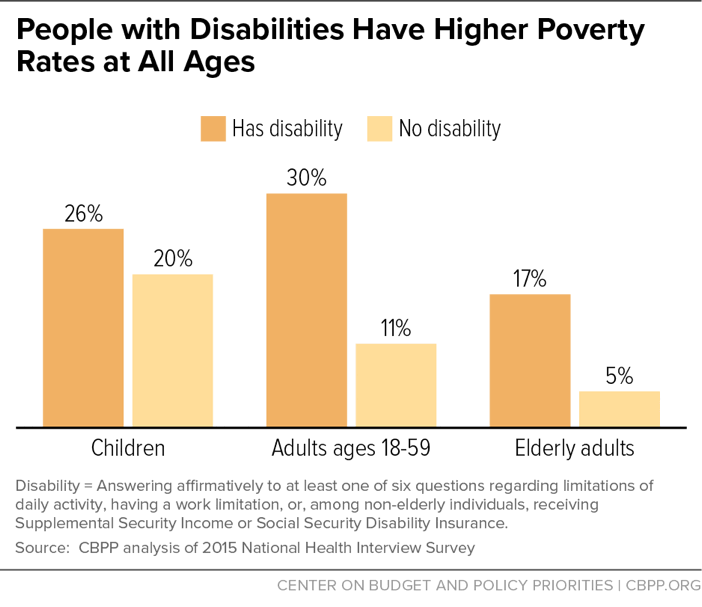
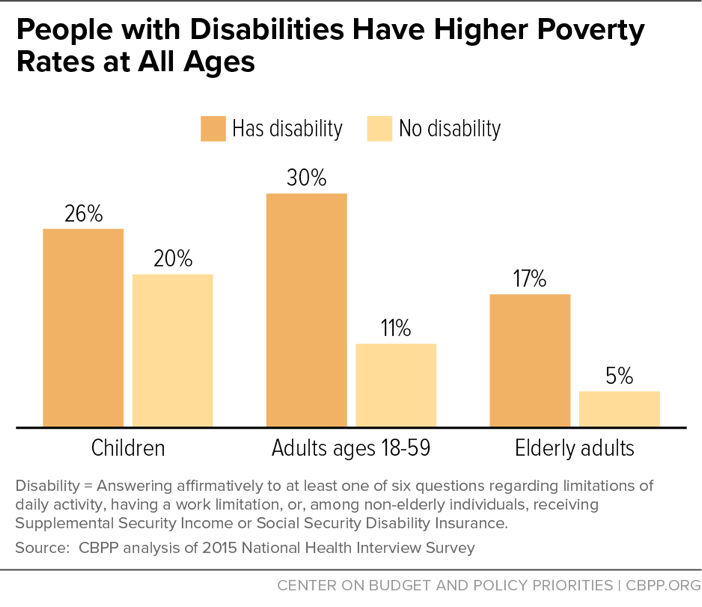
Using the official poverty measure, the poverty rate among non-elderly adults with disabilities (30 percent) is more than twice that among non-elderly people without disabilities (11 percent) (see Figure 3).[10] While many researchers and analysts have pointed to limitations in the official poverty measure and offered alternative measures, the pattern of higher poverty rates among those with disabilities holds regardless of the measure used.[11]
Poverty measures based on income alone, however, substantially overstate the economic well-being of people with disabilities. Other measures of consumption and physical living conditions suggest that many more families cannot meet certain basic needs. At least 40 percent of people with disabilities experience a material hardship such as low-quality housing, difficulty paying bills, unmet need for health care, or inadequate food.[12] People with disabilities may require two to more than three times as much income as an able-bodied person to have the same ability to meet their expenses, get needed medical care, and avoid food insecurity.[13]
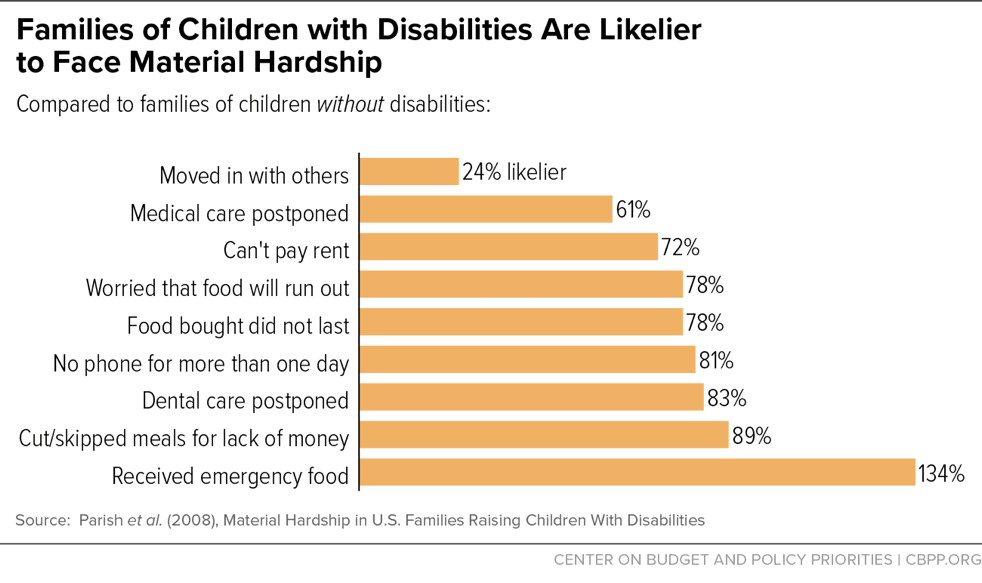
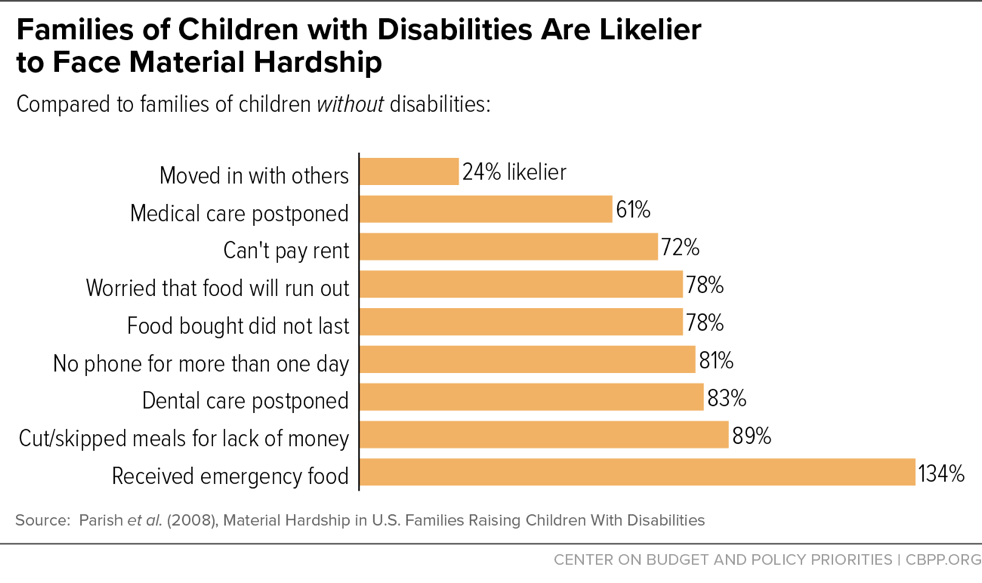
Families raising children with disabilities are especially susceptible to hardships. Families with disabled children are at least 50 percent more likely to postpone needed medical or dental care, miss rent payments or lose telephone service, run out of food, or seek emergency food assistance than families without disabled children (see Figure 4).[14]
Many People With Disabilities Struggle to Put Enough Food on the Table
Disability has emerged as one of the strongest known factors affecting a household’s food security. Current research suggests that disability increases the risk of food insecurity by reducing household income and increasing household costs. Disability can reduce household income by limiting the educational attainment and earnings potential of people with disabilities, narrowing the range of jobs available to them, restricting their hours worked, and reducing the work effort of family caregivers. Disability can increase household expenses for accessible housing and transportation, personal assistance services, assistive technology, and health care not covered by private insurance, Medicaid, or Medicare. Lower household income and higher out-of-pocket expenses are strongly associated with increased food insecurity.[15]
As a result of these factors, households that include people with disabilities are disproportionately likely to struggle to get enough food to sustain an active, healthy life: in 2009-10, while about 16 percent of households with working-age adults had a member with a disability, 33 percent of all food insecure households, and 38 percent of households with very low food security, included a working-age adult with a disability.[16]
Disability in Household Substantially Increases Risk of Food Insecurity Across Life Cycle
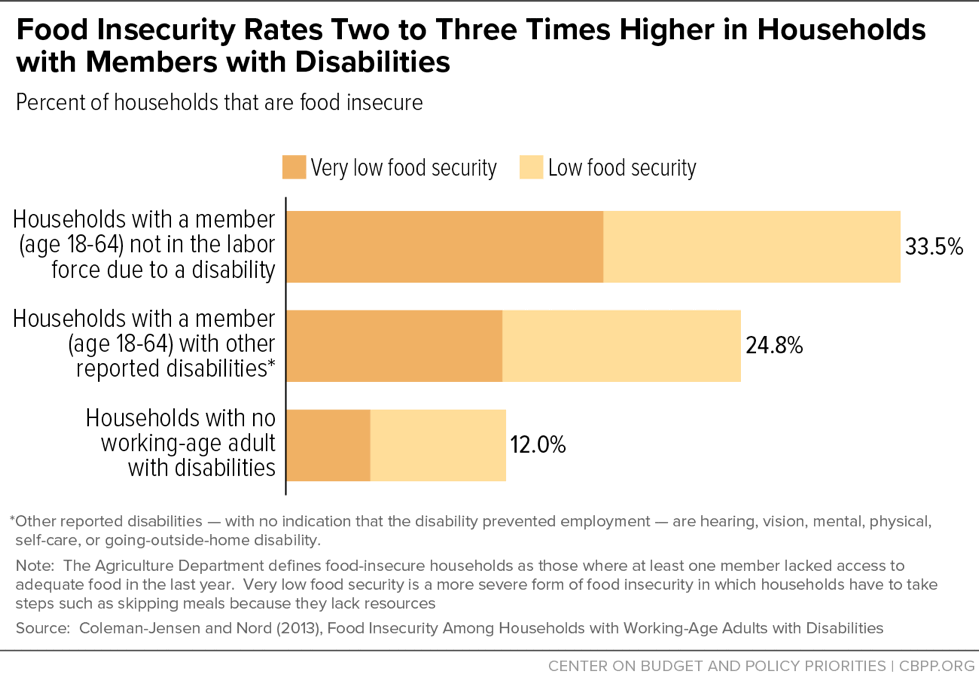
Children living with a disabled adult are almost three times as likely to experience very low food security as other children.[17] Food insecurity rates are about two to three times higher among households with members with disabilities than households without any disabled adults (see Figure 5).[18] And seniors who have difficulty with basic tasks of daily life are twice as likely to have difficulty getting enough food as those who don’t.[19] These results are consistent across analyses using different data sets, definitions of disability, and analytic methods.
Food insecurity, besides being more likely in households affected by disabilities, may also be more problematic for them. Research shows that food insecurity has negative effects on health and diet quality, and these effects may be greater for people with disabilities.[20] Children with special needs often require special diets, for example. This raises their food costs and makes them more vulnerable than other children to the harmful effects of food insecurity. Disabling or chronic health conditions may be made worse by insufficient food or a low-quality diet.
Households with Disabled Members Have Fewer Assets So Are Less Protected From Food Insecurity
Assets provide stability and offer a cushion in difficult times. Some research shows that households with disabilities with more assets are less likely to experience food insecurity, and that the connection between household assets and food insecurity for these households may be stronger than the connection between income and food insecurity.[21] Liquid assets can help protect people with a disability by providing a means to pay for disability-related expenses. However, households affected by disabilities have fewer assets to rely on than other households.[22]
Recently authorized Achieving a Better Life Experience (ABLE) accounts offer tax-advantaged savings accounts for individuals with disabilities and their families that will not affect their eligibility for SSI, Medicaid, and other public benefits, including SNAP. As discussed below, SNAP has a higher asset limit for families identified as having members with disabilities than for other families. Also, many states take advantage of a state option called broad-based categorical eligibility to raise or eliminate the asset test for some or all households that participate.
SNAP Is the Nation’s Most Important Anti-Hunger Program
Federal, state, and local safety-net programs provide income, health care, and other support for millions of Americans with disabilities and their families (see Appendix C). SSI, SSDI, and veterans’ disability compensation help meet basic needs. Medicaid and Medicare provide access to needed health care services, and Medicaid’s support for home- and community-based care helps individuals with disabilities live independently.[23] Other programs offer vocational rehabilitation and employment-related services to help people with disabilities be independent, self-directed, and self-sufficient.
Amidst this array stands SNAP, the primary source of nutrition assistance for many low-income people, including those with disabilities. In 2016, SNAP helped more than 44 million low-income Americans afford a nutritionally adequate diet in a typical month. It is an important nutritional support for low-wage working families, low-income seniors, and people with disabilities living on fixed incomes. Close to 70 percent of SNAP participants are in families with children; more than one-quarter are in households with seniors or people with disabilities (defined narrowly, as explained below).
SNAP is broadly available to almost all households with low incomes and few resources.[24] This is unlike most means-tested benefit programs, which are restricted to particular categories of low-income individuals, and unlike many disability assistance programs, which are often restricted to people with the most severe disabilities (though they may also have income or other requirements). SNAP eligibility rules and benefit levels are, for the most part, uniform across the nation. Under federal rules, a household must meet three criteria to qualify for SNAP benefits (although states have flexibility to adjust these limits):
- Its gross monthly income generally must be at or below 130 percent of the poverty line, or $2,184 (about $26,200 a year) for a three-person family in fiscal year 2017. Households with an elderly or disabled member need not meet this limit.
- Its net monthly income, or income after deductions are applied for items such as high housing costs and child care, must be less than or equal to the poverty line (about $20,160 a year or $1,680 a month for a three-person family in fiscal year 2017).
- Its assets must fall below certain limits: in fiscal year 2017 the limits are $2,250 for households without an elderly or disabled member and $3,250 for those with an elderly or disabled member.
SNAP targets its benefits according to need: households with less income receive larger benefits than households with more income since they need more help to afford an adequate diet. The benefit formula assumes that families will spend 30 percent of their net income for food; SNAP makes up the difference between that 30 percent contribution and the cost of a low-cost but nutritionally adequate diet.[25]
SNAP gives consideration to households with members who receive government assistance related to a disability (see Appendix D). Three of the more important provisions, which also apply to households with elderly individuals, are described below.
First, as noted above, households that include a person with a disability need not meet the gross income test (though they must meet the net income test) and have a higher limit on allowable assets. These provisions recognize that such households often face disability-related expenses that compromise their ability to afford a nutritious diet. More than 40 states have also taken advantage of an option to raise the gross income test and/or raise or eliminate the asset test for some or all eligible households. This helps low-income households with high expenses and modest savings (but disposable income generally below the poverty line), including many households with members with disabilities.[26]
Second, households with members who have a disability may deduct unreimbursed medical expenses over $35 per month from their net income in determining SNAP eligibility and benefits to more realistically reflect their available income to purchase food. Claiming this deduction qualifies these households for higher SNAP benefits. A wide range of medical and related expenses may be deducted, including many that health insurance does not cover, such as transportation costs to a doctor or pharmacy, over-the-counter drugs, medical supplies, and home renovations to increase accessibility. While a relatively small share of households with disabled members claim this deduction, it can have a significant impact on benefits: about 9 percent of households with non-elderly members with disabilities claimed this deduction in 2015, increasing their SNAP benefits by an average of $37 a month or 37 percent.
Third, most households may deduct any shelter costs exceeding half of their income after other deductions. As with the medical deduction, the higher deduction reduces their net income and increases their SNAP benefit. For most households, program rules limit (or cap) the shelter deduction. Households with an elderly or disabled member, however, do not face this cap and may deduct the full cost of their shelter costs above half their income. About 28 percent of households with non-elderly members with disabilities claimed a shelter deduction above the shelter cap in 2015, raising their SNAP benefits by an average of $39 a month or 17 percent.
SNAP Provides Important Nutrition Benefits to People with Disabilities
A growing body of evidence shows that SNAP lifts millions of people out of poverty, reduces the depth and severity of poverty for millions more, alleviates food insecurity, and improves long-term health and economic outcomes. As the primary source of nutrition assistance for those with low income and few resources, SNAP plays an important role in the safety net for people with disabilities.
SNAP assists millions of low-income people with disabilities. About 26 percent of SNAP participants, or over 11 million people of all ages, had a disability in 2015, defined as a physical or mental limitation, a disability that limits work, or, among the non-elderly, receipt of SSI or SSDI.[27] In general, people with disabilities who are eligible for SNAP are more likely to participate than eligible people without disabilities, and SNAP participants are more likely to be disabled than people in the general population.[28] In addition, because disabilities are often long-lasting or permanent, households with non-elderly adults with disabilities tend to stay on SNAP longer than those without. Half of non-elderly disabled adults will leave the program within 19 months after entering, for example, compared to 12 months for an average participant.[29]
SNAP assists many other low-income people who have disabilities but are not considered disabled under SNAP rules. Only individuals with the most severe, long-lasting impairments are considered disabled in SNAP. SNAP’s definition of disability, which is used for the program rules that can expand eligibility and benefits for individuals with disabilities in recognition of their higher costs, relies heavily on the receipt of other government disability payments, primarily SSI and SSDI. The Social Security Act requires applicants for SSI and SSDI to show that their impairment: (1) will last at least 12 months or result in death, and (2) makes it impossible to engage in any substantial work, regardless of whether that work exists in their community or whether they would be hired. (See box.)
SNAP rules consider individuals receiving veterans’ disability compensation as disabled only if the Department of Veterans Affairs (VA) rates or pays the disability as total.[30] The majority of veterans receiving disability benefits have impairments that have been found to limit work and other daily activities, but are not considered total. [31]
Many other people with disabilities who have not yet successfully completed the lengthy and arduous process to receive government disability benefits would not qualify as disabled in SNAP, even if their disabilities were severe. While the average processing time for an initial SSI or SSDI disability claim is roughly three to four months, denied applicants who appeal must typically wait at least another year before an administrative law judge decides their case. Due in part to budget cuts, the backlog of cases waiting for an appeal hearing grew to over 1 million individuals in December 2016.[32] Similarly, the average time to complete a disability rating claim for veterans’ disability benefits in July 2016 was about four months (down from about nine months in 2012, when the agency was experiencing a significant backlog), while appeals take much longer: the average processing time among all appeals completed in 2015 was about three years.[33]
Also, a substantial number of SNAP participants have disabilities severe enough to limit work or activities of daily life but not severe enough to qualify for SSI or SSDI. Our analysis of NHIS data suggests that about 28 percent of adults ages 18 to 59 who received SNAP in the last year had at least one physical, functional, or work limitation or received SSI or SSDI. Some 42 percent of that group did not receive SSI or SSDI, meaning they may not be identified as having a disability based on SNAP rules.[34] These findings suggest that a significant number of individuals with impairments may not be disabled under SNAP rules.
Low-income people with disabilities that do not meet the program’s strict definition of disability do not benefit from SNAP provisions for people with disabilities, such as the medical deduction or the removal of the cap on the excess shelter deduction. Moreover, if a policy change to the program were to restrict eligibility or benefits for those considered non-disabled in SNAP, millions of low-income people who face physical, cognitive, and emotional impairments that limit their ability to participate in ordinary activities of daily life — including work — would be vulnerable to those changes, even if those who meet the program’s strict definition were protected.
SNAP Serves Diverse Group of Low-Income People with Disabilities
This section looks at the characteristics of SNAP participants identified as disabled using SNAP administrative data, which find that about 5.2 million non-elderly participants, or about 12 percent of all participants (and 13 percent of non-elderly participants), had a disability in 2015.
These figures are less than half the number and share of individuals receiving SNAP with a disability in the NHIS data used earlier in this paper, who represent individuals of all ages (including elderly) identified as having an impairment or work limitation or, among the non-elderly, receiving SSI or SSDI. These figures also are significantly lower than the number and share of non-elderly individuals identified in the NHIS data as having a disability: the NHIS data show 8.1 million non-elderly SNAP participants with disabilities, constituting about 22 percent of non-elderly SNAP participants. See Table 1 for a comparison of these estimates by age.
There are two major reasons why these figures differ so substantially. First, the SNAP administrative data use a narrower definition of disability to simulate disability as defined under SNAP rules, largely based on receipt of SSI and other government benefits. In contrast, the NHIS data capture the broader group with an impairment, many of whom may not qualify for or receive government benefits such as SSI and therefore would not be considered disabled under SNAP rules.
Second, the SNAP administrative data undercount the number of individuals who do meet the relatively narrow criteria to be considered disabled under SNAP rules. For example, these data cannot identify individuals over age 60 with disabilities, who make up about 28 percent of the individuals participating in SNAP and identified as having a disability in NHIS data. And, for individuals of all ages, the SNAP administrative data are less effective at identifying individuals who get disability benefits other than SSI that would qualify them as disabled under SNAP rules.
Finally, these two datasets are not perfectly comparable with regards to SNAP participants, as the SNAP administrative data are based on a sample of participants each month, and NHIS may imperfectly capture the number of SNAP participants in an average month.
| TABLE 1 | ||||||
|---|---|---|---|---|---|---|
Comparison of Disability Among SNAP Participants in SNAP Administrative Data and National Health Interview Survey Data | ||||||
| SNAP Quality Control Data, 2015 | National Health Interview Survey Data, 2015 | |||||
| Total Individuals Receiving SNAP (000s) | 45,184 | 42,587 | ||||
| Total Individuals Receiving SNAP with Disabilities (000s) | 5,283 | 11,113 | ||||
| Share of Individuals Receiving SNAP with Disabilities | 12% | 26% | ||||
| Total Individuals Ages 0-59 Receiving SNAP (000s) | 40,385 | 37,372 | ||||
| Total Individuals Ages 0-59 Receiving SNAP with Disabilities (000s) | 5,283 | 8,052 | ||||
| Share of Individuals Ages 0-59 Receiving SNAP with Disabilities | 13% | 22% | ||||
| Children Under 18 Receiving SNAP (000s) | 19,891 | 16,005 | ||||
| Children Under 18 Receiving SNAP with Disabilities (000s) | 971 | 2,080 | ||||
| Share of Children Receiving SNAP with Disabilities | 5% | 13% | ||||
| Adults Ages 18-59 Receiving SNAP (000s) | 20,494 | 21,367 | ||||
| Adults Ages 18-59 Receiving SNAP with Disabilities (000s) | 4,311 | 5,972 | ||||
| Share of Adults Ages 18-59 Receiving SNAP with Disabilities | 21% | 28% | ||||
| Adults Ages 60 and up Receiving SNAP (000s) | 4,799 | 5,215 | ||||
| Adults Ages 60 and up Receiving SNAP with Disabilities (000s) | N/A | 3,081 | ||||
| Share of Adults Ages 60 and up Receiving SNAP with Disabilities | N/A | 59% | ||||
Notes: SNAP administrative data defines an individual with a disability as someone under age 60 who meets one of the following conditions: 1) received SSI; 2) worked fewer than 30 hours a week, was exempted from work registration due to disability, and received Social Security income, veterans’ disability income, or workers’ compensation; 3) was in a household receiving SNAP’s medical expense deduction but with no elderly members, and some indication of disability; or 4) is a single individual living alone receiving Social Security income. The definition used to identify individuals with a disability in the National Health Interview Survey (NHIS) was: 1) a positive response to any one of six questions about hearing, vision, cognitive, ambulatory, self-care, or independent living impairments; 2) report of a work-limiting disability; or 3) receipt of SSI or SSDI among non-elderly individuals. The SNAP administrative data are based on a sample of SNAP participants in a typical month. SNAP participation in NHIS is based on family receipt of SNAP in the last year, estimated as a monthly figure based on average number of months a family received SNAP. Source: CBPP Analysis of 2015 USDA Quality Control SNAP data and National Health Interview Survey data | ||||||
Though the SNAP administrative data only capture people with disabilities who receive government benefits and exclude anyone over age 60 with disabilities, they provide a snapshot of the characteristics and circumstances of non-elderly adults and children with the most severe and long-lasting disabilities while they participate in SNAP.
- SNAP participants with disabilities are a diverse group. Among those who report their race and ethnicity, about half (52 percent) are white, a third (34 percent) are African American, and 10 percent are Hispanic. SNAP participants with disabilities are somewhat more likely to be female (55 percent) than male (45 percent), and half live alone or with no other SNAP recipient (52 percent). Among adults who report their educational attainment, 86 percent have a high school diploma or less. A quarter of the non-elderly adults with a disability live in families with children, and nearly 20 percent of non-elderly SNAP participants with disabilities are themselves children. Appendix Table 1 has estimates of SNAP participants by state.
- SNAP participants with disabilities have little income and few resources. Monthly income of SNAP households with a non-elderly member with disabilities averaged just over $1,000 in 2015. Over 80 percent had gross incomes below the poverty line while participating in SNAP.
- SNAP benefits, though modest, can be important to them. In 2015, monthly SNAP benefits averaged $193 in households with disabled members. Although equivalent to only about $1.12 per person per meal, these modest benefits account for 16 percent of the total resources (cash income and SNAP) available to these low-income families in months when they are participating in SNAP.
Work can be an important part of living well for people with disabilities who receive SNAP, but many face profound barriers to work. For many, severe physical or mental impairments make earning a living very difficult, particularly without support from employers. Others, especially those with low incomes, face barriers such as lack of education, work experience, and training opportunities needed to compete in the job market; online job postings and application forms that are inaccessible to those with hearing, vision, or cognitive impairments; work places that are inaccessible to those with impaired mobility and inadequate transportation; and misconceptions, negative attitudes, and stereotypes that may undermine employers’ perception of and applicants’ confidence in their abilities.
It is not surprising that relatively few SNAP participants whom SNAP identifies as having a disability work while receiving benefits. As can be expected given the considerable barriers, adults with a disability work less often than those without a disability.[35] Other family members may have to reduce their hours or quit their jobs to provide needed assistance and care for those with a disability. Adults with disabilities and their families who apply for and receive SNAP are by definition low income, which may reflect barriers that limit the possibility or extent of work, or have high expenses that leave them with little disposable income. In addition, SNAP considers participants disabled only if they cannot support themselves through work, and specifically exempts people with disabilities from the program’s work requirements (although they may volunteer for employment and training services).
Even though individuals with disabilities receiving SNAP are less likely to be able to work, a significant number of them and their family members do work. USDA’s administrative data, which are limited to individuals who are receiving disability benefits and thus are less likely to work, find earnings present in about 1 in 10 households with a non-elderly disabled member while they are receiving SNAP.[36] CBPP analysis of 2015 NHIS data finds that about 1 in 5 non-elderly adult participants with a limitation who received SNAP worked in the previous year. Of non-elderly adult participants with a limitation who did not receive SSI or SSDI and thus may have less severe or long-lasting disabilities, over one-third worked.[37]
Research Shows That SNAP Works
While researchers have not investigated extensively how much SNAP improves the well-being of people with disabilities in particular, a large and growing body of evidence demonstrates that SNAP lifts millions of people out of poverty, helps families put food on the table, and can improve long-term health and economic outcomes. In providing millions of Americans with disabilities with money to purchase food and freeing up income for other necessities, SNAP likely has similarly powerful effects for these individuals.
- SNAP lifts millions of people out of poverty and extreme poverty. Poverty has many adverse consequences for an individual’s well-being, including increased food insecurity, poor health, and reduced earnings potential. SNAP kept about 8.4 million people out of poverty in 2014, including about 3.8 million children, and lifted more Americans (5.1 million) out of deep poverty — that is, above half the poverty line — than any other means-tested program.[38] Moreover, counting SNAP benefits as income cut the number of extremely poor households — those living on less than $2 per person a day — in 2011 by nearly half (from 1.6 million to 857,000).[39]
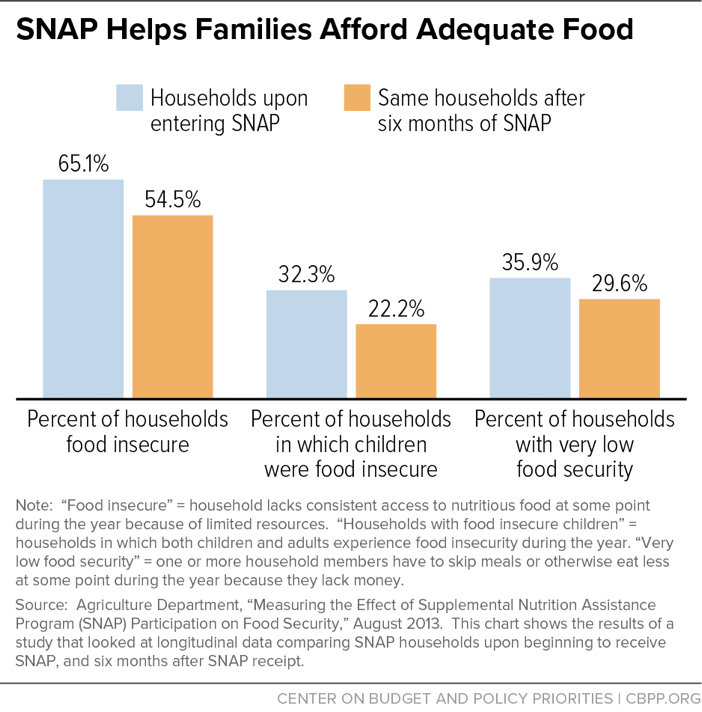
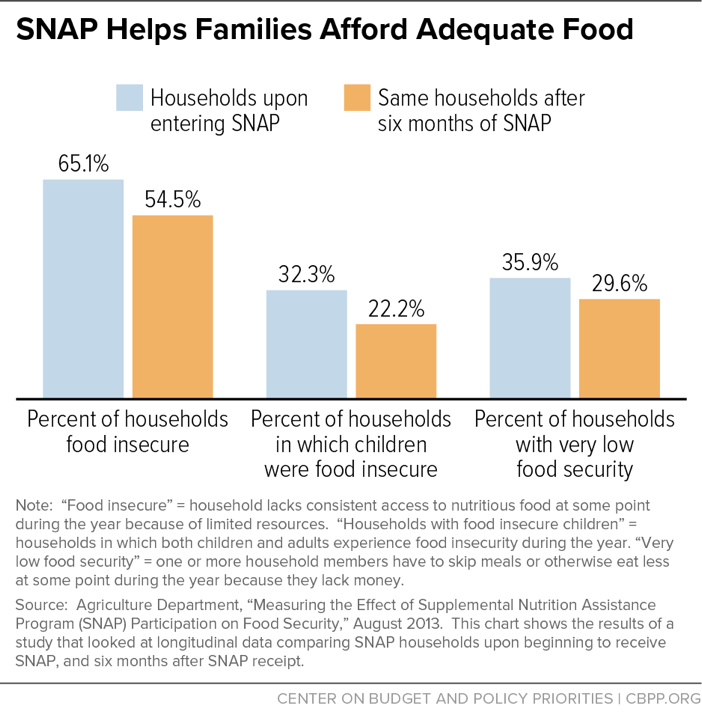
SNAP helps families put food on the table. SNAP improves low-income peoples’ health and well-being by helping them afford adequate, nutritious food. Because SNAP enables families to spend more on food than their limited budgets would otherwise allow, it helps ensure that they have enough to eat. Providing additional resources for food also frees up income that families can use to cover medical and other disability-related costs, pay rent and utilities, and purchase other necessities. Recent research demonstrates that SNAP participation leads to substantial reductions in food insecurity. The largest and most rigorous study found that food insecurity falls by 5 to 10 percentage points after families and individuals receive SNAP benefits for six months (see Figure 6).
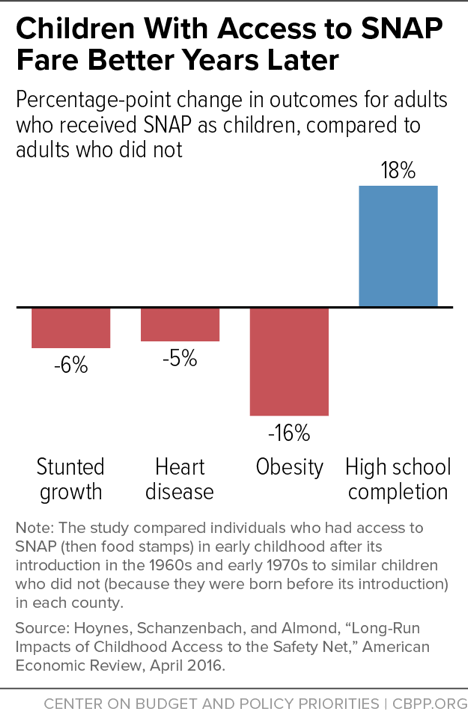
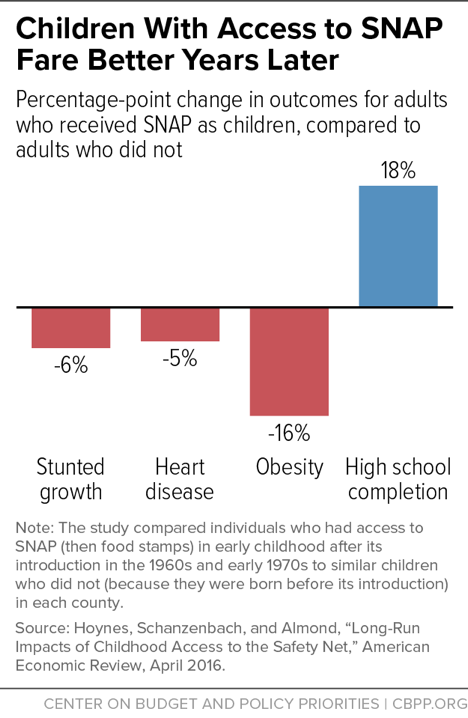
Figure 6 Early access to SNAP can improve long-term health and economic outcomes. Poor nutrition during childhood may harm health and earnings decades later by altering physical development and affecting the ability to learn. Researchers comparing the long-term outcomes of individuals in different areas of the country when SNAP expanded nationwide in the 1960s and early 1970s found that disadvantaged children who had access to food stamps in early childhood and whose mothers had access during their pregnancy had better health and economic outcomes as adults than children who didn’t have access to food stamps (see Figure 7).[40]
Figure 7

Opportunities to Strengthen SNAP’s Support of People with Disabilities
Millions of Americans of all ages have disabilities, which can have devastating economic consequences: people with disabilities are more likely to live in poverty, endure material hardships, and experience food insecurity than people without. SNAP serves millions of people with a broad range of functional impairments or limitations.
While SNAP likely has powerful effects in reducing poverty and food insecurity for people with disabilities — as it does for SNAP participants overall — there are opportunities to increase SNAP’s effectiveness at reaching and serving people with disabilities.
- The existing definition of disability for the purpose of determining SNAP eligibility and benefits excludes many people with severe and long-lasting disabilities. Those excluded range from veterans with service-related injuries that are rated at just under 100 percent to individuals who have not yet received an SSI/SSDI determination to children who are severely disabled but do not qualify for SSI due to their parents’ income or assets. These individuals also have trouble affording an adequate diet and may have increased expenses due to their impairments, and would benefit from the medical expense deduction and other provisions that benefit the disabled. Unfortunately, if an individual is not considered disabled as defined in SNAP regulations, the state agency cannot provide him or her with those accommodations.
SNAP’s existing rules are not used to their full potential. For example, while the medical expense deduction can help households with high medical costs obtain adequate benefits, it appears to be underutilized. There are various reasons why, ranging from confusion or lack of awareness among participants and caseworkers to state procedures and policies that can make claiming the deduction unnecessarily cumbersome.
Also, some state SNAP applications do not appear to seek sufficient information from applicants to ensure that eligible households receive the full deduction. As a result, only about 9 percent of the 4.6 million households with disabled members claimed the medical deduction in 2015, though the share of these households with eligible expenses is likely much higher.[41] Often overlooked expenses typically not covered by health insurance include public and private transportation to obtain medical treatment and services, over-the-counter drugs recommended by health care providers, medical supplies (such as bandages, batteries for hearing aids, and walkers), and home modifications (such as shower seats, grab bars, hospital beds, wheelchair ramps, or chair lifts). The medical expense deduction can have a significant impact on SNAP benefits. For those households with members with disabilities claiming the deduction, this deduction increases their benefits on average by 24 percent.
- States can ensure that administrative procedures are accessible to people with disabilities. State agencies are responsible for ensuring that all individuals with disabilities receive assistance in applying for the program and that procedures are accessible to people with disabilities. (States must provide reasonable accommodations to ensure they are accessible.) It is not clear that federal and state administrators have adequately emphasized these accommodations despite a legal imperative to do so.
- States may be incorrectly subjecting individuals with disabilities (more broadly defined than just disability benefit receipt) to work requirements. For example, while individuals without a disability or dependent children are subject to a three-month time limit on SNAP participation unless they are working or in a job program, individuals who are “unfit for work” are exempt from this rule. Similarly, individuals who are unfit for work are exempt from other work provisions, which can include sanctions for noncompliance. Evidence suggests that individuals who do in fact have limitations are not adequately screened for disability and identified as unable to work. For example, an assessment of individuals subject to the time limit in Franklin County, Ohio, found that about one-third had a significant impairment, despite being screened and considered able to work.[42]
- Because SNAP relies on the disability determinations of other government assistance programs, improving the efficiency of those programs’ application processes can enable more individuals to qualify for provisions in SNAP targeted to people with disabilities. Applicants for SSI, SSDI, or veterans’ disability compensation can expect to wait three of four months on average, and at least a year for an appeal in any of the programs (and sometimes much longer). These programs also have experienced significant backlogs; the Social Security Administration’s current backlog for appeals for disability benefits reached a record high in December 2016. Waiting months and even years for benefits causes financial and medical hardship while these individuals remain ineligible for SNAP’s provisions. Often these individuals cannot work, and many have families to support.
SNAP is the nation’s most important anti-hunger program for millions of low-income Americans. Because disability has such a profound impact on food security, it is important to ensure that it adequately meets the unique needs of people with disabilities. That could begin with more intensive oversight by the Food and Nutrition Service (FNS), which administers SNAP, to ensure that states properly identify individuals with disabilities and connect them with the services and program benefits available through SNAP. In addition, given that individuals with disabilities have a high probability of experiencing food insecurity, FNS would do well to undertake a research agenda designed to better understand this phenomenon and explore whether SNAP could be changed to respond to the needs of these vulnerable individuals.
Appendix A: Defining Disability for SNAP
SNAP considers a person as “disabled” if they receive one of the following forms of disability benefits:
- Supplement Security Income (SSI)
- Social Security disability or blindness benefits
- Disability-related Medicaid
- Disability retirement benefits from a government agency because of a long-lasting disability under section 221(i) of the Social Security Act
- Interim assistance pending receipt of SSI (cash assistance provided by state and local welfare agencies for individuals awaiting SSI eligibility determination)
- Disability-related state-funded General Assistance, if eligibility is based on criteria as stringent as SSI
- A state SSI supplement (regardless of whether the individual receives federal SSI)
- Public disability retirement pensions (if the individual has the kind of disability that Social Security considers long-lasting)
- Railroad Retirement disability payments
- Veterans’ disability benefits for service-connected disabilities or non-service-connected disabilities rated or paid as total
- Veterans’ disability benefits or disability benefits for the spouse of a veteran, if the Department of Veterans Affairs (VA) has determined that the veteran or spouse is permanently housebound or needs regular care
- Veterans’ benefits for surviving children of veterans whom the VA has determined can never support themselves
- Veterans’ pensions for surviving spouses and children of veterans, if the spouse or child has a disability that Social Security considers long-lasting
SNAP’s definition of disability, for purposes of receiving special consideration within the program, does not cover all individuals who may have disabilities. It excludes:
- Individuals with temporary disabilities who are unable to work but are not receiving disability-related benefits
- Individuals with disabilities who have not yet received an SSI/SSDI determination and are not receiving interim assistance
- Individuals with disabilities that are serious but not severe enough to be considered long-lasting or do not qualify for a disability determination, such as veterans receiving less than total disability compensation
- Children who do not qualify for SSI due to the income or assets of their parents yet are otherwise severely disabled in accordance with the SSI severity standard
To further complicate matters, SNAP uses a different definition of disability to determine who is subject to the time limits and work requirements imposed on able-bodied adults without dependents (ABAWDs). Rather than relying on programmatic definitions like those based on SSI rules, a person can be exempt from ABAWD requirements if they are medically certified as physically or mentally unfit for employment or pregnant.
SNAP’s reliance on the receipt of other disability payments eliminates the need for applicants to again prove they have a disability once another government office has already made that determination, reducing the burden on both applicants and caseworkers. It excludes, however, many people with disabilities that limit work but do not meet other programs’ strict medical criteria, including those with temporary or episodic impairments.
Appendix B: Measuring Disability in National Surveys
Measures of disability tend to vary across surveys, due to differences in definitions and methods. Many ongoing national surveys, including the American Community Survey (ACS), Current Population Survey (CPS), Survey of Income and Program Participation (SIPP), National Health Interview Survey (NHIS), and Behavioral Risk Factor Surveillance System (BRFSS), have adopted a set of six questions to identify functional and physical limitations associated with disability.
The analyses in this report uses data from two sources: the NHIS and SNAP household characteristics data from the Quality Control (QC) system, described below.
The annual NHIS collects data on the health of the civilian noninstitutionalized population in the United States. It collects data on a variety of health and disability indicators — many more than the six reported in the CPS or the ACS. However, it still asks about the six core questions found in other datasets, allowing us to compare incidence of disability across datasets.
For instance, NHIS either directly or indirectly asks: [43]
- Hearing: Does this individual report having a limitation related to difficulty with hearing?
- Vision: Does this individual report having a limitation related to difficulty with vision?
- Cognitive: Is this person limited in any way because of difficulty remembering or because they experience periods of confusion?
- Ambulatory: Does this person have difficulty walking without using special equipment?
- Self-care: Because of a physical, mental, or emotional problem, does this person need the help of other persons with personal care needs, such as eating, bathing, dressing, or getting around inside the home?
- Independent living: Because of a physical, mental, or emotional problem, does this person need the help of other persons in handling routine needs?
Some research suggests that these six questions do not adequately capture all those who receive SSI and SSDI disability benefits. It recommends augmenting this sequence with a question about work limitations, specifically whether anyone in the household has a health problem or disability that prevents them from working or limits the kind or amount of work they can do. [44]
In our analysis of 2015 NHIS data, we define a person with a disability as anyone who 1) answers affirmatively to having one of the six above limitations, 2) has a work-limiting disability, or 3) receives SSI or SSDI disability benefits if they are not elderly. Note that “elderly” for these two programs is different than the definition used in SNAP. In SNAP, the elderly are those over the age of 59, however individuals may receive SSDI, for instance, until age 66. (Some of the questions are adjusted to be age-appropriate for children. For instance, children are not asked if they have a work-limiting disability and children under age 3 are not asked if they have difficulty with personal care needs. They are instead asked more relevant questions, such as whether they are limited in playing, have Attention Deficit/Hyperactivity Disorder, or have asthma.)
We identified SNAP recipients as individuals in families that received SNAP at some point in the calendar year. To estimate average monthly participation in SNAP, we adjusted the number of participants using the average number of months a family received SNAP benefits during the year.
USDA’s estimates of the number of people with disabilities participating in SNAP are based on SNAP QC data and likely understate their number. The SNAP QC system measures the accuracy of state eligibility and benefit determinations based on a sample of cases in every state. This sample can be used to estimate participant characteristics in an average month.
The data collected in the QC review do not directly identify people with disabilities, so USDA uses a set of proxy indicators to approximate the number of households and people with disabilities participating in SNAP. The proxy indicators have changed slightly over time in methodology, but in 2015 (the most recent year available), they flag as disabled individuals under age 60 (1) with SSI income, (2) who worked less than 30 hours a week, were exempted from work registration due to disability, and received Social Security, veterans’ benefits, or workers’ compensation, (3) in a household with a medical expense deduction and no member 60 years old or older and some indication of disability such as work registration status, hours worked, or type of income received, or (4) in single-person households consisting of a non-elderly adult receiving Social Security. While similar indicators have been used to identify households with members with disabilities continuously, they are only used to identify individuals with disabilities (in addition to households) in some years (1998 through 2002 and 2007 through 2015).
These estimates likely undercount individuals who meet SNAP’s definition of having a disability. First, they exclude elderly individuals, who are more likely to have disabilities (though elderly individuals also receive the benefit of provisions for people with disabilities, which generally apply to both groups). Second, these estimates omit individuals with disabilities who do not receive SSI, the medical expense deduction, or meet the other criteria in the flags.
While the NHIS and the QC each have limitations with regards to identifying individuals participating in SNAP and people with disabilities, respectively, they are used in this report for different purposes. We used the NHIS to discuss all individuals with disabilities in general, and those receiving SNAP, as that dataset allows us to identify individuals based on reported impairments as a broader measure of disability. We used SNAP QC data to discuss the demographic and SNAP benefit information of people with disabilities receiving SNAP, as well as the people with disabilities receiving SNAP and SNAP benefits by state in Appendix Table 1. The QC data have more detailed and reliable information related to SNAP participation and benefits, despite their shortcomings in measuring disability. A comparison of the number of individuals receiving SNAP identified as having disabilities is in Appendix Table 1.
Appendix C: Major Safety-Net Programs Available to People with Disabilities
Millions of individuals with disabilities and their families benefit from a wide variety of public benefits for income, health care, and food and housing assistance. Some of these benefits target people with disabilities; others are available more broadly to some or all low-income households but may be especially important to people with disabilities.
Income Support
- Supplemental Security Income (SSI) provides income to meet the basic needs of blind, disabled, and elderly people with low incomes and few resources. To qualify for SSI, individuals under age 65 must have a severe physical or mental impairment that’s expected to last at least one year or result in death. The impairment must prevent them from performing any substantial gainful activity, and make them unable to do not just their past work, but any other kind of work (considering their age, education, and work experience), regardless of whether that work exists in the immediate area or whether they would be hired. More than 7 million low-income people with disabilities received benefits through SSI in 2015.
- Social Security Disability Insurance (SSDI) replaces part of the earnings of workers who can no longer support themselves because of a severe and long-lasting disability. Workers are eligible for SSDI if they have a medical condition expected to last at least one year or result in death, if they have worked a set number of years before the onset of their disability (dependent on the age of onset), and if they have paid Social Security taxes. Benefits cannot begin until at least five months after the onset of disability. SSDI benefits are also available to a deceased worker’s dependents in some circumstances. More than 10 million workers with disabilities and their families received benefits through SSDI in 2015. While some low-income people with disabilities may receive benefits from both SSDI and SSI, their SSI benefits are reduced to account for the SSDI benefits.
- Veterans Disability Compensation is available to veterans — and their surviving spouses, children, or parents — with injuries that occurred during or were made worse by their military service. Veterans’ compensation payments increase with the severity of the service-related disability.
- Other disability payments include workers’ compensation, private disability insurance, payments made by employers, and federal or state disability available to government employees.
Health Care
- Medicare provides access to health care services for disabled Americans who have received SSDI for at least 24 months. More than 9 million people with disabilities rely on Medicare for their health coverage.
- Medicaid provides health coverage for individuals and families with low incomes and few resources who receive SSI. In addition, most states use at least one option to provide health care for some people with disabilities whose income and resources exceed SSI limits, including long-term care in some cases. For example, over 20 states provide Medicaid to people with disabilities with income below the poverty line but above the SSI limits. Almost every state provides coverage for children with severe disabilities living at home to receive care, without requiring their parents’ income to meet Medicaid income standards. And over 40 states allow individuals with severe disabilities who require long-term care with income above SSI limits to qualify for Medicaid. (See “Medicaid Financial Eligibility for Seniors and People with Disabilities in 2015,” Kaiser Family Foundation, March 1, 2016, http://kff.org/report-section/medicaid-financial-eligibility-for-seniors-and-people-with-disabilities-in-2015-report/.) More than 10 million children and adults with disabilities rely on Medicaid for their health coverage.
Housing
- The Section 811 Supportive Housing for Persons with Disabilities program provides affordable, accessible housing for non-elderly, very low-income people with significant disabilities. Section 811 housing is typically integrated into larger affordable housing apartment buildings, and is linked with voluntary supports and services. Tenants pay 30 percent of their adjusted income for rent, which ensures affordability for people who receive SSI.
- The Section 8 Housing Choice Voucher program helps very low-income families, the elderly, and people with disabilities afford rental housing in the private market. About 1 in 3 households using Section 8 vouchers are headed by a non-elderly (under age 62) person with a disability. Availability is limited and applicants may be on waiting lists for years.
- Public housing provides housing to low-income families in which the head or spouse has at least one of six functional impairments. About 1 in 5 households living in public housing are headed by a non- elderly (under age 62) person with a disability. Tenants must be low income and typically pay 30 percent of their income for rent. Availability is limited and applicants may be on waiting lists for years.
Vocational Rehabilitation and Employment Services
- State vocational rehabilitation services provide counseling, job training, and job search assistance related to the employment of people with disabilities.
- Vocational Rehabilitation and Employment for Veterans is an entitlement program that provides job training and other employment-related services to veterans with service-connected disabilities. Its comprehensive services enable veterans with service-connected disabilities and employment handicaps to become employable and maintain suitable employment.
Appendix D: SNAP Features That Help People with Disabilities
SNAP’s structure and rules allow it to respond to the economic challenges faced by many people with disabilities. SNAP is an entitlement, meaning that all applicants who meet the eligibility requirements can receive the benefits for which they qualify. SNAP also has several provisions for households with members with disabilities (where disability is defined by the receipt of other government disability benefits, see Appendix A):
- While most households must meet both a gross income test (of 130 percent of poverty) and a net income test (100 percent of poverty), a household with a person with disabilities need not meet the gross income test. This benefits households with high disability-related expenses.
- In states whose SNAP eligibility rules include an asset limit, households that include a person with disabilities can have up to $3,250 in countable resources, $1,000 more than households without an elderly or disabled member. Because SSI imposes a lower asset test, the assets of SSI recipients are not counted. In addition, the value of vehicles used to transport physically disabled household members is not counted. Every state has made use of its flexibility to apply less restrictive vehicle asset rules than those in federal law.
- Achieving a Better Life Experience (ABLE) accounts are not counted as income or resources. These tax-favored savings accounts provide secure funding for disability-related expenses on behalf of designated beneficiaries disabled before age 26.
- Households in which all members receive SSI are categorically eligible for SNAP, meaning they are considered to have met both income and asset tests. These households may also apply for SNAP at their local Social Security office. Combined Application Projects in 17 states enables the automatic SNAP enrollment of elderly or disabled SSI recipients who live alone. These projects allow seniors and persons with disabilities to use a simplified application for a standard SNAP benefit without going to a SNAP office.
- Individuals who are elderly and disabled and unable to purchase and prepare food on their own because of a substantial disability may apply as a separate household if the gross monthly income of other household members is less than 165 percent of poverty.
- People with disabilities can deduct out-of-pocket medical expenses (including the cost of caregivers) that exceed $35 per month from the income used to calculate eligibility and benefits. The Standard Medical Deduction demonstration in 18 states streamlines the calculation of this deduction by establishing a standard amount in lieu of actual medical expenses; households retain the option to claim actual medical expenses if those are higher than the standard. In addition, households with disabled individuals can deduct all shelter costs exceeding half their income after other deductions.
- Applicants with disabilities can designate an authorized representative to apply on their behalf. In most cases, applicants may apply online, request a phone interview, or request a home visit.
- People with disabilities who live in certain small, nonprofit group homes may be eligible for SNAP benefits even if the group home prepares their meals for them.
- Households in which all members are elderly or disabled can be certified for up to 24 months, rather than 12 months, with some contact with the household required after 12 months.
- Lawfully present non-citizens receiving disability-related assistance are eligible for SNAP, regardless of whether they have resided in the U.S. for at least five years.
- An unemployed SNAP recipient with a disability is exempt from the time limits imposed on able-bodied adults without dependents (ABAWDs), and is not required to register for work.
- USDA recently selected five organizations to participate in a nationwide pilot designed to deliver groceries to homebound elderly and disabled participants who are unable to shop for food.
For more detail, see “SNAP Matters for People with Disabilities,” Food Research and Action Council, July 2015, http://frac.org/wp-content/uploads/snap_matters_people_with_disabililties.pdf.
Federal, state, and local agencies are also required to ensure that services are accessible to people with disabilities. The Food and Nutrition Act, which authorizes SNAP, requires state agencies to comply with relevant civil rights law in administering the program, including the Americans with Disabilities Act and Section 504 of the Rehabilitation Act of 1973. For example, state agencies must ensure that SNAP applications are accessible for individuals with disabilities.
Appendix E: State Tables
The following tables provide state estimates for the number of people with disabilities from two different sources based on different methods.
The first tables (Appendix Tables 1 and 2) present data from the SNAP Quality Control (QC) data. As described in Appendix B, this survey uses a set of proxy indicators to identify individuals with disabilities, mostly based on receipt of government benefits (such as SSI) or a combination of receipt of certain government benefits (such as Social Security or workers’ compensation) with other, indirect indicators of disability (such as claiming an exemption from work requirements due to disability). These estimates do not identify elderly individuals with disabilities, and they miss individuals with disabilities who do not receive disability benefits, such as those with less severe or more episodic disabilities or those who are applying for benefits.
The second set of tables (Appendix Tables 3 and 4) are based on CBPP analysis of the 2013 through 2015 American Community Survey (ACS) public use microdata sample (PUMS). This is a different data source than any of the national statistics given in this paper, which use National Health Interview Survey data or USDA’s SNAP QC data. While the NHIS provides the best source of disability data, it does not allow us to construct state-level estimates. These tables are intended to provide estimates of a broader group of individuals with disabilities in each state, similar to the group identified using the NHIS. Like Tables 1 and 2, these estimates do not identify elderly individuals with disabilities.
These estimates identify people with disabilities based on a positive response to any of the six core questions that identify physical, mental, or sensory limitations (hearing, vision, cognitive, ambulatory, self-care, and independent living), similar to those described in Appendix B, as well as receipt of SSI. Unlike the NHIS estimates, the ACS does not ask about disabilities that prevent or limit work, and many of the working-age people with a disabling condition may not have work-limiting disabilities; similarly, some children with a disability may not have a condition that requires a caretaker to always be home with them.
The ACS measures SNAP participants as individuals in households that have received SNAP in the last year, which is a larger number than participants in an average month, as measured by USDA data. Due to small sample sizes, we combined three years of data, from 2013 through 2015.
| APPENDIX TABLE 1 | ||||||||||||
|---|---|---|---|---|---|---|---|---|---|---|---|---|
Households with Non-Elderly Members with Disabilities Participating in SNAP in an Average Month and Average Monthly Benefits, 2015 | ||||||||||||
| State | SNAP Households with Non-Elderly Members with Disabilities (000s) | Total SNAP Households (000s) | Share of SNAP Households with Non-Elderly Members with Disabilities | Average Monthly SNAP Benefit Per Household with Members with Disabilities | ||||||||
| Alabama | 102 | 416 | 24% | $199 | ||||||||
| Alaska | 5 | 34 | 16% | $203 | ||||||||
| Arizona | 62 | 436 | 14% | $169 | ||||||||
| Arkansas | 54 | 209 | 26% | $191 | ||||||||
| California | * | 2,070 | 1% | $116 | ||||||||
| Colorado | 40 | 230 | 17% | $199 | ||||||||
| Connecticut | 51 | 246 | 21% | $216 | ||||||||
| Delaware | 13 | 71 | 19% | $218 | ||||||||
| District of Columbia | 15 | 79 | 19% | $137 | ||||||||
| Florida | 338 | 2,008 | 17% | $203 | ||||||||
| Georgia | 144 | 834 | 17% | $227 | ||||||||
| Hawaii | 14 | 94 | 15% | $350 | ||||||||
| Idaho | 21 | 83 | 26% | $183 | ||||||||
| Illinois | 174 | 1,047 | 17% | $196 | ||||||||
| Indiana | 95 | 372 | 26% | $187 | ||||||||
| Iowa | 37 | 183 | 20% | $148 | ||||||||
| Kansas | 36 | 122 | 30% | $179 | ||||||||
| Kentucky | 103 | 363 | 28% | $185 | ||||||||
| Louisiana | 95 | 387 | 24% | $202 | ||||||||
| Maine | 36 | 104 | 35% | $184 | ||||||||
| Maryland | 77 | 402 | 19% | $184 | ||||||||
| Massachusetts | 134 | 442 | 30% | $191 | ||||||||
| Michigan | 213 | 822 | 26% | $186 | ||||||||
| Minnesota | 61 | 233 | 26% | $132 | ||||||||
| Mississippi | 65 | 295 | 22% | $184 | ||||||||
| Missouri | 103 | 397 | 26% | $180 | ||||||||
| Montana | 13 | 54 | 24% | $185 | ||||||||
| Nebraska | 20 | 77 | 26% | $167 | ||||||||
| Nevada | 33 | 207 | 16% | $179 | ||||||||
| New Hampshire | 21 | 50 | 41% | $160 | ||||||||
| New Jersey | 98 | 452 | 22% | $196 | ||||||||
| New Mexico | 35 | 200 | 17% | $194 | ||||||||
| New York | 401 | 1,638 | 24% | $223 | ||||||||
| North Carolina | 159 | 793 | 20% | $193 | ||||||||
| North Dakota | 6 | 24 | 23% | $176 | ||||||||
| Ohio | 222 | 804 | 28% | $167 | ||||||||
| Oklahoma | 67 | 266 | 25% | $174 | ||||||||
| Oregon | 81 | 439 | 18% | $152 | ||||||||
| Pennsylvania | 268 | 917 | 29% | $210 | ||||||||
| Rhode Island | 25 | 100 | 25% | $212 | ||||||||
| South Carolina | 71 | 376 | 19% | $191 | ||||||||
| South Dakota | 11 | 43 | 25% | $196 | ||||||||
| Tennessee | 124 | 606 | 21% | $195 | ||||||||
| Texas | 332 | 1,550 | 21% | $211 | ||||||||
| Utah | 16 | 87 | 18% | $162 | ||||||||
| Vermont | 13 | 45 | 30% | $222 | ||||||||
| Virginia | 91 | 395 | 23% | $174 | ||||||||
| Washington | 126 | 568 | 22% | $161 | ||||||||
| West Virginia | 51 | 180 | 28% | $142 | ||||||||
| Wisconsin | 97 | 402 | 24% | $175 | ||||||||
| Wyoming | 3 | 14 | 22% | $155 | ||||||||
| Guam | * | 15 | 4% | $444 | ||||||||
| Virgin Islands | * | 12 | 5% | $241 | ||||||||
| United States | 4,498 | 22,293 | 20% | $193 | ||||||||
Notes: As explained in Appendix B, people with disabilities are identified through a proxy flag for those who are: (1) under age 60 and receiving SSI, (2) working fewer than 30 hours per week, exempt from work registration due to disability and receiving Social Security, veterans’ benefits, or workers’ compensation, (3) in a SNAP household without an elderly member but with a medical deduction and other indications of disability, , or (4) in a single-person household and receiving Social Security. This flag likely undercounts individuals who meet the SNAP program definition of disabled and does not count individuals with disabilities who do not meet this definition. Due to rounding, individual state totals may not add up to the U.S. total. *These estimates have been excluded due to small sample sizes but are included in the totals. Source: CBPP analysis of U.S. Agriculture Department 2015 SNAP household characteristics (Quality Control) data | ||||||||||||
| APPENDIX TABLE 2 | |||||||||||||||
|---|---|---|---|---|---|---|---|---|---|---|---|---|---|---|---|
Non-Elderly Individuals with Disabilities Participating in SNAP by State in an Average Month, SNAP Administrative Data, 2015 | |||||||||||||||
| State | Non-Elderly SNAP Participants with Disabilities (000s) | Non-Elderly SNAP Participants (000s) | Non-Elderly SNAP Participants with Disabilities as a Share of Non-Elderly SNAP Participants | Total SNAP Participants (000s) | Non-Elderly SNAP Participants with Disabilities as a Share of Total Participants | ||||||||||
| Alabama | 112 | 815 | 14% | 886 | 13% | ||||||||||
| Alaska | 6 | 74 | 9% | 81 | 8% | ||||||||||
| Arizona | 73 | 902 | 8% | 986 | 7% | ||||||||||
| Arkansas | 67 | 420 | 16% | 456 | 15% | ||||||||||
| California | 26 | 4,173 | 1% | 4,346 | 1% | ||||||||||
| Colorado | 50 | 445 | 11% | 489 | 10% | ||||||||||
| Connecticut | 62 | 378 | 16% | 437 | 14% | ||||||||||
| Delaware | 16 | 136 | 12% | 147 | 11% | ||||||||||
| District of Columbia | 19 | 126 | 15% | 140 | 13% | ||||||||||
| Florida | 405 | 3,143 | 13% | 3,654 | 11% | ||||||||||
| Georgia | 168 | 1,632 | 10% | 1,789 | 9% | ||||||||||
| Hawaii | 16 | 160 | 10% | 185 | 9% | ||||||||||
| Idaho | 24 | 179 | 13% | 194 | 12% | ||||||||||
| Illinois | 193 | 1,781 | 11% | 2,010 | 10% | ||||||||||
| Indiana | 119 | 757 | 16% | 812 | 15% | ||||||||||
| Iowa | 42 | 356 | 12% | 387 | 11% | ||||||||||
| Kansas | 42 | 251 | 17% | 273 | 15% | ||||||||||
| Kentucky | 127 | 693 | 18% | 758 | 17% | ||||||||||
| Louisiana | 109 | 786 | 14% | 855 | 13% | ||||||||||
| Maine | 41 | 171 | 24% | 200 | 21% | ||||||||||
| Maryland | 96 | 687 | 14% | 771 | 12% | ||||||||||
| Massachusetts | 155 | 622 | 25% | 767 | 20% | ||||||||||
| Michigan | 244 | 1,390 | 18% | 1,565 | 16% | ||||||||||
| Minnesota | 72 | 423 | 17% | 476 | 15% | ||||||||||
| Mississippi | 80 | 578 | 14% | 633 | 13% | ||||||||||
| Missouri | 115 | 770 | 15% | 840 | 14% | ||||||||||
| Montana | 16 | 105 | 15% | 115 | 14% | ||||||||||
| Nebraska | 22 | 157 | 14% | 172 | 13% | ||||||||||
| Nevada | 37 | 363 | 10% | 408 | 9% | ||||||||||
| New Hampshire | 25 | 92 | 27% | 102 | 25% | ||||||||||
| New Jersey | 113 | 757 | 15% | 899 | 13% | ||||||||||
| New Mexico | 41 | 404 | 10% | 443 | 9% | ||||||||||
| New York | 451 | 2,340 | 19% | 2,971 | 15% | ||||||||||
| North Carolina | 184 | 1,460 | 13% | 1,611 | 11% | ||||||||||
| North Dakota | 6 | 46 | 14% | 52 | 12% | ||||||||||
| Ohio | 265 | 1,472 | 18% | 1,646 | 16% | ||||||||||
| Oklahoma | 74 | 537 | 14% | 584 | 13% | ||||||||||
| Oregon | 91 | 676 | 14% | 772 | 12% | ||||||||||
| Pennsylvania | 337 | 1,591 | 21% | 1,821 | 19% | ||||||||||
| Rhode Island | 29 | 146 | 20% | 173 | 17% | ||||||||||
| South Carolina | 81 | 729 | 11% | 798 | 10% | ||||||||||
| South Dakota | 12 | 91 | 13% | 98 | 12% | ||||||||||
| Tennessee | 136 | 1,102 | 12% | 1,215 | 11% | ||||||||||
| Texas | 407 | 3,364 | 12% | 3,703 | 11% | ||||||||||
| Utah | 18 | 209 | 8% | 223 | 8% | ||||||||||
| Vermont | 16 | 70 | 23% | 84 | 19% | ||||||||||
| Virginia | 104 | 748 | 14% | 840 | 12% | ||||||||||
| Washington | 144 | 954 | 15% | 1,058 | 14% | ||||||||||
| West Virginia | 61 | 326 | 19% | 361 | 17% | ||||||||||
| Wisconsin | 129 | 703 | 18% | 792 | 16% | ||||||||||
| Wyoming | 3 | 30 | 11% | 32 | 10% | ||||||||||
| Guam | 1 | 43 | 1% | 46 | 1% | ||||||||||
| Virgin Islands | 1 | 24 | 3% | 27 | 2% | ||||||||||
| United States | 5,283 | 40,385 | 13% | 45,184 | 12% | ||||||||||
Notes: As explained in Appendix B, people with disabilities are identified through a proxy flag for those who are: 1) under age 60 and receiving SSI, (2) working fewer than 30 hours per week, exempt from work registration due to disability and receiving Social Security, veterans’ benefits, or workers’ compensation, (3) in a SNAP household without an elderly member but with a medical deduction and other indications of disability, , or (4) in a single-person household and receiving Social Security.. This flag likely undercounts individuals who meet the SNAP program definition of disabled and does not count individuals with disabilities who do not meet this definition. Due to rounding, individual state totals may not add up to the U.S. total. Source: CBPP analysis of U.S. Agriculture Department 2015 SNAP household characteristics (Quality Control) data | |||||||||||||||
| APPENDIX TABLE 3 | |||||||||
|---|---|---|---|---|---|---|---|---|---|
Non-Elderly SNAP Participants with Disabilities by State, 2013-2015 | |||||||||
| Non-Elderly SNAP Participants | |||||||||
| State | Total (000s) | Number With Disabilities (000s) | Share with Disabilities | ||||||
| Alabama | 853 | 169 | 24% | ||||||
| Alaska | 88 | 12 | 18% | ||||||
| Arizona | 1,111 | 148 | 17% | ||||||
| Arkansas | 483 | 108 | 27% | ||||||
| California | 4,952 | 534 | 14% | ||||||
| Colorado | 532 | 83 | 19% | ||||||
| Connecticut | 420 | 80 | 24% | ||||||
| Delaware | 145 | 22 | 19% | ||||||
| District of Columbia | 112 | 23 | 25% | ||||||
| Florida | 3,418 | 508 | 20% | ||||||
| Georgia | 1,800 | 276 | 20% | ||||||
| Hawaii | 193 | 25 | 19% | ||||||
| Idaho | 228 | 41 | 21% | ||||||
| Illinois | 1,920 | 276 | 19% | ||||||
| Indiana | 926 | 186 | 23% | ||||||
| Iowa | 409 | 71 | 21% | ||||||
| Kansas | 299 | 57 | 23% | ||||||
| Kentucky | 770 | 186 | 29% | ||||||
| Louisiana | 814 | 157 | 24% | ||||||
| Maine | 201 | 58 | 34% | ||||||
| Maryland | 760 | 119 | 20% | ||||||
| Massachusetts | 757 | 175 | 14% | ||||||
| Michigan | 1,696 | 376 | 13% | ||||||
| Minnesota | 513 | 100 | 22% | ||||||
| Mississippi | 630 | 116 | 11% | ||||||
| Missouri | 855 | 185 | 16% | ||||||
| Montana | 124 | 24 | 19% | ||||||
| Nebraska | 192 | 34 | 15% | ||||||
| Nevada | 405 | 68 | 20% | ||||||
| New Hampshire | 105 | 28 | 15% | ||||||
| New Jersey | 870 | 127 | 15% | ||||||
| New Mexico | 423 | 64 | 13% | ||||||
| New York | 2,950 | 500 | 18% | ||||||
| North Carolina | 1,601 | 281 | 14% | ||||||
| North Dakota | 56 | 9 | 20% | ||||||
| Ohio | 1,788 | 404 | 17% | ||||||
| Oklahoma | 600 | 121 | 19% | ||||||
| Oregon | 819 | 153 | 24% | ||||||
| Pennsylvania | 1,675 | 391 | 19% | ||||||
| Rhode Island | 163 | 35 | 29% | ||||||
| South Carolina | 815 | 142 | 16% | ||||||
| South Dakota | 116 | 22 | 23% | ||||||
| Tennessee | 1,221 | 256 | 22% | ||||||
| Texas | 4,322 | 588 | 20% | ||||||
| Utah | 279 | 43 | 18% | ||||||
| Vermont | 75 | 19 | 22% | ||||||
| Virginia | 905 | 156 | 19% | ||||||
| Washington | 1,114 | 207 | 18% | ||||||
| West Virginia | 316 | 82 | 17% | ||||||
| Wisconsin | 765 | 139 | 26% | ||||||
| Wyoming | 41 | 7 | 15% | ||||||
| United States | 46,626 | 7,993 | 17% | ||||||
Notes: An individual with a disability or disabling condition includes anyone who has difficulty hearing, seeing, performing cognitive tasks, walking or climbing stairs, dressing or bathing, or doing errands on their own, or receives government assistance through SSI. SNAP participants are individuals in households who reported participating in SNAP at any point in the last year. These tables include all non-elderly individuals, defined as anyone under the age of 60. These figures are likely conservative as survey data undercount the number of people who participate in anti-poverty programs. Additionally, the American Community Survey undercounts the number of children with disabilities. The survey does not ask about SSI receipt of children under 15. It also only asks a limited number of disability questions to children under 15. Source: CBPP analysis of 2013 - 2015 American Community Survey 3-year averages. | |||||||||
| APPENDIX TABLE 4 | |||||||||
|---|---|---|---|---|---|---|---|---|---|
Non-Elderly Individuals and SNAP Participants with Disabilities by State, 2013-2015 | |||||||||
| Non-Elderly Individuals with Disabilities | |||||||||
| State | Total (000s) | Number Participating in SNAP (000s) | Share Participating in SNAP | ||||||
| Alabama | 449 | 169 | 38% | ||||||
| Alaska | 50 | 12 | 24% | ||||||
| Arizona | 435 | 148 | 34% | ||||||
| Arkansas | 292 | 108 | 37% | ||||||
| California | 2,187 | 534 | 24% | ||||||
| Colorado | 316 | 83 | 26% | ||||||
| Connecticut | 211 | 80 | 38% | ||||||
| Delaware | 62 | 22 | 36% | ||||||
| District of Columbia | 47 | 23 | 49% | ||||||
| Florida | 1,276 | 508 | 40% | ||||||
| Georgia | 732 | 276 | 38% | ||||||
| Hawaii | 72 | 25 | 35% | ||||||
| Idaho | 120 | 41 | 34% | ||||||
| Illinois | 755 | 276 | 37% | ||||||
| Indiana | 533 | 186 | 35% | ||||||
| Iowa | 196 | 71 | 36% | ||||||
| Kansas | 197 | 57 | 29% | ||||||
| Kentucky | 453 | 186 | 41% | ||||||
| Louisiana | 414 | 157 | 38% | ||||||
| Maine | 125 | 58 | 46% | ||||||
| Maryland | 354 | 119 | 34% | ||||||
| Massachusetts | 450 | 175 | 39% | ||||||
| Michigan | 825 | 376 | 46% | ||||||
| Minnesota | 327 | 100 | 31% | ||||||
| Mississippi | 289 | 116 | 40% | ||||||
| Missouri | 494 | 185 | 37% | ||||||
| Montana | 74 | 24 | 32% | ||||||
| Nebraska | 112 | 34 | 30% | ||||||
| Nevada | 214 | 68 | 32% | ||||||
| New Hampshire | 93 | 28 | 30% | ||||||
| New Jersey | 477 | 127 | 27% | ||||||
| New Mexico | 166 | 64 | 38% | ||||||
| New York | 1,221 | 500 | 41% | ||||||
| North Carolina | 768 | 281 | 37% | ||||||
| North Dakota | 38 | 9 | 23% | ||||||
| Ohio | 942 | 404 | 43% | ||||||
| Oklahoma | 344 | 121 | 35% | ||||||
| Oregon | 325 | 153 | 47% | ||||||
| Pennsylvania | 999 | 391 | 39% | ||||||
| Rhode Island | 82 | 35 | 43% | ||||||
| South Carolina | 389 | 142 | 37% | ||||||
| South Dakota | 59 | 22 | 37% | ||||||
| Tennessee | 586 | 256 | 44% | ||||||
| Texas | 1,830 | 588 | 32% | ||||||
| Utah | 172 | 43 | 25% | ||||||
| Vermont | 51 | 19 | 38% | ||||||
| Virginia | 523 | 156 | 30% | ||||||
| Washington | 504 | 207 | 41% | ||||||
| West Virginia | 202 | 82 | 41% | ||||||
| Wisconsin | 382 | 139 | 36% | ||||||
| Wyoming | 40 | 7 | 17% | ||||||
| United States | 22,252 | 7,993 | 36% | ||||||
Notes: An individual with a disability or disabling condition includes anyone who has difficulty hearing, seeing, performing cognitive tasks, walking or climbing stairs, dressing or bathing, or doing errands on their own, or receives government assistance through SSI. SNAP participants are individuals in households who reported participating in SNAP at any point in the last year. These tables include all non-elderly individuals, defined as anyone under the age of 60. These figures are likely conservative as survey data undercount the number of people who participate in anti-poverty programs. Additionally, the American Community Survey undercounts the number of children with disabilities. The survey does not ask about SSI receipt of children under 15. It also only asks a limited number of disability questions to children under 15. Source: CBPP analysis of 2013 - 2015 American Community Survey 3-year averages. | |||||||||
End Notes
[1] Steven Carlson is a research analyst who previously directed the Office of Policy Support at the Agriculture Department’s Food and Nutrition Service. The opinions and conclusions expressed in this report are solely those of the authors and should not be construed as representing the views of the Agriculture Department.
[2] World Health Organization, “World Report on Disability,” 2011, http://www.who.int/disabilities/world_report/2011/report.pdf.
[3] 42 U.S. Code § 12102
[4] These estimates, based on CBPP analysis for the 2015 NHIS, use the following definition of disability and are among the civilian, non-institutional population: 1) a positive response to any one of the six questions about impairments, 2) report of a work-limiting disability, or 3) receipt of SSI or SSDI for non-elderly individuals (defined under rules for those programs). This definition includes some working-age adults with disabilities that do not limit their ability to work.
[5] The wide range of these estimates reflects differences in survey questions, methods, and timing. The 2015 American Community Survey shows 39.9 million Americans with a disability (U.S. Census Bureau; American Community Survey, 2015 American Community Survey 1-Year Estimates, Table S1810; generated by CBPP; using American FactFinder; https://factfinder.census.gov/bkmk/table/1.0/en/ACS/15_1YR/S1810). The most recent NHIS, which provides perhaps the best data on the health of the U.S. population, shows 44.6 million people with a disability in 2015, or 14.2 percent of the civilian, non-institutionalized population (CBPP analysis of 2015 NHIS data). Based on a more extensive set of disability indicators in the Survey of Income and Program Participation, the Census Bureau estimates that 57 million people (18.7 percent) had some disability in 2010, the most recent year for which there are data (Matthew W. Brault, Americans with Disabilities: 2010, U.S. Census Bureau, Current Population Reports, P70-131, July 2012, https://www.census.gov/content/dam/Census/library/publications/2012/demo/p70-131.pdf). (This figure could be higher in more recent years due to population growth, particularly among the elderly population.) The Centers for Disease Control estimates that 53 million adults (22.2 percent) reported a disability in 2013 based on five of the six standard questions asked in the Behavioral Risk Factor Surveillance Survey (Elizabeth A. Courtney-Long et al., “Prevalence of Disability and Disability Type Among Adults — United States, 2013,” Morbidity and Mortality Weekly Report, 64(29):2015, 777-783, https://www.cdc.gov/mmwr/preview/mmwrhtml/mm6429a2.htm).
[6] Johanna Maleh, Robert Baldwin, and Jason Schultz, “A Death and Disability Life Table for Insured Workers Born in 1993,” Office of the Chief Actuary, Social Security Administration, Actuarial Note. No. 2013.6, January 2014, https://www.ssa.gov/oact/NOTES/ran6/an2013-6.pdf.
[7] CBPP Analysis of NHIS data, 2015.
[8] Bruce Meyer and Wallace Mok, Disability, Earnings, Income and Consumption, National Bureau of Economic Research, March 2013, http://www.nber.org/papers/w18869.pdf.
[9] Centers for Disease Control and Prevention, “Assuring Healthy Caregivers, A Public Health Approach to Translating Research into Practice: The RE-AIM framework,” 2008, https://www.cdc.gov/aging/caregiving/assuring.htm. The idea that caregiving has a negative impact on caregiver physical and psychological health is not universally held. See, for example, R. Michael Brown and Stephanie L. Brown, “Informal Caregiving: A Reappraisal of Effects on Caregivers,” Social Issues and Policy Review, 8 (1):2014, 74-102, https://deepblue.lib.umich.edu/bitstream/handle/2027.42/102687/sipr12002.pdf?sequence=1&isAllowed=y and David L. Roth, Lisa Fredman, and William E. Haley, “Informal Caregiving and Its Impact on Health: A Reappraisal from Population-Based Studies,” The Gerontologist, 55(2):2015, 309-319, https://academic.oup.com/gerontologist/article/55/2/309/656865/Informal-Caregiving-and-Its-Impact-on-Health-A.
[10] NHIS, 2015. Here “non-elderly” refers to adults ages 18 to 59.
[11] Debra Brucker et al., “More Likely to Be Poor Whatever the Measure: Working-Age Persons with Disabilities in the United States,” Social Science Quarterly 96(1): 2015, 273-96, https://papers.ssrn.com/sol3/papers.cfm?abstract_id=2379888.
[12] Julia A. Rivera Drew, “Disability, Poverty, and Material Hardship since the Passage of the ADA,” Disability Studies Quarterly, 35(3):2015, http://dsq-sds.org/article/view/4947/4026.
[13] Peiyun She and Gina A. Livermore, “Material Hardship, Poverty, and Disability among Working-Age Adults,” Social Science Quarterly 88(4):2007, 970-89, http://digitalcommons.ilr.cornell.edu/cgi/viewcontent.cgi?article=1223&context=edicollect.
[14] Susan L. Parish et al., “Material Hardship Among U.S. Families Raising Children with Disabilities,” Exceptional Children, 75(1):2008, 71-92,http://journals.sagepub.com/doi/abs/10.1177/001440290807500104 ]; Susan L. Parish et al., “Financial Well-Being of Single, Working-Age Mothers of Children with Developmental Disabilities,” American Journal on Intellectual and Developmental Disabilities, 117(5): 2012, 400-412, http://www.aaiddjournals.org/doi/abs/10.1352/1944-7558-117.5.400?code=aamr-site; and Susan L. Parish et al., “Food Insecurity among US Children with Disabilities,” presented to the National Association for Welfare Research and Statistics, August 2015, http://nawrs.org/wp-content/uploads/2015/09/2C-Parish-Food-Insecurity.pdf.
[15] Alisha Coleman-Jensen and Mark Nord, Food Insecurity Among Households with Working-Age Adults with Disabilities, Economic Research Service, USDA, January 2013, https://www.ers.usda.gov/publications/pub-details/?pubid=45040.
[16] Ibid. This study is based on data from the Current Population Survey and defines “disability” as (1) a positive response to any one of six standard questions about hearing, vision, cognitive, ambulatory, self-care, or independent living impairments or (2) being out of the labor force due to disability (unable to work).
[17] Kelly Balistreri, “Family Structure, Work Patterns, and Time Allocations: Potential Mechanisms of Food Insecurity among Children,” University of Kentucky Center for Poverty Research Discussion Paper Series, October 2012, http://uknowledge.uky.edu/cgi/viewcontent.cgi?article=1031&context=ukcpr_papers; Debra L. Brucker, “Food Security among Young Adults with Disabilities in the United States: Findings from the National Health Interview Survey,” Disability and Health Journal 9(2):2015, 298-305, http://www.disabilityandhealthjnl.com/article/S1936-6574(15)00163-6/abstract?cc=y.
[18] Coleman and Nord, Food Insecurity Among Households with Working-Age Adults with Disabilities.
[19]Jung Sun Lee and Edward A. Frongillo, “Factors Associated with Food Insecurity Among U.S. Elderly Persons: Importance of Functional Impairments,” Journal of Gerontology: Social Sciences, 56(2):2001, S94-S99, https://academic.oup.com/psychsocgerontology/article/56/2/S94/555817/Factors-Associated-With-Food-Insecurity-Among-U-S.
[20] National Commission on Hunger, Freedom from Hunger: An Achievable Goal for the United States of America, 2015, https://www.aei.org/wp-content/uploads/2016/01/Hunger_Commission_Final_Report.pdf.
[21] Jin Huang, Baorong Guo, and Youngmi Kim, "Food Insecurity and Disability: Do Economic Resources Matter?" Social Science Research, 39(1):2010, 111-24, https://www.researchgate.net/publication/229092352_Food_insecurity_and_disability_Do_economic_resources_matter.
[22] Ibid. and Susan L. Parish et al., “Assets and Income: Disability-based Disparities in the United States,” Social Work Research, 34(2):2010, 71-82, https://academic.oup.com/swr/article-abstract/34/2/71/1633472/Assets-and-Income-Disability-based-Disparities-in?redirectedFrom=PDF.
[23] For an overview of Medicaid’s role in helping people with disabilities, see “Medicaid at 50: People with Disabilities,” Kaiser Family Foundation, May 6, 2015. http://kff.org/report-section/medicaid-at-50-people-with-disabilities/
[24] Some categories of people are not eligible for SNAP regardless of their income or assets, such as individuals who are on strike, all unauthorized immigrants, and certain lawfully present immigrants. For more information see “A Quick Guide to SNAP Eligibility and Benefits”, Center on Budget and Policy Priorities, September 30, 2016, https://www.cbpp.org/research/a-quick-guide-to-snap-eligibility-and-benefits.
[25] For more information on the structure and effectiveness of SNAP, see “Policy Basics: Introduction to the Supplemental Nutrition Assistance Program (SNAP),” Center on Budget and Policy Priorities, March 2016, https://www.cbpp.org/research/policy-basics-introduction-to-the-supplemental-nutrition-assistance-program-snap.
[26] This policy, called broad-based categorical eligibility, allows the state to align these tests with the test for non-cash assistance funded by Temporary Assistance for Needy Families or state Maintenance of Effort grants. For a listing of state broad-based categorical eligibility policies, please see https://www.fns.usda.gov/sites/default/files/snap/BBCE.pdf.
[27] CBPP Analysis of 2015 NHIS data. As with estimates presented earlier for the overall population, this definition includes working-age adults who do not report a work-limiting disability.
[28] Kelsey Farson Gray and Karen Cunnyngham, Trends in Supplemental Nutrition Assistance Program Participation Rates: Fiscal Year 2010 to Fiscal Year 2014, prepared for the Food and Nutrition Service, USDA, June 2016, http://www.fns.usda.gov/sites/default/files/ops/Trends2010-2014.pdf; Andrew J. Houtenville and Debra L. Brucker, “Participation in Safety-Net Programs and the Utilization of Employment Services Among Working-Age Persons with Disabilities”; and Pamela Loprest and Elaine Maag, Disabilities Among TANF Recipients: Evidence from the NHIS, The Urban Institute, May 2009, http://www.urban.org/research/publication/disabilities-among-tanf-recipients-evidence-nhis. These resources use different definitions of disability but have consistent findings with regards to participation in SNAP among people with disabilities.
[29] Joshua Leftin et al., “Dynamics of Supplemental Nutrition Assistance Program Participation from 2008 to 2012,” prepared for the Food and Nutrition Service, USDA, December 2014, https://www.fns.usda.gov/sites/default/files/ops/Dynamics2008-2012.pdf.
[30] As described in Appendix A, SNAP rules consider disabled those who receive disability compensation for service-related or non-service-related disabilities that are rated as total, or veterans who are determined to be “permanently housebound” by the VA. The VA compensates veterans for disabilities related to their service based on a disability rating that reflect the disability’s severity and its impact on the veteran’s earning capacity in ten increments. A 100 percent rating is considered total, meaning an individual is unable to secure any gainful employment due to disability. Veterans can be paid at the total rate even if their rating is less than 100 percent if they meet certain criteria showing they are unable to obtain gainful employment.
[31] In 2015 about 8 percent of new recipients of compensation, and about 12 percent of all compensation recipients, had a combined degree of disability of 100 percent, according to the FY 15 Annual Benefits Report from the Veterans Benefit Administration, at http://www.benefits.va.gov/REPORTS/abr/ABR-Compensation-FY15-05092016.pdf. Please note that those figures do not include veterans who are paid at the 100 percent rating due to individual unemployability with a combined rating of less than 100 percent.
[32] Kathleen Romig, “Cuts Weakening Social Security Administration Services,” Center on Budget and Policy Priorities, March 15, 2017, https://www.cbpp.org/research/social-security/cuts-weakening-social-security-administration-services.
[33] The average number of days for a claim to be completed was 125.3 in July 2016, from the ASPIRE dashboard: http://www.benefits.va.gov/reports/aspiremap.asp. According to a report from the Government Accountability Office, in August 2012, the average time to complete a compensation claim was 260 days: http://www.gao.gov/assets/660/651066.pdf. The average processing time for an appeal was 3.1 years for fiscal year 2015, from the 2015 Annual Performance Plan and Report: https://www.va.gov/budget/docs/VAapprFY2017.PDF.
[34] While program rules use more benefits than these two major government programs to identify individuals with disabilities (see Appendix A), we used these to represent those who would most likely be identified under program rules given that these two major programs are the largest forms of disability assistance.
[35] CBPP analysis of 2015 NHIS data shows that over 80 percent of all individuals ages 18-59 without a disability worked at some point in the previous year, compared to about one-third of all individuals with a disability (as defined as answering affirmatively to one of six questions about a limitation, having a limitation, or receiving SSI or SSDI).
[36] Kelsey Farson Gray, Sarah Fisher, and Sarah Lauffer, “Characteristics of Supplemental Nutrition Assistance Program Households: Fiscal Year 2015,” prepared for the Food and Nutrition Service, USDA, November 2016.
[37] CBPP analysis of 2015 NHIS data. These estimates are consistent with previous analyses. For example, researchers at the Urban Institute using 2005 NHIS data found that nearly 14 percent of SNAP participants with a narrowly defined disability worked at some time during the previous year, and nearly a third worked using a broader definition. See Loprest and Maag.
[38] This is an update of similar analyses found in Arloc Sherman and Danilo Trisi, “Safety Net More Effective Against Poverty than Previously Thought,” Center on Budget and Policy Priorities, May 6, 2015, https://www.cbpp.org/research/poverty-and-inequality/safety-net-more-effective-against-poverty-than-previously-thought. This analysis corrects for the substantial underreporting of program participation in national surveys and so provides a more accurate picture of SNAP’s anti-poverty effectiveness than other estimates.
[39] Luke Shaefer and Kathryn Edin, “Rising Extreme Poverty in the United States and the Response of Federal Means- Tested Transfer Programs,” Social Service Review, 87(2):2013, 250-268, http://www.jstor.org/stable/10.1086/671012?seq=1#page_scan_tab_contents.
[40] Hilary Hoynes, Diane Whitmore Schanzenbach, and Douglas Almond, “Long-Run Impacts of Childhood Access to the Safety Net,” American Economic Review, 106(4):2016, 903–934, https://gspp.berkeley.edu/assets/uploads/research/pdf/Hoynes-Schanzenbach-Almond-AER-2016.pdf.
[41] Gray et al., “Characteristics of Supplemental Nutrition Assistance Program Households: Fiscal Year 2015,” Table A.11).
[42] See “Comprehensive Report on Able-Bodied Adults Without Dependents, Franklin County Ohio Work Experience Program,” Ohio Association of Foodbanks, 2015, http://admin.ohiofoodbanks.org/uploads/news/ABAWD_Report_2014-2015-v3.pdf. The Ohio Association of Foodbanks gathered the information for the report as a result of a partnership with the county SNAP agency to help place individuals identified as subject to the time limit in qualifying work activities after screening them.
[43] SIPP and NHIS also contain numerous, more detailed, measures of health status and disability.
[44] Richard V. Burkhauser, Andrew J. Houtenville, and Jennifer R. Tennant, “Capturing the Elusive Working-Age Population with Disabilities: Reconciling Conflicting Social Success Estimates from the Current Population Survey and the American Community Survey,” Journal of Disability Policy Studies, 24( 4): 2014, 195-205, http://journals.sagepub.com/doi/abs/10.1177/1044207312446226 and Richard V. Burkhauser et al., “Using the 2009 CPS-ASEC-SSA Matched Dataset to Show Who Is and Is Not Captured in The Official Six-Question Sequence on Disability,” paper presented at the 14th Annual Joint Conference of the Retirement Research Consortium, Washington, DC. 2012, http://www.nber.org/programs/ag/rrc/rrc2012/papers/4.3%20Burkhauser%20Fisher%20Houtenville.pdf.