Widespread Economic Insecurity Pre-Pandemic Shows Need for Strong Recovery Package

Policymakers will soon consider economic recovery legislation that, if enacted, would represent the most sweeping effort to strengthen families’ economic security in more than 50 years. For the many lower- and middle-income families whose finances were tenuous even before the COVID-19 pandemic or whose wages stalled in recent decades even as the economy grew, recovery proposals from the Biden Administration and members of Congress would provide the kind of foundation that households need to thrive: a minimum standard of economic stability through an expanded Child Tax Credit and other income assistance, more affordable health coverage, paid time off from work for when a child is born or a family member falls ill, and assistance if needed in paying for food, rent, and good-quality child care.

The recovery proposals address intense, often deeply troubling dilemmas that many families face at one time or another: Should we pay for food or for heat if we can’t afford both? Medical care or safe child care? Phone service or rent?

The sheer number of families that sometimes struggle to meet basic needs is not well understood because data on such hardships seldom span more than a year of a family’s life. Many more families face hardship — that is, an inability to afford basic needs — and poverty at some point over multiple years than in a single year. Many more families face hardship — that is, an inability to afford basic needs — and poverty at some point over multiple years than in a single year. This means that recovery proposals that shore up families’ resources in lean times and assist when necessary expenses such as rent or child care are unaffordable will help a much broader swath of the population than is often recognized.

CBPP analysis of newly redesigned Census Bureau data tracking people’s struggles over multiple years (2014 through 2016) reveals how widespread economic insecurity was even before the pandemic:

  • More than 1 in 4 households, including more than 1 in 3 households with children, experienced a major form of hardship — specifically, an inability to afford adequate food, shelter, or utilities — in one or more of the three years.
    • Among Black and Latino households with children, roughly 1 in 2 reported one of these hardships, as did more than 1 in 4 white households with children.
    • Even many households in the middle of the income scale encounter hardship. Among the middle third of households with children (ranked by their current annual income), nearly 1 in 3 reported one of these hardships over the three-year span.
  • In 4 in 10 households with children, someone had no health insurance at some point in the three years, which increased their risk of being unable to obtain medical care or pay other bills because of health care costs.
  • More than 1 in 4 households with children paid more than half of their annual cash income for housing (rent or mortgage and utilities) in one or more of the three years, and millions of households spent a larger share of their income on care for children or older dependents than the federal government considers affordable.

The Biden Administration’s recovery proposals — such as expanding the Child Tax Credit and Earned Income Tax Credit (EITC), making child care more affordable and expanding pre-K education, providing workers with paid family and medical leave, making health coverage more affordable, and strengthening nutrition programs — would have a profound impact on well-being and hardship. So would several additional proposals from members of Congress, such as expanding rental assistance and providing access to health coverage for adults whose states have refused to adopt the Affordable Care Act’s Medicaid expansion.

These historic changes would help the nation catch up to the vast majority of similarly wealthy countries, which use government policies more effectively than we do to shield children and families from economic insecurity. The changes also would ease financial strains on tens of millions of households, giving them the resources to raise a more successful generation of children, after more than year of pandemic-driven disruptions to school and family life. And, in the context of this nation’s $23 trillion economy, the costs of these changes are modest and eminently affordable.

Pre-Pandemic, 1 in 3 Households With Children Experienced Hardship

To understand families’ experiences over time, we analyzed the Census Bureau’s newly redesigned Survey of Income and Program Participation (SIPP). In 2014, SIPP became the first government survey to follow a nationally representative group of people and ask about their experiences with a variety of hardships over several consecutive years.[1] Examining the latest such data — for 2014, 2015, and 2016, collected from 3,500 households with children — we found that many more households experience hardship at some point in that three-year period than in a single year:[2]

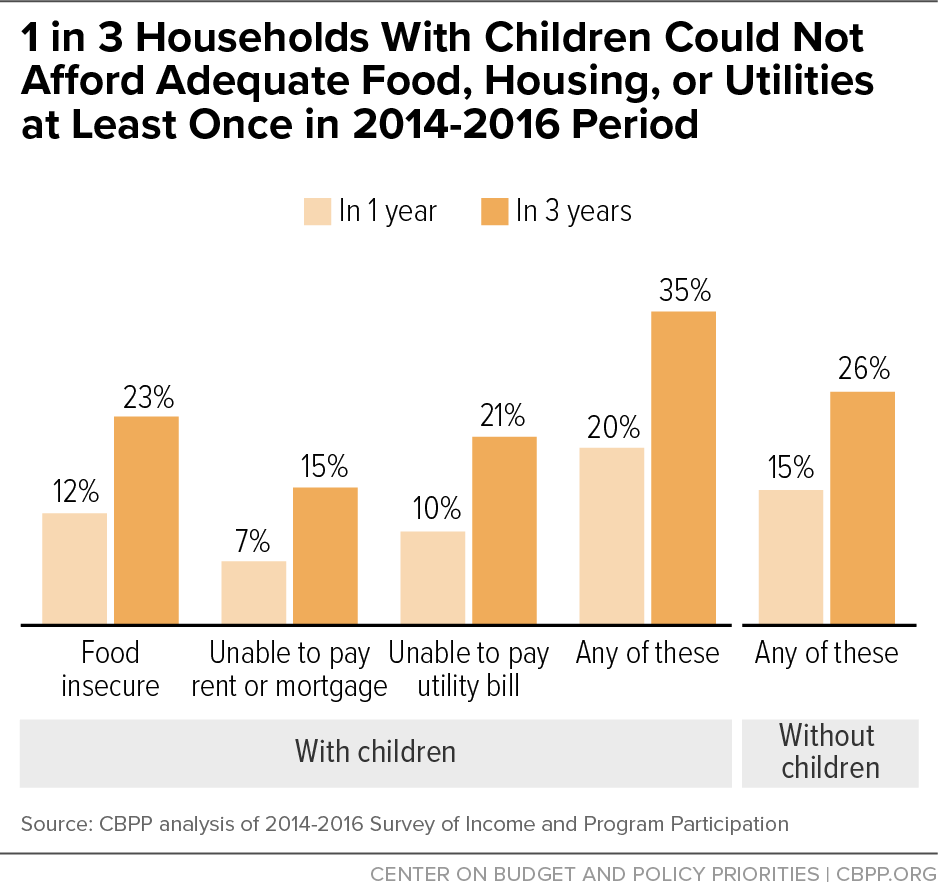
  • 23 percent of households with children (9.4 million households with 18.3 million children) were food insecure in one or more of those three years — nearly double the 12 percent that were food insecure in any one year, on average. (“Food insecure” means their access to adequate food was sometimes limited by a lack of money and other resources.)[3]
  • 15 percent of households with children (6.2 million households with 12.3 million children) reported that they couldn’t pay rent or mortgage in one or more of those three years. That’s more than double the one-year rate (7 percent).
  • 21 percent of households with children (8.5 million households with 17.0 million children) reported that they couldn’t pay for utilities (gas, oil, or electricity) in one or more of those three years. That’s more than double the one-year rate (10 percent).

Together, 35 percent of households with children (14.1 million households with 27.6 million children) experienced one or more of these indications of hardship — food insecurity or inability to pay for rent or mortgage or utilities — over the three years. (See Figure 1.)

This share was significantly higher than among households without children (26 percent). Greater hardship among families with children is troubling because children are particularly vulnerable to the effects of hardship, poverty, and economic strain, as discussed below.[4] Overall, 29 percent of households, with and without children, experienced one or more hardships over three years.

Nearly 1 in 3 Middle-Income Families Experienced Some Hardship

While hardship and other economic strains are particularly common among households with low incomes, they can strike a wide range of households for a variety of reasons. Over the three years from 2014 through 2016, some hardship (inability to afford adequate food, shelter, or utilities) affected not only the majority of lower-income households with children (55 percent of the poorest one-third of households with children ranked by annual income) but also 31 percent of those in the middle third and 10 percent of those in the highest-income third.[5]

Put differently, nearly one-third of households with children in the middle of the income scale in a given year sometimes experienced hardship over the three-year study period.[6]

In many cases, hardships for households with middle or higher incomes are triggered by sharp income drops or unexpectedly high expenses. In our SIPP data, more than 1 in 3 households with children lost one-fourth or more of their annual cash income in either 2015 or 2016, and this was true for households with low, middle, and higher incomes alike.[7]

In a separate survey gathered in 2014, researchers at the Pew Charitable Trusts found that 60 percent of all U.S. households had some financial shock in the year, such as a major car repair (30 percent of households), major home repair, illness or injury requiring a trip to the hospital, or income decline related to job loss or cut in hours or pay. (Other, less frequent setbacks ranged from funeral expenses and moving costs to the cost of running a small business.) Such financial shocks struck with little regard to income or race, and those experiencing them were less able to meet other financial obligations.[8]

Other challenges and setbacks can also contribute to hardship for households at middle and higher incomes. For example, Agriculture Department researchers note that having a disability can contribute to food hardship for people at higher income levels in part because mobility limitations or cognitive challenges can make food shopping and obtaining food assistance more difficult and costly.[9]

In sum, while having low income greatly increases a household’s risk of hardship, a surprisingly large share of pre-pandemic families with incomes in the middle of the income distribution were not economically secure and faced a substantial risk of hardship over time.

Income Volatility Puts More Households at Risk of Poverty, Hardship

Further underlining the connection between low income and hardship, the data show that 14 percent of households with children had annual cash income below the poverty line in an average year, but 24 percent experienced incomes this low in at least one of the three years. Additionally 60 percent of those in the latter group experienced hardship in at least one of the three years.

Widespread economic insecurity partly reflects the nature of the U.S. labor market, where low pay and job instability leave many households near or below the poverty line, particularly when measured over time. In 2019, 19 percent of jobs paid below-poverty wages — that is, their hourly pay was too low to lift a family of four with a full-time, year-round worker above the official poverty line ($26,172 in 2019, equivalent to $12.58 an hour).[10] And in a sign of the precariousness of many jobs, the Labor Department recorded 64 million total layoffs or other involuntary job terminations during the three years of our SIPP analysis (2014 to 2016).[11] Moreover, in the decade prior to the pandemic, the majority of jobless workers did not qualify for unemployment insurance benefits, and those who did qualify received less than half of their previous pay.[12]

Examining an even longer period than the three years used in this report would likely show higher cumulative experiences with poverty and hardship. Between birth and their 18th birthday, nearly 39 percent of U.S. children spend at least one year when their family’s earnings and other cash income are below the poverty line, or almost four times the share (less than 11 percent) who are in poverty in more than half of the years of childhood, according to an Urban Institute analysis of 1968-2009 data from the Panel Study of Income Dynamics.[13]

Gaps in Health Coverage, Housing Assistance, Child Care Are Major Sources of Financial Pressure

Many families face high expenses for housing, health care, or child care or must pay for the care of parents or other older dependents. These expenses are a key source of financial strain for many families, especially in periods of low household income. In one or more of the years from 2014 to 2016:

  • 43 percent of households with children included at least one person who had no health coverage (compared with a 25 percent one-year rate), leaving households at risk of financial hardship due to medical bills and likely leading some to forgo needed health care.
  • 28 percent of households with children paid more than 50 percent of their income for housing (compared with a 14 percent one-year rate).
  • 23 percent of households with children paid at least 10 percent of their income for child or dependent care (compared with an 11 percent one-year rate).[14] Experts recommend spending no more than 7 percent of income on child care, and spending more than 10 percent is considered unaffordable under current federal guidance.[15]

Such gaps are a major signal of financial insecurity:

Health coverage. Lapses in health coverage leave families susceptible to catastrophic out-of-pocket medical costs. In its first two years, Medicaid expansion under the Affordable Care Act in 2014 led to a $3.4 billion reduction in medical debt sent to collections and 50,000 fewer bankruptcies[16] (in addition to saving thousands of lives[17]) in the states adopting the expansion. But 2.2 million uninsured adults, including 660,000 parents, with incomes below the poverty line live in states that have refused to adopt the expansion, leaving them ineligible for Medicaid and without a pathway to affordable coverage.[18]

Consistent with this, households with children in our SIPP data were nearly twice as likely to experience food, housing, or utility hardship in a given year if someone lacked health coverage at some point that year (30 percent) than if everyone was insured (16 percent). (See Figure 2.)

Housing. Households that must pay more than 50 percent of income for housing often have little left over for other needs and are vulnerable to foreclosure, eviction, and homelessness. In our data, households with children were twice as likely to experience food, housing, or utility hardship in a given year if they paid more than 50 percent of income for housing that year (34 percent) than if they paid less (17 percent).

Child care. Unaffordable child care arrangements can squeeze out other necessities, restrict parents’ (typically mothers’) employment, and force children into unsafe or low quality care. In our SIPP data, households with children under age 6 that paid for child care were nearly twice as likely to experience food, housing, or utility hardship in a given year if they paid more than 10 percent of income for child care (19 percent) than if they paid less (11 percent).

Black and Latino Hardship Rates Higher Due to Biased Policies, Discrimination

Our success as a nation ultimately depends on whether all families, regardless of race or ethnicity, have the opportunity to thrive. But many households face added barriers to opportunity because of past and present racism and racial bias in education, employment, and elsewhere, with much of the impact originating in unjust government policies. (See box, “Racism, Discrimination Create Added Barriers to Economic Security.”) These barriers contribute to particularly high Black and Latino hardship rates for households in the SIPP data.

In the three years from 2014 through 2016, 53 percent of Black and 46 percent of Latino households with children were sometimes unable to pay for adequate food, shelter, or utilities, compared to 28 percent of white households with children.[19] (Small sample sizes make the SIPP figures for other racial groups less reliable.[20]) For example, 25 percent of Black and 20 percent of Latino households with children were sometimes unable to pay their rent or mortgage over the three-year period — far higher than the 11 percent rate for white households with children. (See Table 1.) For all three racial groups, households were at least twice as likely to experience these housing-related hardships over a three-year period than in a single year.

TABLE 1
Among Households with Children, Percent Experiencing Selected Hardships and Economic Strains Over Three-Year Period, 2014-2016
  All Latino (any race) Black White
Hardship        
Food insecure 23% 30% 34% 19%
Unable to pay rent or mortgage 15% 20% 25% 11%
Unable to pay utility bill 21% 26% 33% 17%
Any of the above 35% 46% 53% 28%
Other Signs of Strain        
One or more household members uninsured 43% 64% 46% 35%
Housing costs exceed half of household income 28% 38% 39% 21%
Child or dependent care costs exceed 10 percent of household income 23% 19% 31% 21%

Note: The Survey of Income and Program Participation (SIPP) collects child care and dependent cost figures for December, a month when these costs may be higher than usual. See footnote 14.

Source: CBPP analysis of SIPP data for 2014-2016

Racism, Discrimination Create Added Barriers to Economic Security

In education, segregation and federal, state, and local funding policies have long confined children of color to under-resourced, inadequate schools. The magnitude of the resulting lifelong damage became clear after a series of federal court cases in the 1960s-1990s that reduced segregation for Black students in some school districts and increased their access to better-resourced schools. One study found, “The average effects of five years of court-ordered school desegregation led to about a 15 percent increase in wages” for those students, as well as more work hours and marital stability, 30 percent higher annual earnings, 25 percent higher family income, and an 11 percentage-point decline in poverty rates.a (The desegregation orders had no negative impact on white students.) Unfortunately, segregation and unequal funding remain widespread.b

In employment, private-sector discrimination continues for many people of color. A 2017 study found employers were 36 percent more likely to call back white job applicants than Black applicants with equivalent qualifications (with little or no improvement in this disparity since at least 1989) and 24 percent more likely to call back white applicants than Latino applicants.c

In housing, racist federal policies of the 1930s-1960s explicitly barred Black people from affordable housing programs, including government-backed mortgages and subsidized housing, denying Black families opportunities to own homes and build wealth. Federal policies have also reinforced residential segregation, which — together with underinvestment in largely Black neighborhoods and schools — widened inequities in areas such as education and health.d

In the criminal justice system, biased policies and practices fueled the disproportionate incarceration of people of color, even when people of color and white people commit crimes at similar rates.e Incarceration lowers employability by making it difficult to acquire work experience or education. Additionally, many states bar people with criminal records from obtaining a range of occupational licenses, For Black job applicants in particular, having a criminal record lowers job call-backs by nearly two-thirds.f

Immigrants and their families face multiple barriers to obtaining public benefits that are available to others in times of need. Policies enacted in the 1990s exclude many people with lawful immigration statuses from programs such as Medicaid, food assistance, and the EITC.g Moreover, many who are eligible for assistance avoid participating out of fear that doing so may harm a family member’s ability to change or obtain an immigration status.

a Rucker C. Johnson with Alexander Nazaryan, Children of the Dream: Why School Integration Works, Basic Books: 2019; Rucker C. Johnson, “Long-Run Impacts of School Desegregation and School Quality on Adult Attainments,” National Bureau of Economic Research Working Paper No. 16664, January 2011, https://www.nber.org/system/files/working_papers/w16664/w16664.pdf.

b Sean F. Reardon et al., “Is Separate Still Unequal? New Evidence on School Segregation and Racial Academic Achievement Gaps,” Stanford Center for Economic Policy Analysis, 2019, https://cepa.stanford.edu/content/separate-still-unequal-new-evidence-school-segregation-and-racial-academic-achievement-gaps.

c Lincoln Quillian et al., “Meta-Analysis of Field Experiments Shows No Change in Racial Discrimination in Hiring Over Time,” Proceedings of the National Academy of Sciences, Vol. 117, No. 1, October 2017, https://www.pnas.org/content/114/41/10870.

d Richard Rothstein, The Color of Law, Liveright, 2017.

e Ashley Nellis, “The Color of Justice: Racial and Ethnic Disparity in State Prisons,” Sentencing Project, June 14, 2016, https://www.sentencingproject.org/publications/color-of-justice-racial-and-ethnic-disparity-in-state-prisons/.

f Nick Sibilah, “Barred From Working: A Nationwide Study of Occupational Licensing Barriers for Ex-Offenders,” Institute for Justice, August 2020, https://ij.org/wp-content/uploads/2020/08/Barred-from-Working-August-2020-Update.pdf; Devah Pager, “The Mark of a Criminal Record,” American Journal of Sociology, Vol. 108, No. 5, March 2003, pp. 937-975, http://www.jstor.com/stable/10.1086/374403.

g Confusion about immigration rules also leads many eligible families to avoid benefits for fear that enrolling their children may result in harsh immigration consequences for a family member, such as denial of lawful permanent residency, even if that’s unlikely.

Economic Insecurity Spans Regions, Races, Family Types, Rural/Metro Areas

Although the burden of hardship is spread unequally, economic insecurity affects households of all types. In every part of the country and for every family type, a notable share of households with children were unable to afford adequate food, shelter, or utilities in one or more of the three years 2014-2016, including:

  • 33 percent of northeastern, 37 percent of southern, 33 percent of midwestern, and 34 percent of western households with children;
  • 53 percent of Black, 46 percent of Latino, and 28 percent of white households with children (as previously noted);
  • 27 percent of married-couple households with children and 51 percent of unmarried or spouse-absent households with children.
  • 41 percent of households with children in rural (non-metropolitan) areas, somewhat higher than in metropolitan areas (34 percent).[21]

Other Nations Provide Much More Economic Security for Children

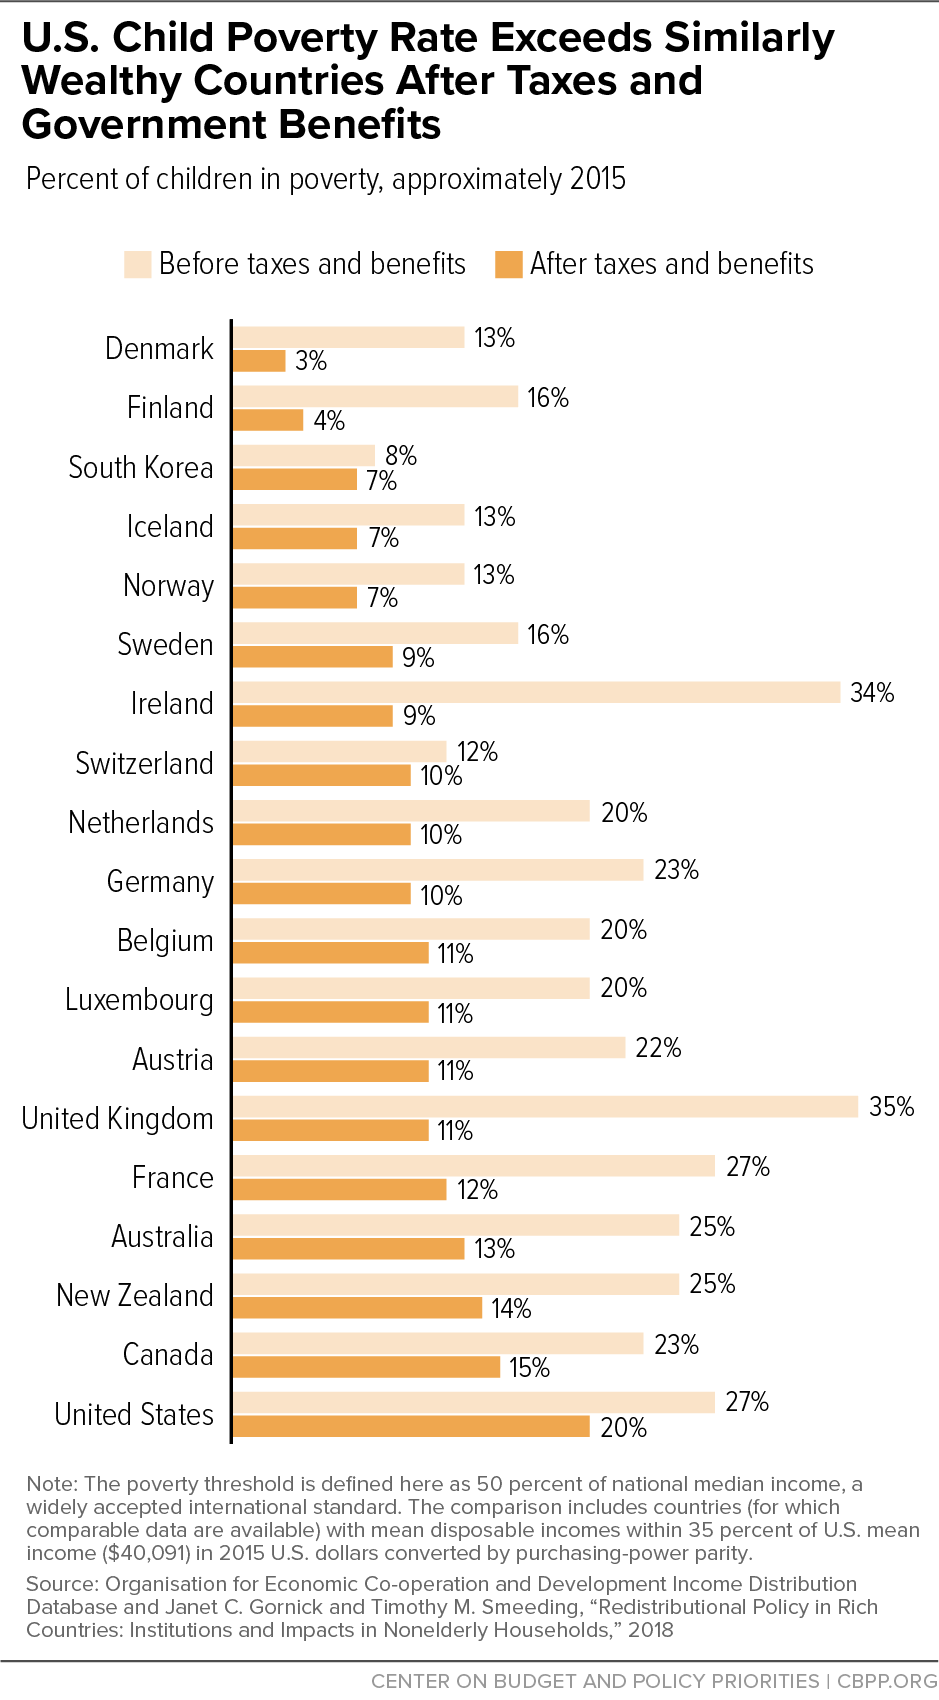
Other nations have chosen to do much more to protect families’ economic security. Although comparable hardship data are not available in other countries, the difference in approach is clear from figures on poverty. Twenty percent of U.S. children are in families with incomes below half of the national median (the poverty measure most commonly used for international comparisons) — a higher share than in any of the world’s 18 other similarly wealthy nations, where between 3 and 15 percent of children are poor. (See Figure 3.)

The high U.S. child poverty rate partly reflects weaker government aid to families in need. Before counting the income families receive from government programs, many other countries’ child poverty rates are similar to (or even higher than) the U.S. rate, as Figure 3 shows. But these countries have markedly lower child poverty rates once benefits from government programs are included.

The United States is alone among similarly wealthy nations in lacking a government-funded child allowance or national paid leave program.[22] Other nations also have shown that expanding supports can reduce child poverty. After Canada strengthened its child allowance (the Canada Child Benefit) in 2016, for example, Canada’s child poverty rate declined by one-third.[23]

Strong Recovery Package Would Have Lasting Benefits

Even temporary spells of inadequate income and trouble paying bills may have long-term, negative consequences for children. Conversely, bolstering economic supports can help children whose families have low incomes and are struggling financially. As a congressionally chartered report issued in 2019 by a National Academy of Sciences (NAS) panel explained:

The weight of the causal evidence indicates that income poverty itself causes negative child outcomes, especially when it begins in early childhood and/or persists throughout a large share of a child’s life. Many programs that alleviate poverty either directly, by providing income transfers, or indirectly, by providing food, housing, or medical care, have been shown to improve child well-being.[24]

Studies of food assistance provide evidence of children’s sensitivity to changes in family resources. The introduction of food stamps (now called SNAP) to new areas as the program gradually spread nationwide reduced family income volatility and food insecurity, leading to healthier birth weights, less maternal stress, lower rates of “metabolic syndrome” (a combined measure of obesity, high blood pressure, heart disease, and diabetes), higher earnings in adulthood, and greater self-sufficiency (based on a combined measure of employment, income, poverty status, high school graduation, and program participation). [25]

In a separate study, temporary restrictions in legal immigrants’ food stamp eligibility after 1996 were associated with significant declines in their children’s reported health status. “[A]n additional year of parental eligibility, between the time children are in utero to age 4, leads to large improvements in health outcomes at ages 6-16,” the study found.[26] Other studies have found that rental vouchers reduce poverty, homelessness (which, in turn, improves children’s mental well-being and positive behavior), and frequent moves, which can disrupt their education.[27]

Strengthening economic security programs has also been found to help low-income children improve their school performance, closing some of the gap with higher-income children. Strong evidence for this comes from cross-program comparisons of several local anti-poverty or employment-focused pilot programs for low-income families in the United States and Canada in the 1990s. Among young children transitioning into school, programs providing two to five years of more generous income assistance consistently improved academic performance more than those that provided less generous assistance.[28] In a related earlier study of several of the same interventions, participation in the more generous programs raised low-income children’s average test scores from the equivalent of the 25th percentile to the 30th percentile.[29]

Multiplied across an entire generation, such positive effects for individual children suggest that policies to reduce families’ economic insecurity and risk of poverty could yield substantial benefits for the nation as a whole. Columbia University researchers examining a proposal to create a child allowance by expanding the Child Tax Credit — similar to the expansion included in the American Families Plan — projected that every dollar of expanded benefits would return much more than that to society in higher productivity and earnings, improved health and longevity, less need for child protection programs, and other benefits.[30]

The NAS report cited above agreed that investments in family economic security would carry substantial long-term benefits, stating that “it is likely that significant investment in reducing child poverty will be very cost-effective over time.” The report listed a number of promising policy improvements that overlap with many of the proposals currently before Congress, including an expanded Child Tax Credit and EITC, more housing assistance and child care assistance, and fewer eligibility restrictions on immigrants and their families.[31]

Proposals Before Congress Would Fundamentally Improve Families’ Economic Outlook

President Biden’s American Families Plan would strengthen families’ economic security and yield strong benefits for the next generation. The plan would make the Child Tax Credit fully available on a permanent basis to children who previously received only a partial credit or no credit at all because their parents earned too little and would extend the current one-year increase in the maximum credit through 2025; these changes would reduce child poverty by more than 40 percent.[32] The plan would also expand federal support for child care and make new educational investments through a universal pre-K program, two years of tuition-free community college, and other supports for postsecondary education; provide paid family and medical leave for workers who need to care for a new child or attend to a family member’s illness; expand the EITC for workers without minor children at home (including for some noncustodial parents); improve nutrition programs for children during the school year and in the summer; and take other major steps to create a stable foundation for family finances and children’s well-being. President Biden’s American Jobs Plan also calls for creation of a subsidized jobs program to help those struggling in the labor market find work and gain work experience.[33]

In some areas, such as housing, Congress is considering important additional measures that should be included in recovery legislation. The President’s plans commendably include large-scale funding to build and rehabilitate affordable housing (part of the American Jobs Plan), but almost no rental assistance, which is needed to help families afford both the newly constructed or renovated housing as well as existing housing in communities. Affordable housing development subsidies on their own rarely make housing affordable to families with incomes near or below the poverty line, who make up the great majority of families who struggle to pay rent. In order to effectively assist families who most need help keeping a roof over their head, recovery legislation needs to include a major expansion of the housing voucher program.[34]

Other needed improvements include extending health coverage to adults in the 12 states that haven’t expanded Medicaid under the Affordable Care Act[35] and making permanent the full set of Child Tax Credit improvements enacted earlier this year.[36] Lawmakers should also reform the unemployment insurance system to cover more low-paid workers and increase benefits, as called for by President Biden and proposed by Senators Ron Wyden and Michael Bennet.[37]

Conclusion

The pre-pandemic economy left millions of families unable to pay for necessities on a consistent basis — when adults were paid low wages or faced fewer work hours or layoffs, or when families couldn’t work because they needed to care for a new child or older relative, or when illness led to lower earnings and high medical bills. Such strains, which other wealthy nations do much more to help families avoid, harm families, children, and the nation’s future.

A truly successful recovery from the pandemic and recession would address past problems in the economy. Strong congressional action on income support, housing, child care, and health coverage would help build an economy that gives all families a better chance to thrive and helps future generations succeed.

End Notes

[1] SIPP tracks cohorts of individuals for three to five years. Prior to 2014, SIPP asked each cohort about their recent hardship experiences one or two times. Since the 2014 redesign, SIPP has asked each cohort hardship questions every year. (The redesign also affected other SIPP questions and reduced the frequency of interviews per participant from three per year to one.)

Economic conditions in the three years of this analysis were not exceptional. Poverty rates declined steadily from 16.9 percent in 2014 to 14.9 percent in 2016 — similar to or slightly better than the average poverty rate of 16.5 percent over the last 30 years — according to Supplemental Poverty Measure data from Danilo Trisi and Matt Saenz, “Economic Security Programs Cut Poverty Nearly in Half Over the Last 50 Years,” CBPP, updated November 26, 2019, https://www.cbpp.org/research/poverty-and-inequality/economic-security-programs-cut-poverty-nearly-in-half-over-last-50.

[2] A household’s composition may change over the three-year period as people move. Our analysis, therefore, focuses on the experience of the reference person in the current household, generally the owner or renter of the housing unit. In our analysis, households with children are those with children in December of a given year.

[3] Alisha Coleman-Jensen et al., “Household Food Security in the United States in 2019,” USDA, September 2020, https://www.ers.usda.gov/webdocs/publications/99282/err-275.pdf?v=8745.4. Census considers households in SIPP to be food insecure if the household reference person answers affirmatively to at least two of six questions such as, “In [a particular year], were you ever hungry but didn’t eat because there wasn’t enough money for food?” and “In [a particular year], did you ever eat less than you felt you should because there wasn’t enough money to buy food?” USDA measures food insecurity in a separate survey using a longer list of up to 18 questions. For each year of 2014, 2015, and 2016, the share of households with children with food insecurity in SIPP was somewhat lower than USDA’s estimate for that year, suggesting that SIPP somewhat understates food insecurity for families with children.

[4] Moreover, household survey figures such as these leave out some of the worst-off children, including more than 300,000 homeless public school students living in shelters, hotels, motels, or on the street in the 2018-2019 school year. U.S. Department of Education, “Homeless Enrolled Students by State,” https://eddataexpress.ed.gov/dashboard/homeless.

[5] For all three income groups, these cumulative three-year hardship figures were much higher than the corresponding rates of hardship in a single year, which were 34 percent, 16 percent, and 4 percent, respectively. (The one-year figures represent hardship rates in the same year that income was measured.)

[6] When measuring three-year exposure to hardship, we ranked households with children by their annual household cash income in a given year, adjusted for household size by dividing income by the appropriate poverty line for the household’s size and age composition. (For example, we ranked middle-third households in 2014 based on 2014 income.) For each year we examined the share of middle-third households in that year that faced a hardship in any of the years 2014-2016. Then we averaged these shares across the three years. In our SIPP data, the middle third of households with children had annual incomes between $48,500 and $105,600 in 2020 dollars.

[7] When analyzing households’ income declines in 2015 and 2016, we sorted households into thirds based on annual income in 2014.

[8] Pew Charitable Trusts, “The Role of Emergency Savings in Family Financial Security: How Do Families Cope With Financial Shocks?” October 2015, https://www.pewtrusts.org/~/media/assets/2015/10/emergency-savings-report-1_artfinal.pdf.

[9] Alisha Coleman-Jensen and Mark Nord, “Food Insecurity Among Households With Working-Age Adults With Disabilities,” U.S. Department of Agriculture Economic Research Service, January 2013, https://www.ers.usda.gov/webdocs/publications/45038/34589_err_144.pdf; Alicia Coleman-Jensen, “Thirty Years After Enactment of the Americans with Disabilities Act, Disabilities Remain a Risk Factor for Food Insecurity,” U.S. Department of Agriculture Economic Research Service, December 7, 2020, https://www.ers.usda.gov/amber-waves/2020/december/thirty-years-after-enactment-of-the-americans-with-disabilities-act-disabilities-remain-a-risk-factor-for-food-insecurity.

[10] CBPP analysis of Current Population Survey outgoing rotation groups, 12-month average for 2019.

[11] Bureau of Labor Statistics, Job Openings and Labor Turnover Survey (JOLTS), total nonfarm layoffs and discharges.

[12] Chad Stone, “Congress Should Heed President Biden’s Call for Fundamental UI Reform,” CBPP, May 5, 2021, https://www.cbpp.org/research/economy/congress-should-heed-president-bidens-call-for-fundamental-ui-reform. The share of jobless workers qualifying for jobless benefits tends to rise in recessions and lawmakers expanded eligibility for jobless benefits further in the pandemic.
[13] Caroline Ratcliffe, “Child Poverty and Adult Success,” Urban Institute, September 2015, https://www.urban.org/sites/default/files/publication/65766/2000369-Child-Poverty-and-Adult-Success.pdf. The analysis shows data only for all, Black, and white children.

[14] The 2014 SIPP panel collected these cost figures for December, a month when child care costs may be higher than usual. See: Brian Knop and Abinash Mohanty, “Child Care Costs in the Redesigned Survey of Income and Program Participation: A Comparison to the Current Population Survey Annual Social and Economic Supplement,” U.S. Census Bureau Working Paper No. SEHSD-WP2018-21, July 2018, https://www.census.gov/library/working-papers/2018/demo/SEHSD-WP2018-21.html. The figures in our analysis reflect the higher of weekly child care costs (divided by estimated weekly household income in December) or monthly child and dependent care expenses (divided by monthly household income in December), asked in a separate SIPP question.

[15] “Child Care and Development Fund (CCDF) Program,” Federal Register, December 24, 2015, https://www.federalregister.gov/documents/2015/12/24/2015-31883/child-care-and-development-fund-ccdf-program.

[16] Kenneth Brevoort et al., “Medicaid and Financial Health,” National Bureau of Economic Research Working Paper 24002, November 2017, https://www.nber.org/system/files/working_papers/w24002/w24002.pdf. Charity care and bad debt among hospitals also fell by $8.6 billion (23 percent) from 2013 to 2015 following Medicaid expansion, with declines several times larger among states that expanded Medicaid than among non-expansion states. Gideon Lukens, “Medicaid Expansion Cuts Hospitals’ Uncompensated Care Costs,” CBPP, April 20, 2021, https://www.cbpp.org/blog/medicaid-expansion-cuts-hospitals-uncompensated-care-costs.

[17] Medicaid expansion increases the use of preventive care and significantly reduces the use of emergency care, resulting in earlier detection of cancers and more effective treatment of chronic illnesses. A recent study found that Medicaid expansion saved the lives of at least 19,200 adults aged 55 to 64 between 2014 and 2017. Conversely, 15,600 older adults died prematurely as a result of some states’ decisions not to expand Medicaid. Sarah Miller, Norman Johnson, and Laura Wherry, “Medicaid and Mortality: New Evidence from Linked Survey and Administrative Data,” Quarterly Journal of Economics, Vol. 136, No. 3, January 30, 2021, https://doi.org/10.1093/qje/qjab004.

[18] Gideon Lukens and Breanna Sharer, “Closing Medicaid Coverage Gap Would Help Diverse Group and Narrow Racial Disparities,” CBPP, revised June 14, 2021, https://www.cbpp.org/research/health/closing-medicaid-coverage-gap-would-help-diverse-group-and-narrow-racial.

[19] This analysis categorizes households by race and ethnicity according to the race and ethnicity of the household reference person, who is usually the person in whose name the home is owned or rented. “Latino” in this report refers to people of Hispanic, Latino, or Spanish ancestry, regardless of race. “Black” refers to people identifying as Black or African American. “Black,” “white,” and “Asian” refer to people identifying with a single race and exclude Latino.

[20] The survey includes data for a combined category of American Indian, Alaska Native, Native Hawaiian and Pacific Islander, and people identifying with more than one race; approximately half of this group reported one or more problems affording enough food, shelter, or utilities at least once over three years. Such hardships were less common for Asian households with children (11 percent), but the numbers of households in the survey were too small to make this estimate reliable.

[21] Rural areas are more racially and ethnically diverse than is sometimes appreciated: 16 percent of non-metropolitan households are headed by a person of color, of which the largest groups are Black (6 percent of all non-metro households), Latino (7 percent), and American Indian or Alaska Native (2 percent), according to 2016 data from the American Community Survey. (In SIPP data for 2014-2016, metropolitan status was not identified for 6.5 percent of households with children.)

[22] U.S. Social Security Administration and International Social Security Association, “Country Profiles,” https://ww1.issa.int/country-profiles; Sarah A. Donovan, “Paid Family and Medical Leave in the United States,” Congressional Research Service, updated February 19, 2020, https://crsreports.congress.gov/product/pdf/R/R44835. “Similarly wealthy nations” are defined, as in Figure 3, as countries with mean disposable incomes within 35 percent of U.S. mean income.

[23] Canada’s child poverty rate fell from 17.1 percent in 2015, the year before the policy was implemented, to 11.4 percent in 2017, according to the Organisation for Economic Co-operation and Development. Looking at families rather than children, and adjusting for the improving economy and other trends, one study estimated that the policy lowered the poverty rate for Canadian mothers by 5 percentage points, from about 40 percent. The researchers also found that the more generous benefit did not lower parents’ employment. Michael Baker et al., “The Effects of Child Tax Benefits on Poverty and Labor Supply: Evidence from the Canada Child Benefit and Universal Child Care Benefit,” National Bureau of Economic Research Working Paper 28556, March 2021, https://www.nber.org/papers/w28556.

[24] National Academies of Sciences, Engineering, and Medicine, A Roadmap to Reducing Child Poverty, National Academies Press, 2019, https://www.nap.edu/read/25246.

[25] Craig Gunderson and James P. Ziliak, “The Role of Food Stamps in Consumption Stabilization,” University of Kentucky Center for Poverty Research, 2003, https://uknowledge.uky.edu/ukcpr_papers/79; Douglas Almond, Hilary W. Hoynes, and Diane Whitmore Schanzenbach, “Inside the War on Poverty: The Impact of Food Stamps on Birth Outcomes,” Institute for Research on Poverty, Discussion Paper Number 1359-08, October 2008, http://www.irp.wisc.edu/publications/dps/pdfs/dp135908.pdf; Caroline Ratcliffe et al., “How Much Does the Supplemental Nutrition Assistance Program Reduce Food Insecurity?” American Journal of Agricultural Economics, Vol. 93, No. 4, 2011, pp. 1082-1098, https://papers.ssrn.com/sol3/papers.cfm?abstract_id=3570848; Hilary Hoynes, Diane Whitmore Schanzenbach, and Douglas Almond, “Long-Run Impacts of Childhood Access to the Safety Net,” American Economic Review, Vol. 106, No. 4, April 2016, pp. 903–934, earlier version at http://www.nber.org/papers/w18535; Martha Bailey et al., “Is the Social Safety Net a Long-Term Investment? Large-Scale Evidence from the Food Stamps Program,” Goldman School of Public Policy, April 2020, https://gspp.berkeley.edu/assets/uploads/research/pdf/w26942.pdf.

[26] Chloe N. East, “The Effect of Food Stamps on Children’s Health: Evidence from Immigrants’ Changing Eligibility,” Journal of Human Resources, September 5, 2018; earlier version at http://www.chloeneast.com/uploads/8/9/9/7/8997263/east_jmp.pdf.

[27] Will Fischer, Douglas Rice, and Alicia Mazzara, “Research Shows Rental Assistance Reduces Hardship and Provides Platform to Expand Opportunity for Low-Income Families,” CBPP, December 5, 2019, https://www.cbpp.org/research/housing/research-shows-rental-assistance-reduces-hardship-and-provides-platform-to-expand.

[28] The most generous program raised average annual income by $3,200 a year per family in 2021 dollars. Greg Duncan, Pamela Morris, and Chris Rodrigues, “Does Money Really Matter? Estimating Impacts of Family Income on Young Children’s Achievement with Data from Random-Assignment Experiments,” Developmental Psychology, Vol. 47, No. 5, 2011.

[29] Pamela Morris, “The Effects of Welfare Reform Policies on Children,” Social Policy Report, Vol. 16, No. 1, 2002, pp. 4-18, http://srcd.org/sites/default/files/documents/spr16-1.pdf.

[30] Irwin Garfinkel et al., “The Costs and Benefits of a Child Allowance,” Columbia University Center on Poverty and Social Policy, February 23, 2021, https://static1.squarespace.com/static/5743308460b5e922a25a6dc7/t/605978841a7c672eaed64ec6/1616476294180/Child-Allowance-CBA-brief-CPSP-March-2021.pdf.

[31] National Academies of Sciences, Engineering, and Medicine, op. cit.

[32] CBPP, “Make Child Tax Credit Improvements Permanent in Upcoming Recovery Legislation,” June 21, 2021, https://www.cbpp.org/blog/make-child-tax-credit-improvements-permanent-in-upcoming-recovery-legislation.

[33] Laura Meyer, “Subsidized Employment Must Be a Part of Any Recovery Package,” CBPP, April 27, 2021, https://www.cbpp.org/blog/subsidized-employment-must-be-a-part-of-any-recovery-package.

[34] Doug Rice, “Large-Scale Investment in Rental Assistance Needed for Equitable Recovery,” CBPP, May 27, 2021, https://www.cbpp.org/blog/large-scale-investment-in-rental-assistance-needed-for-equitable-recovery.

[35] Gideon Lukens and Breanna Sharer, “Closing Medicaid Coverage Gap Would Help Diverse Group and Narrow Racial Disparities,” CBPP, revised June 14, 2021, https://www.cbpp.org/research/health/closing-medicaid-coverage-gap-would-help-diverse-group-and-narrow-racial.

[36] “Make Child Tax Credit Improvements Permanent in Upcoming Recovery Legislation,” op. cit.

[37] Chad Stone, “Congress Should Heed President Biden’s Call for Fundamental UI Reform,” CBPP, May 5, 2021, https://www.cbpp.org/research/economy/congress-should-heed-president-bidens-call-for-fundamental-ui-reform.