SNAP Caseload and Spending Declines Have Accelerated in Recent Years
Participation and spending in the Supplemental Nutrition Assistance Program (SNAP, formerly food stamps) continue to decline, reflecting the program’s responsiveness to economic conditions, which improved in the years after the Great Recession.
- The number of people participating in SNAP declined by more than 7 million people, or about 16 percent, between 2013 and 2018.[1]
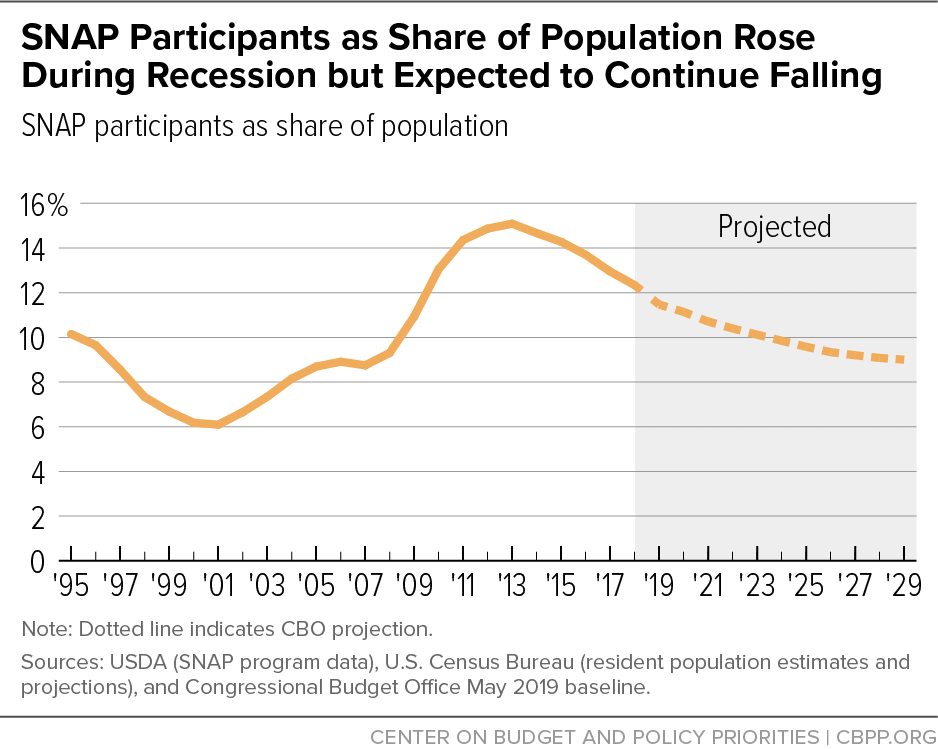
- By the end of 2018 the share of the population participating in SNAP had returned to late-2009 levels and is projected to fall further.
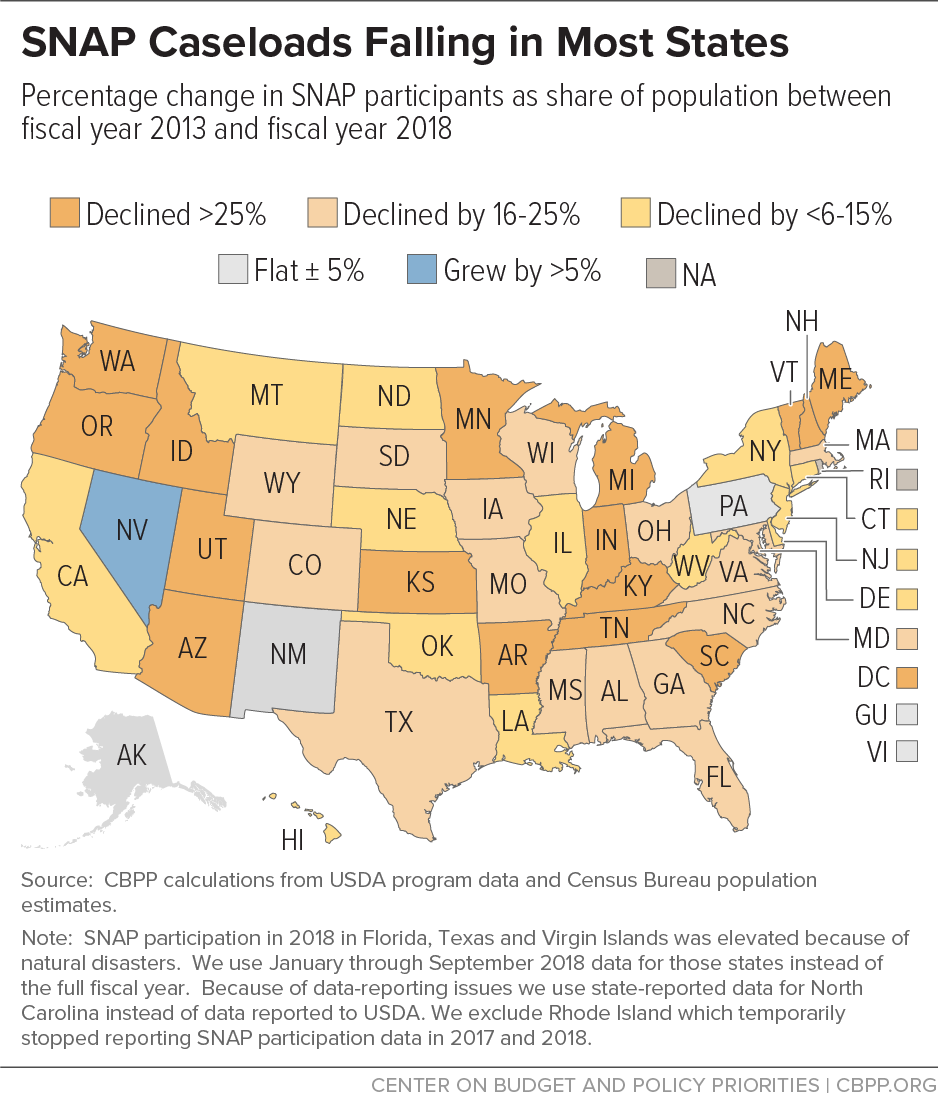
- SNAP caseload declines have been widespread; the share of the population receiving SNAP was lower in 2018 than in 2013 in 45 states, the District of Columbia, and Guam. In ten states, the share of the population receiving SNAP has fallen to pre-recession levels. (See Figure 1 and Appendix.)
- SNAP spending also has fallen. SNAP outlays fell for the fifth straight year and were 5 to 6 percent lower in 2018 than in 2017, a faster decline than the 4 percent decrease in each of the prior two years. In 2018 SNAP spending dropped to its lowest point since 2009, and about 20 percent below 2013 peak levels.[2]
Previously, SNAP caseloads had grown significantly between 2007 and 2011 as the recession and lagging recovery led more low-income households to qualify and apply for help. As the effects of the economic recovery began to reach low-income households, SNAP caseload growth slowed substantially in 2012 and 2013, and then started falling, by about 2 percent in 2014 and 2015, and at a faster rate each year since.
The decline in SNAP participation is likely due largely to the improving economy. Another, smaller factor is the return of the three-month time limit on SNAP participation for childless adults without disabilities, which most states temporarily lifted during and after the Great Recession.
While SNAP participation has fallen significantly, it has not yet returned to pre-recession levels largely because most states have made considerable progress in reaching more eligible households. Falling participation that reflects improving economic circumstances is welcome, but in some states it may also reflect national or state-level policies or practices that roll back progress in reaching eligible participants.
2018 Figures Adjusted to Better Reflect Trends in the “Regular” SNAP Program
Our analysis of the trends in SNAP participation and spending for 2018 nationally and in individual states includes several adjustments to better represent the underlying trends in SNAP.
First, we exclude the effects of natural disasters, which cause a temporary spike in SNAP participation and spending that does not represent the underlying trends.a
- For Texas, Florida, and the Virgin Islands, where the effects of hurricanes Harvey, Irma, and Maria had the biggest impacts, we exclude SNAP participation data for October through December 2017, and instead use data for only January through September 2018 (the remainder of fiscal 2018) to better represent the number of people participating in the regular SNAP program.b
- Similarly, to better reflect regular SNAP spending trends, we exclude an estimate of the increased SNAP outlays in 2017 (about $500 million) and 2018 (about $2 billion) that were due to disaster spending, based on the U.S. Department of Agriculture’s (USDA) detailed participation reports.c
- Puerto Rico does not participate in the regular SNAP program, but instead receives a capped block grant. As a result, SNAP could not automatically expand despite the major impacts Hurricane Maria had on the island. In the fall of 2017 Congress appropriated an additional $1.27 billion for disaster SNAP in Puerto Rico. We have excluded from SNAP outlays the amount (approximately $700 million) that was spent in 2018.
Second, we make adjustments for data reporting problems in two states.
- Rhode Island temporarily stopped reporting SNAP participation data in mid-2017 because of “system reporting issues.” For accurate comparisons we exclude Rhode Island from national data in all years.
- We substitute state-posted data for North Carolina in 2018 because these figures more accurately reflect SNAP participation than the data North Carolina reported to USDA.d
According to the official data from the Agriculture and Treasury departments (i.e., without these adjustments), SNAP participation nationally declined by 4 percent instead of 5 percent between 2017 and 2018 and SNAP spending declined by 2.4 percent instead of the 5 to 6 percent we estimate. Because disaster SNAP is an important program feature, for the discussions and charts below about longer-term trends in SNAP participation and spending we use the official Agriculture Department data and do not include the adjustments explained in this box.
a After disasters, USDA and states work together to provide quick, temporary, targeted food assistance through SNAP. This can include replacing participants’ benefits to compensate for lost food, providing temporary Disaster SNAP (D-SNAP) benefits to non-participants who have suffered significant loss, and relaxing program requirements to ease access and relieve undue burden on staff.
b Participation in regular SNAP may have remained elevated after December 2017.
c USDA’s detailed SNAP’s reports can be found at https://www.fns.usda.gov/data-and-statistics. Because the disasters occurred in September 2017 we assumed that some of the obligations from September 2017 were outlays in 2018.
d North Carolina’s state-reported SNAP participation data can be found here: https://www.ncdhhs.gov/divisions/social-services/program-statistics-and-reviews/fns-caseload-statistics-reports.
Caseloads Have Fallen in Most States
SNAP caseloads increased substantially in every state during the recession and slow recovery. Caseloads have declined in almost every state since December 2012, though the timing and depth of the declines has varied across the states.
Nationally, the number of SNAP participants fell by about 16 percent between 2013 and 2018. The share of the population participating in SNAP fell by about 19 percent over this period, with the difference reflecting modest U.S. population growth.[3] In 45 states, the District of Columbia, and Guam, a smaller share of the population participated in SNAP in 2018 than in 2013.[4] (See Figure 1 and Appendix.)
- Caseloads have declined substantially in most states since 2013. In 32 states and the District of Columbia, the share of the population participating in SNAP fell by at least 15 percent between 2013 and 2018, and in 16 of those states and D.C., caseloads have fallen by more than 25 percent. In many of these states, caseloads have fallen steadily since peaking in 2012 or 2013, and in nine states and D.C., participation as a share of population is at or nearing pre-recession levels.[5]
- In 16 states, Guam, and the Virgin Islands, the share of the population receiving SNAP has fallen by less than 15 percent or has been flat. This group includes several states where SNAP has declined steadily for some time but at a slower rate (such as New York and Texas), and others (such as Illinois and California) where declines began more recently (in late 2014 or later), and as a result, caseloads have not fallen as significantly. The share of the population now receiving SNAP is modestly higher in 2018 than in 2013 in New Mexico and the Virgin Islands (by about 1 percent in New Mexico and 1 percent in the Virgin Islands, where the island is still recovering from the effects of hurricanes Irma and Maria). Because some of the states that have been declining less or growing are larger states, they have a disproportionate impact on national SNAP caseloads.
- Nevada is the only state with significant growth (about 12 percent) in the share of the population receiving SNAP during this period. But the share has been relatively flat since late 2015. Some of the factors contributing to the growth, such as improved participation rates, are discussed below.[6]
SNAP Grew During the Recession Due to Rising Caseloads and Recovery Act Spending
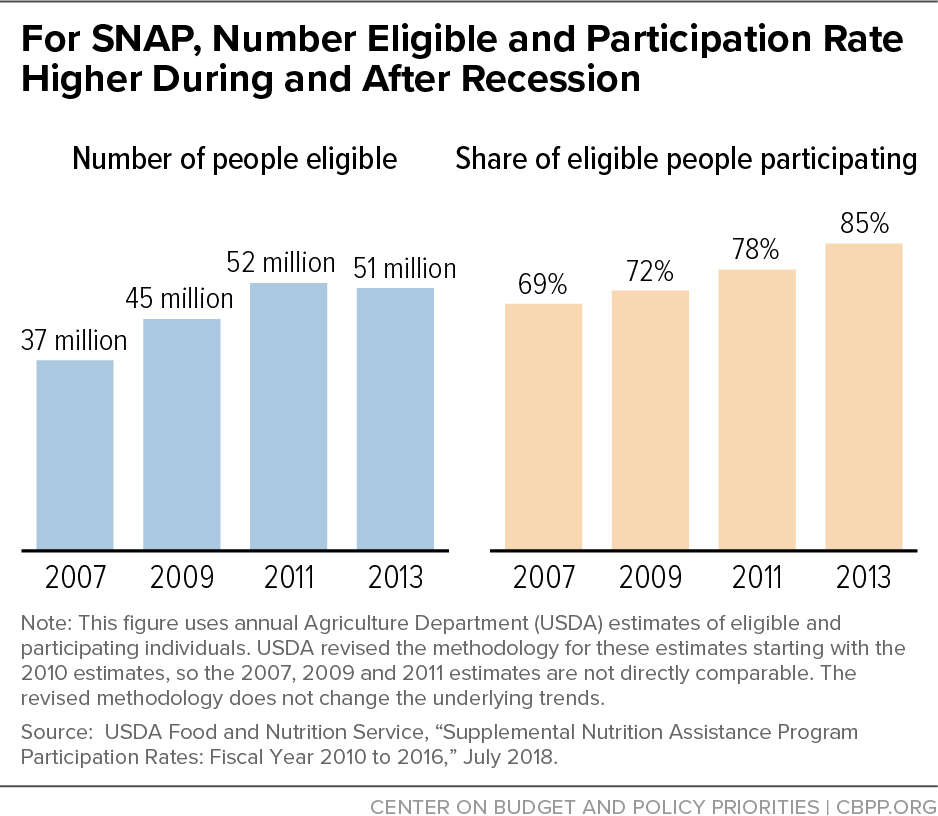
Two factors drove SNAP’s rapid caseload growth between 2007 and 2013: first, more households qualified due to the steep recession and sluggish initial recovery, and second, a larger share of eligible households applied for help.[7] Figure 2 shows the considerable increases in both areas.
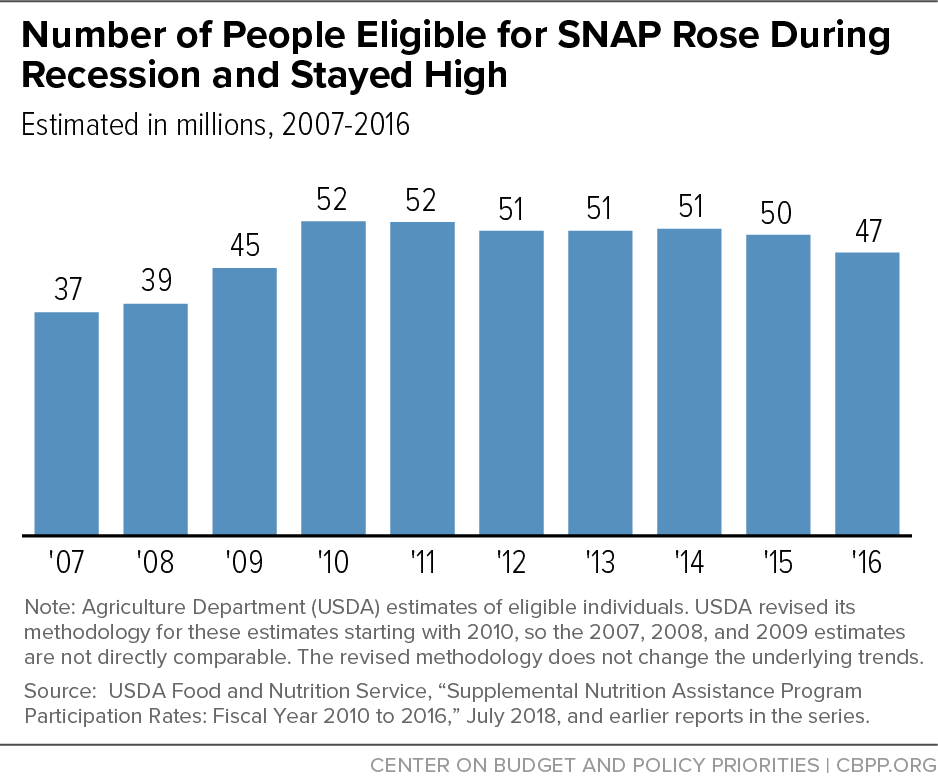
- More people eligible. The number of people eligible for SNAP rose from 37 million in 2007 (before the recession) to 45 million in 2009 and to 51 million in 2013, according to Department of Agriculture (USDA) estimates. The Congressional Budget Office (CBO) has confirmed that “the primary reason for the increase in the number of participants was the deep recession . . . and subsequent slow recovery; there were no significant legislative expansions of eligibility.”[8]
- More of those eligible participated. The participation rate among eligible individuals also rose, from 69 percent in 2007 to 85 percent in 2013.[9]
Several factors likely contributed to the increase in the participation rate. The widespread and prolonged effects of the recession, particularly the record long-term unemployment, may have made it more difficult for family members and communities to help people struggling to make ends meet, and households may have spent down the savings they had. Households that already were poor became poorer during the recession and may have been in greater need of help. Some individuals who may not have realized that they were eligible for SNAP, especially people working in low-wage jobs who had little connection to the human services system, may have gained experience with the eligibility rules and application procedures during a recession-related bout of unemployment and then continued participating after they resumed employment at low-wage jobs. In addition, states continued efforts they’d begun before the recession to reach more eligible households — particularly working families and senior citizens — by simplifying SNAP policies and procedures. For example, many states launched online SNAP applications and offered more telephone service during this period. Finally, take-up of SNAP among eligible households is higher when benefits are higher, research shows, so the 2009 Recovery Act’s temporary benefit increases may have raised participation rates.
The 2009 Recovery Act also raised SNAP costs by temporarily boosting SNAP benefits to provide fast and effective economic stimulus and push against the recession’s rising tide of hardship for low-income Americans. Economists at CBO and Moody’s Analytics consider SNAP one of the most effective forms of economic stimulus.[10] The Recovery Act’s benefit boost raised SNAP spending by over $40 billion, before ending early in fiscal year 2014.[11]
Declines in SNAP Caseloads and Spending Expected to Continue
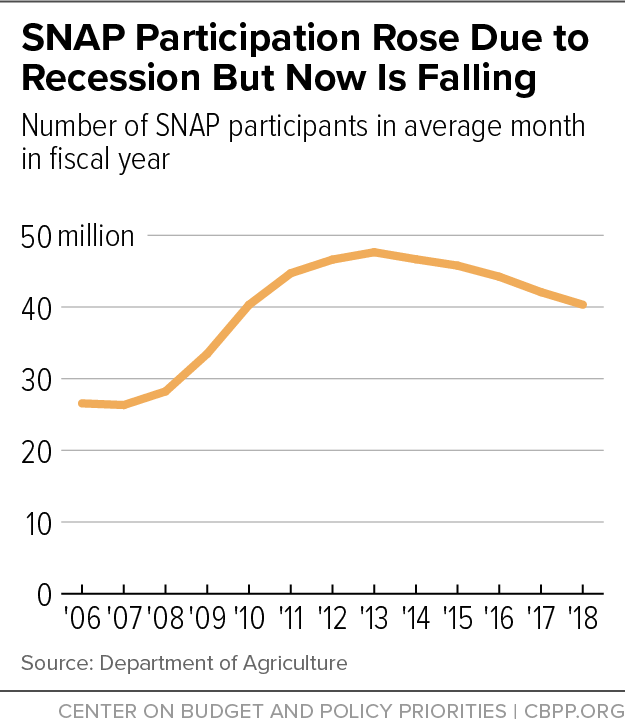
Annual SNAP caseload growth slowed to 4 percent in 2012 and 2 percent in 2013. In 2014 and 2015, SNAP caseloads declined in most states; as a result, the national SNAP caseload fell by 2 percent both years. Caseloads declined more quickly beginning in 2016, when the number of SNAP participants fell 3.4 percent from the year before; it then declined 4.6 percent in 2017 and 4.7 percent in 2018, when the number of participants was 40.4 million.[12] (See Figure 3.)
Nationally, SNAP caseloads have been falling for five years; about 7 million fewer people participated in SNAP in 2018 than in 2013. Preliminary data for just the first three months of 2019 show that SNAP participation has continued to fall ― by an additional 1.3 million individuals, or about 3 percent, compared to the 2018 annual average.[13]
A California state policy change will cause SNAP participation to rise slightly in 2019 (and future years). The state passed legislation in 2018 to expand SNAP eligibility to recipients of Supplemental Security Income (SSI). Since the mid-1970s, SSI recipients have not been eligible for SNAP in California (most states have always made them eligible, and all states but California have since the mid-1990s).[14] There are about 1.2 to 1.3 million SSI recipients in California, and many are newly eligible for SNAP. Others, because of SNAP’s household and income-counting rules, will be ineligible under federal rules, or will be in existing SNAP households that will become ineligible or will receive a higher or lower benefit than they currently receive. We expect, based on the experience in other states, that California will add at least 500,000 individuals to the program in a typical month once it fully implements its expansion, though the timing and full impact of the change are uncertain.
Over the longer term, CBO expects that as the economy improves, the number of participants will fall by about 6 percent in 2019 and about 1 to 2.5 percent each year over the next decade: from 40.4 million in 2018 to 37.9 million in 2019.[15] By 2029, CBO forecasts that the share of the population receiving SNAP will return close to 2007 levels, at about 9 percent (31.8 million). (See Figure 4.)
Spending and Caseloads Will Continue Falling, Forecasts Indicate
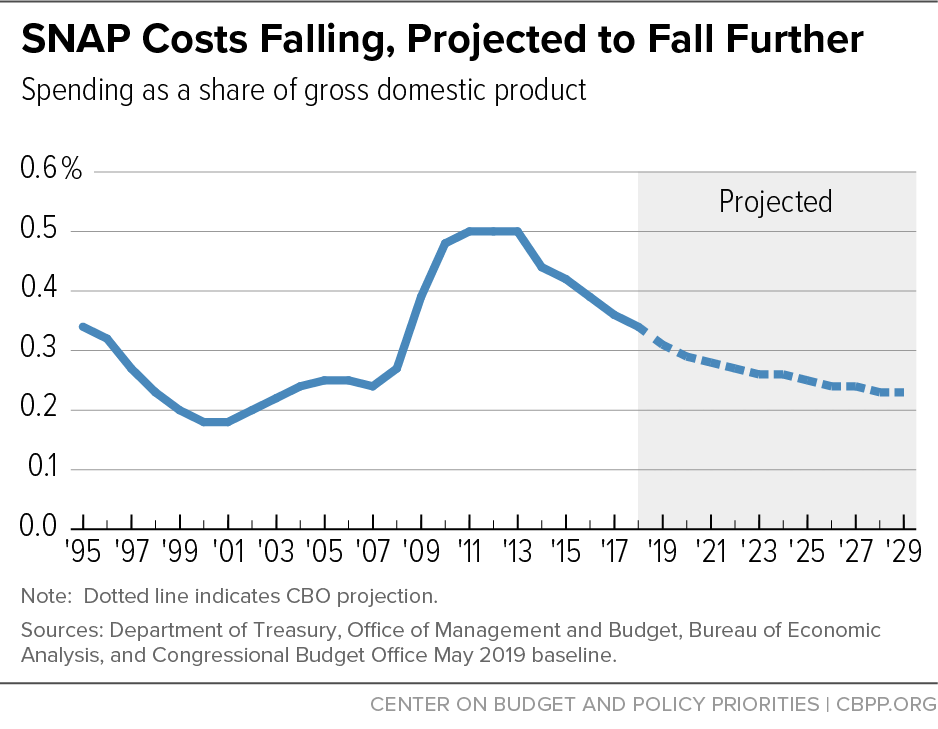
CBO and others expect SNAP participation and spending will continue to decline. SNAP spending as a share of gross domestic product returned to its 1995 level in 2018, and CBO expects this share to continue falling over the next decade and to return to its 2007 levels by 2026. (See Figure 5.)
Over the long term, SNAP costs are expected to rise (in nominal terms) only in response to growth in the size of the low-income population and increases in food prices. Unlike health care programs and Social Security, SNAP faces no demographic or programmatic pressures that will cause its costs to grow faster than the overall economy. Thus, SNAP will not contribute to the nation’s long-term fiscal problems.
Factors Influencing Caseload Trends
SNAP caseloads have historically tracked economic conditions, rising when the economy weakens and then falling — with a several-year lag — when it recovers. Other factors that influence SNAP caseloads include eligibility and other program rule changes that affect who can participate, administrative policies and practices that influence ease of access for participants, and temporary participation spikes due to natural disasters. While the economy was the most dominant factor during the Great Recession and its aftermath (and participation increased nationwide), the factors affecting the trends have varied more in recent years across states, though almost all have seen declining participation.
Economic Factors
Research on the Great Recession finds that economic factors explain between half and 90 percent of the increase in SNAP caseloads between 2007 and 2011.[16] One study tested different measurements of how the economy affected SNAP caseloads at the state and local level, and found that it explained 70 to 90 percent of the increase in caseloads; it also found substantial lags — of up to two years — between changes in the economy and in SNAP participation.[17]
Conversely, it is likely that economic improvement can explain most of the decline since 2012, with the time limit re-implementation playing a smaller role, most pronounced in 2016.
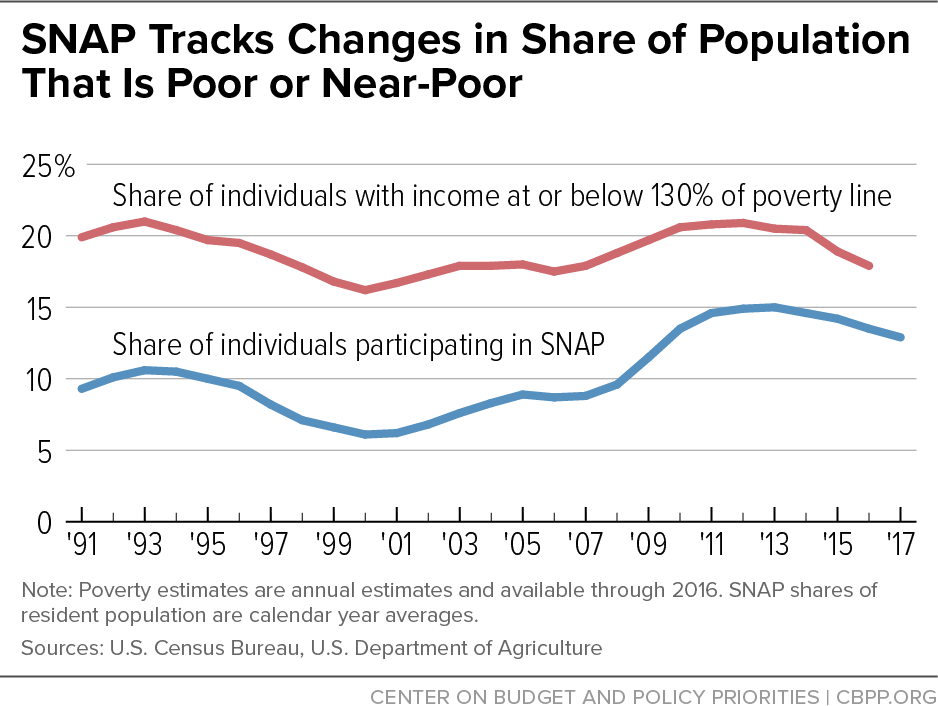
One reason for the lag between the unemployment rate and caseload decline is that the poverty rate remained elevated above pre-recession levels through 2015. SNAP’s federally established income limit is 130 percent of the poverty line, so the number of people below that level is a better indicator of need for SNAP than the unemployment rate. The share of Americans with income below 130 percent of the poverty line rose from about 18 percent in 2007 to 20 percent through 2014, before dropping to 19 percent in 2015 and falling back to 18 percent (the pre-recession level) in 2016 and 2017. (See Figure 6.) And, the number of people below 130 percent of the poverty line was still about 3 million higher in 2017 than in 2007.[18]
The lag between improvements in the unemployment and poverty rates shows that the effects of the economic recovery were slow to reach low-income families. Other indicators of hardship similarly show that families continued to struggle years into the recovery. For example, the food insecurity rate ― the share of households that struggled to afford an adequate diet at some point during the year ― remained above pre-recession levels in 2017 (the most recent year for which estimates are available), despite the slow decline from its peak during the Great Recession and through 2011.[19] Also, the number of people eligible for SNAP remained well above pre-recession levels through 2016, the most recent year for which USDA estimates are available. (See Figure 7.)[20]
Participation Rates and State Administrative Policies and Practices
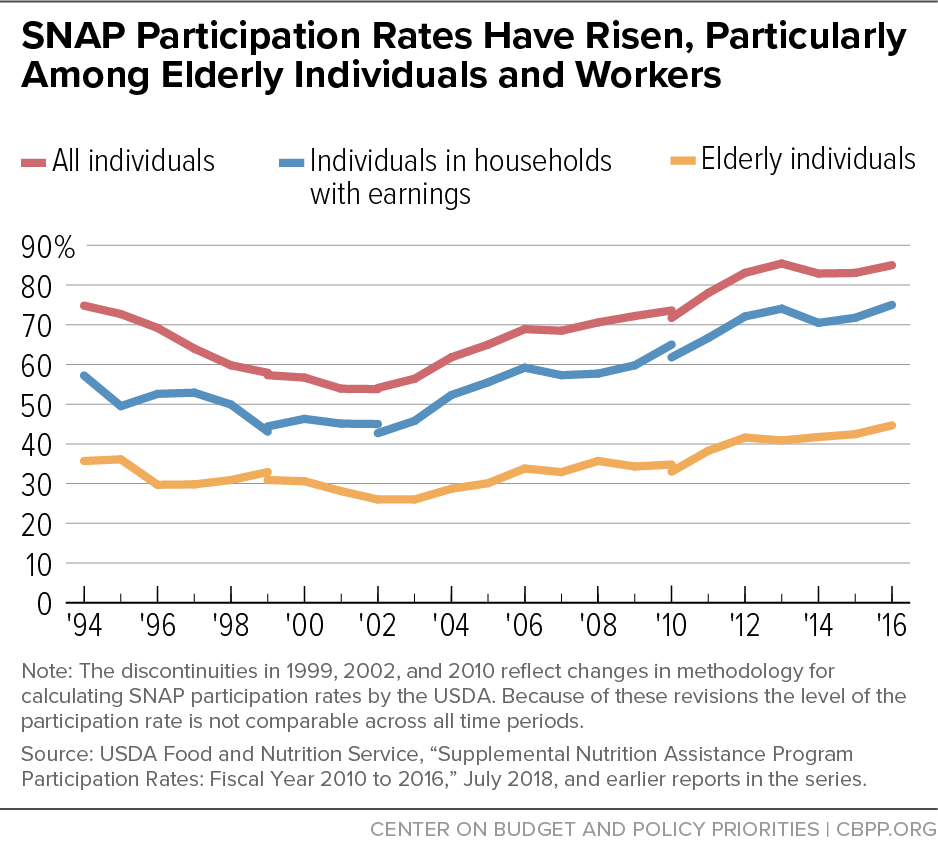
Even if by 2018 the number of people eligible for SNAP has returned to pre-recession levels, it would make sense that the number participating in SNAP would still be higher given the trend in participation rates among eligible individuals. SNAP participation rates stayed high ― at 83 to 85 percent of eligible individuals ― from 2012 through 2016 (the most recent year for which USDA has estimates). (See Figure 8.)
Many states have made progress in reducing administrative barriers, including simplifying SNAP policies and the program’s enrollment and renewal procedures; states are increasingly making use of technological advances to streamline applicants’ documentation processes and reduce the need for them to make multiple trips to the human services office.[21] These advances have allowed the program to do a better job at reaching participants and preventing eligible participants from losing benefits, including some groups of eligible households that historically have had low participation rates, such as the elderly and households with earnings.
Many of the advances that states have made in reducing application and participation barriers appear to have especially helped working families and seniors. The share of eligible low-income working families participating in SNAP rose from 57 percent in 2007 to 75 percent in 2016. Among the eligible low-income elderly, the participation rate rose from 30 percent in 2007 to 45 percent in 2016.
A few states that historically had quite low participation rates, such as California and Nevada, have had substantial increases in their participation rates in recent years. The participation rate among eligible Californians rose from about 48 percent in 2007 to 72 percent in 2016, and in Nevada it rose from 52 percent to 83 percent over the same period.[22] SNAP caseloads have declined more slowly in these states than the average rate of decline nationally. For example, in California, the share of the population participating in SNAP declined by about 9 percent between 2013 and 2018, compared to 19 percent nationwide, and caseloads grew in Nevada during this period.
These improvements in some state participation rates reflect efforts to streamline administrative processes and eliminate burdensome and restrictive policies that impeded access for many eligible participants. California, for example, has made considerable progress in reducing barriers to participation and restrictive policies that impeded participation. Some recent studies have explored ways of measuring the impact of administrative policies and processes on caseload trends, finding that policies that make SNAP participation more cumbersome or that can increase stigma (such as requiring participants to re-apply more frequently or that applicants be fingerprinted) can reduce SNAP caseloads. Meanwhile, implementing policies that are more customer-friendly can help make sure fewer eligible participants lose benefits through administrative problems.[23] On the other hand, some states have adopted more restrictive policies that may have reduced participation rates.
Higher participation rates may also reflect that households that gained familiarity with SNAP during the recession may still be eligible or experience periods of eligibility. Even for households that have improved economic circumstances, many face tight budgets and volatile incomes.
Family budgets for low-income households may be increasingly constrained due to factors such as rising rent costs. Census data show that between 2001 and 2015, the number of low-income renters paying more than half of their income for housing or living in severely substandard housing jumped a startling 66 percent.[24] Housing prices have also been growing faster than incomes: while income among renting households fell during the recessions that began in 2001 and 2007, and by 2017 had only just recovered to 2001 levels (in inflation-adjusted terms), median housing costs grew by 10.7 percent over this period.[25] Households with high housing costs are left with significantly less money for other necessities. For example, severely cost-burdened households (those devoting over half of their spending to rent) with children spent an average of $190 less on food each month compared to low-income households with children that spent less than 30 percent of their income on rent in 2016.[26]
Working SNAP participants face a low-wage labor market characterized by flat pay, irregular schedules, and job volatility, and many experience periods when they are between jobs, when they are more likely to turn to SNAP.[27] Many households might turn to SNAP even when they’re employed to supplement low incomes, or when they are between jobs to help weather a period of unemployment.
Re-imposition of Time Limit
The re-implementation of the three-month time limit for childless adults has contributed to declining caseloads, especially in 2016 and the years since.
An austere provision from the 1996 law that significantly weakened core basic needs programs limits unemployed adults aged 18-49 who aren’t disabled or raising minor children to three months of SNAP every three years.[28] The law allows states to suspend this three-month limit in areas with high and sustained unemployment, so many states qualified for and received statewide waivers due to the Great Recession and its aftermath. But as unemployment rates have since fallen, most states have remained eligible to waive the time limit only for high-unemployment areas within the state, or have opted to forgo waivers all together.
The impact of the time limit’s return on SNAP participation levels was most pronounced in 2016, when 21 states implemented it for the first time since before the recession in at least part of the state.[29] In those states, the number of SNAP participants potentially subject to the time limit (adults age 18-49 without disability benefits or children in their household) fell by about 1 million, or nearly 40 percent, between 2015 and 2017, reflecting the large number that were cut off from SNAP because of the time limit.[30]
Adults potentially subject to the time limit make up a relatively small share of SNAP participants — only about 10.5 percent in 2013, the year when the share was the highest. (The share declined to about 7.8 percent in 2017.) Therefore, just as childless adults did not substantially contribute to caseload increases during and in the years following the recession, they did not account for a major share of overall caseload decline since 2013 as many of them lost eligibility. On the other hand, these steep caseload declines among childless adults losing eligibility are still troublesome, as research shows that individuals who lose benefits from the time limit are not likely to gain well-paying employment, and often face hardships such as difficulty affording adequate food or housing.[31]
Eligibility Changes
State or federal policies that affect who is eligible to receive SNAP benefits can also affect the number of people participating. For more than a decade there have not been major federal policy changes that have affected SNAP eligibility, but since 2007 more states have taken advantage of a policy option called broad-based categorical eligibility. This option allows states to extend eligibility above SNAP’s federal income limits and to households with higher assets than allowed under federal SNAP rules.[32] While federal rules have allowed states to use this option since 2000, many states adopted it more recently, in 2007 or later, and now most states use the option to raise their gross income test, asset limit, or both.[33]
This option has only a modest effect on SNAP caseloads, however. CBO has estimated that use of this option in all states that have adopted it — not just those that adopted it over the past decade — accounts for about 2 percent of program costs and about 5 percent of SNAP participation.[34] This option has also contributed to a small share of the increase in SNAP participation during the recession, according to recent studies.[35]
States have also adopted other policies that affect eligibility for other groups of individuals with relatively small effects on caseloads. For example, while federal SNAP rules permanently disqualify individuals convicted of a drug felony from receiving SNAP benefits, by 2019, almost every state has adopted a state option to modify or eliminate this ban.[36]
Other Factors
In addition to the improving economy, participation rate trends, and the return of the three-month time limit, some other factors can affect caseload trends at the state level, sometimes temporarily:
- Administrative glitches. In addition to state policies changing participation rates and affecting eligibility for some groups, some states that have had especially large caseload declines have experienced delays in processing SNAP applications and other administrative problems, such as technical difficulties following the implementation of a new automated eligibility system. For example, Rhode Island and the District of Columbia have recently faced challenges after implementing new eligibility determination systems.[37] Difficulty in obtaining SNAP benefits may suppress participation in some places and may explain subsequent increases in participation once these problems have been resolved.
- Medicaid expansion. In states that expanded Medicaid for low-income adults in recent years, some individuals may have become familiar with SNAP when applying for Medicaid, after becoming newly eligible for that program. (Due to similarities in eligibility, most states have integrated the application and other processes for these two programs, often allowing applicants to jointly apply to both.) For example, a recent study found that states that expanded Medicaid and conducted outreach had higher rates of participation among eligible SNAP and WIC participants than states that did not expand or conduct outreach, and this gap widened following expansion.[38]
-
Chill from immigration-related policies. News reports indicate that some eligible people may be forgoing benefits such as SNAP due to immigration-related fears, stemming from immigration enforcement actions and a proposed rule that would put some immigrants at risk of being denied a green card if they receive certain government benefits such as SNAP or are judged likely to receive these benefits in the future.[39] A recent analysis of survey data by researchers at the Urban Institute found that about 1 in 7 adults in immigrant families reported that they or someone in their family did not apply for or stopped participating in non-cash public benefits in 2018 due to immigration-related concerns. About half reported that SNAP was one of the programs they avoided.[40]
This immigration policy may dampen participation by creating confusion and sowing fear of accessing benefits in immigrant communities, potentially discouraging even those with minimal risk that they would be harmed by the change in immigration policy. Immigration rules are often complex and confusing, and the consequences of running afoul of such rules so dire, that families choose to forgo benefits rather than risk jeopardizing their immigration status. Research has shown that fear of consequences from increased immigration enforcement is linked to decreased SNAP participation among eligible participants.[41]
While it is not yet clear to what extent this has so far been a factor in SNAP caseload trends, it is plausible that participation among eligible immigrant and mixed-status households could be depressed in areas with a large immigrant population. If eligible immigrants and their family members, including U.S. citizen children, are forgoing SNAP benefits, this could have troubling consequences for their health and well-being.[42]
Looking Ahead
To the extent that recent and future SNAP caseload declines reflect improving economic circumstances among low-income households, they are welcome. However, the decline following the implementation of the time limit is troublesome, as past experience shows that individuals who lose benefits often face hardship such as poverty and trouble affording food, housing, and other basic needs.[43]
Another key issue is whether states will maintain their progress in reaching eligible households. As noted, SNAP caseloads grew during the recession both because more people qualified for help (due to the weak economy) and because a larger share of eligible people applied for and received benefits.
Some states have proposed administrative and legislative changes that could deter eligible individuals from participating or increase the burden required to participate. Some state governors have already implemented them. Such policies include those that: require participants to report changes in household income or other circumstances more frequently or require excessive verification of participants’ information; take away benefits from individuals, including the recently unemployed and those with children, who are unable to document 20 hours or more per week of work (in addition to the time limit); or disqualify participants who don’t comply with child support requirements. Some of these policies may themselves reduce the number of people eligible for SNAP or increase the number who are sanctioned for non-compliance, but they also may increase the stigma associated with participating in SNAP and reduce the likelihood that eligible people apply.
To the extent that administrative barriers are a factor in recent SNAP caseload declines, state and federal policymakers should address the problems. States have made significant gains in lowering barriers to SNAP for eligible individuals and should assess whether some eligible individuals continue to face barriers to applying for and receiving SNAP.
| Appendix: SNAP Caseload Changes by State, Fiscal Year 2013 to Fiscal Year 2018 | ||||||
|---|---|---|---|---|---|---|
| Average Monthly SNAP Participants, 2013 (thousands) | Average Monthly SNAP Participants, 2018 (thousands) | Percentage Change in Number of Average Monthly Participants, 2013-2018 | Average Monthly Participants as Share of Population, 2013 | Average Monthly Participants as Share of Population, 2018 | Percentage Change in Average Monthly Participants as Share of Population, 2013-2018 | |
| Alabama | 915 | 767 | -16.2% | 19.0% | 15.7% | -17.2% |
| Alaska | 91 | 92 | 0.7% | 12.4% | 12.5% | 0.2% |
| Arizona | 1,111 | 846 | -23.9% | 16.8% | 11.9% | -29.4% |
| Arkansas | 505 | 372 | -26.2% | 17.1% | 12.4% | -27.5% |
| California | 4,159 | 3,950 | -5.0% | 10.9% | 10.0% | -8.2% |
| Colorado | 508 | 450 | -11.4% | 9.7% | 7.9% | -18.0% |
| Connecticut | 425 | 387 | -8.9% | 11.8% | 10.8% | -8.4% |
| Delaware | 153 | 140 | -8.4% | 16.6% | 14.6% | -12.5% |
| District of Columbia | 145 | 111 | -23.2% | 22.4% | 15.9% | -29.2% |
| Florida | 3,556 | 3,018 | -15.1% | 18.2% | 14.2% | -22.1% |
| Georgia | 1,948 | 1,539 | -21.0% | 19.6% | 14.7% | -25.0% |
| Hawaii | 189 | 164 | -13.6% | 13.5% | 11.5% | -14.7% |
| Idaho | 227 | 158 | -30.5% | 14.1% | 9.1% | -35.9% |
| Illinois | 2,040 | 1,826 | -10.5% | 15.8% | 14.3% | -9.5% |
| Indiana | 926 | 617 | -33.4% | 14.1% | 9.2% | -34.6% |
| Iowa | 420 | 345 | -17.8% | 13.6% | 11.0% | -19.5% |
| Kansas | 317 | 217 | -31.4% | 11.0% | 7.5% | -31.9% |
| Kentucky | 872 | 610 | -30.0% | 19.8% | 13.7% | -31.1% |
| Louisiana | 940 | 867 | -7.7% | 20.4% | 18.6% | -8.7% |
| Maine | 249 | 168 | -32.6% | 18.8% | 12.5% | -33.1% |
| Maryland | 771 | 646 | -16.2% | 13.0% | 10.7% | -17.9% |
| Massachusetts | 888 | 771 | -13.2% | 13.2% | 11.2% | -15.6% |
| Michigan | 1,776 | 1,282 | -27.8% | 17.9% | 12.8% | -28.4% |
| Minnesota | 553 | 429 | -22.4% | 10.2% | 7.7% | -25.1% |
| Mississippi | 669 | 505 | -24.4% | 22.4% | 16.9% | -24.4% |
| Missouri | 930 | 737 | -20.8% | 15.4% | 12.0% | -21.9% |
| Montana | 129 | 115 | -10.4% | 12.7% | 10.9% | -14.5% |
| Nebraska | 180 | 170 | -5.5% | 9.7% | 8.8% | -8.6% |
| Nevada | 361 | 440 | 21.9% | 13.0% | 14.6% | 11.9% |
| New Hampshire | 117 | 87 | -26.3% | 8.8% | 6.4% | -27.8% |
| New Jersey | 876 | 760 | -13.2% | 9.9% | 8.5% | -13.7% |
| New Mexico | 440 | 456 | 3.6% | 21.1% | 21.8% | 3.4% |
| New York | 3,170 | 2,797 | -11.8% | 16.2% | 14.3% | -11.6% |
| North Carolina | 1,704 | 1,363 | -20.0% | 17.4% | 13.2% | -24.1% |
| North Dakota | 57 | 53 | -6.9% | 7.9% | 6.9% | -12.2% |
| Ohio | 1,825 | 1,421 | -22.1% | 15.8% | 12.2% | -22.9% |
| Oklahoma | 622 | 585 | -5.9% | 16.2% | 14.8% | -8.2% |
| Oregon | 818 | 634 | -22.5% | 20.9% | 15.2% | -27.3% |
| Pennsylvania | 1,785 | 1,819 | 1.9% | 14.0% | 14.2% | 1.7% |
| Rhode Island | NA | NA | NA | NA | NA | NA |
| South Carolina | 876 | 658 | -24.9% | 18.4% | 13.0% | -29.5% |
| South Dakota | 104 | 87 | -16.0% | 12.4% | 9.9% | -19.8% |
| Tennessee | 1,342 | 971 | -27.7% | 20.7% | 14.4% | -30.6% |
| Texas | 4,042 | 3,666 | -9.3% | 15.3% | 12.8% | -16.5% |
| Utah | 252 | 189 | -24.9% | 8.7% | 6.0% | -31.0% |
| Vermont | 101 | 73 | -27.3% | 16.1% | 11.7% | -27.3% |
| Virginia | 941 | 736 | -21.8% | 11.4% | 8.7% | -24.2% |
| Washington | 1,113 | 877 | -21.2% | 16.0% | 11.7% | -27.1% |
| West Virginia | 351 | 321 | -8.5% | 18.9% | 17.7% | -6.2% |
| Wisconsin | 857 | 653 | -23.8% | 14.9% | 11.2% | -24.8% |
| Wyoming | 38 | 29 | -22.9% | 6.6% | 5.1% | -22.6% |
| Guam | 46 | 45 | -1.3% | 27.6% | 26.8% | -2.8% |
| Virgin Islands | 27 | 28 | 3.6% | 25.4% | 26.6% | 4.6% |
| United States plus Guam and Virgin Islands | 47,456 | 40,049 | -15.6% | 15.0% | 12.3% | -18.5% |
End Notes
[1] Unless otherwise noted, all years presented here are fiscal years and participation figures are for an average month.
[2] These figures refer to nominal spending, not adjusted for inflation. The 2018 figures on SNAP participation and spending exclude additional SNAP spending in areas affected by natural disasters and make several other technical adjustments to accurately represent the trends in regular SNAP participation and spending. See box, “2018 Figures Adjusted to Better Reflect Trends in the ‘Regular’ SNAP Program.”
[3] The remainder of this section analyzes the number of SNAP participants as a share of state population in order to more accurately represent SNAP caseload changes in the states where population is growing or shrinking substantially.
[4] There are 53 “states” in SNAP because the District of Columbia, Guam, and the Virgin Islands operate SNAP programs. (Puerto Rico receives a nutrition block grant and is not included in these figures.)
[5] In four states (Arkansas, Indiana, Kentucky, and North Dakota), the share of the population participating in SNAP in fiscal year 2018 was the same or below the share participating in 2007. In six more states (District of Columbia, Maine, Michigan, Missouri, South Carolina, and Tennessee), the share was less than 10 percent above its 2007 level.
[6] Riley Snyder, “Despite booming economy, Nevada food stamp enrollment remains high,” Nevada Independent, July 8, 2018, https://thenevadaindependent.com/article/despite-booming-economy-nevada-food-stamp-enrollment-remains-high/.
[7] For more detail on the relationship between the economy and SNAP caseloads, see Dorothy Rosenbaum and Brynne Keith-Jennings, “SNAP Costs and Caseloads Declining,” Center on Budget and Policy Priorities, March 8, 2016, https://www.cbpp.org/research/food-assistance/snap-costs-and-caseloads-declining.
[8] Congressional Budget Office, “The Supplemental Nutrition Assistance Program,” April 2012.
[9] Kelsey Farson Gray and Karen Cunnyngham, “Trends in Supplemental Nutrition Assistance Program Participation Rates: Fiscal Years 2010 to 2016,” USDA, July 2018, table H.1. The estimated participation rates are not directly comparable between 2007 and 2013 because of revisions to the methodology. The participation rate dropped slightly (to 83 percent) in 2014 and 2015, but returned to 85 percent in 2016, the most recent year for which USDA estimates are available.
[10] Both Mark Zandi of Moody’s Analytics and CBO have listed SNAP as one of the most effective policies to increase economic growth and employment in a weak economy. CBO has generally ranked transfer payments to individuals, including SNAP, as having one of the top stimulus multipliers as well. See, for example, CBO, “Estimated Impact of the American Recovery and Reinvestment Act on Employment and Economic Output in 2013,” February 2014, http://www.cbo.gov/sites/default/files/cbofiles/attachments/45122-ARRA.pdf. Zandi has consistently ranked SNAP as having one of the top fiscal stimulus multipliers (see, for example, Alan S. Binder and Mark Zandi, “The Financial Crisis: Lessons for the Next One,” Center on Budget and Policy Priorities, October 15, 2015, https://www.cbpp.org/research/economy/the-financial-crisis-lessons-for-the-next-one).
[11] Stacy Dean and Dorothy Rosenbaum, “SNAP Benefits Will Be Cut for Nearly All Participants in November 2013,” Center on Budget and Policy Priorities, August 2, 2013, https://www.cbpp.org/cms/?fa=view&id=3899; and Brynne Keith-Jennings and Dorothy Rosenbaum, “SNAP Benefit Boost in 2009 Recovery Act Provided Economic Stimulus and Reduced Hardship,” Center on Budget and Policy Priorities, March 31, 2015, https://www.cbpp.org/research/food-assistance/snap-benefit-boost-in-2009-recovery-act-provided-economic-stimulus-and. Also see Congressional Budget Office, “A Review of CBO’s Estimate of the Effects of the Recovery Act on SNAP,” December 20, 2018, https://www.cbo.gov/publication/54864.
[12] As discussed in the box, “2018 Figures Adjusted to Better Reflect Trends in the ‘Regular’ SNAP Program,” to better reflect the most recent trends, the figures in the text take out Rhode Island for each year, use state-reported data for North Carolina beginning in May 2017 due to data-reporting issues, and take out months when participation was elevated due to disasters in Texas and Florida in 2017 and 2018. Without adjusting for disasters, participation in 2017 fell by 4.3 percent compared to 2016, and fell by 3.7 percent in 2018. Figure 3 uses the USDA data without adjustments because we were not able to adjust all prior years’ data.
[13] This figure also includes the CBPP adjustments described in the box, “2018 Figures Adjusted to Better Reflect Trends in the ‘Regular’ SNAP Program.”
[14] In California SSI recipients have been ineligible under a state option known as “SSI cash-out.” The amount of SNAP benefits SSI recipients otherwise would have received was expected to be small because of the state’s (at the time) relatively high state-funded SSI supplement, and so was conceptually included in the state’s SSI supplement. Last summer California passed legislation to opt out of “SSI cash-out” and once again make SSI recipients eligible for SNAP. The change, which was fully within the state’s discretion, took effect this June. The legislation includes a state-funded program for holding harmless the subset of households newly ineligible under federal rules. A short summary of the SSI cash-out issue and the state’s estimates can be found here: https://lao.ca.gov/reports/2018/3729/ssi-cash-out-010818.pdf. The state has information about the expansion here: https://www.cdss.ca.gov/inforesources/CalFresh/Supplemental-Security-Income.
[15] Congressional Budget Office, “Supplemental Nutrition Assistance Program ― CBO’s May 2019 Baseline,” https://www.cbo.gov/system/files?file=2019-05/51312-2019-05-snap.pdf.
[16] Peter Ganong and Jeffrey B. Liebman, “The Decline, Rebound, and Further Rise in SNAP Enrollment: Disentangling Business Cycle Fluctuations and Policy Changes,” American Economic Journal: Economic Policy, Vol. 10, No. 4, November 2018, pp.153-176, https://www.aeaweb.org/articles?id=10.1257/pol.20140016&&from=f; James P. Ziliak, “Why Are So Many Americans on Food Stamps?” in J. Bartfeld et al., eds., SNAP Matters: How Food Stamps Affect Health and Well Being, Stanford University Press, 2015; Marianne Bitler and Hilary Hoynes, “The More Things Change, the More They Stay the Same? The Safety Net and Poverty in the Great Recession,” Journal of Labor Economics, Vol. 34, Issue S1, 2016; and Jacob Alex Klerman and Caroline Danielson, “Can the Economy Explain the Explosion in the Supplemental Nutrition Assistance Program? An Assessment of the Local-level Approach,” American Journal of Agricultural Economics, 2016.
[17] Klerman and Danielson.
[18] The figures in this paragraph are for calendar years rather than fiscal years.
[19] Brynne Keith-Jennings, “Millions Still Struggling to Afford Food,” Center on Budget and Policy Priorities, September 5, 2018, https://www.cbpp.org/blog/millions-still-struggling-to-afford-food. Food insecurity figures are for calendar years rather than fiscal years.
[20] Farson Gray and Cunnyngham. Note that this estimation excludes certain people whose eligibility changed during this period, namely those made eligible through the state option of categorical eligibility.
[21] For an overview of some of the ways states are using technology to improve operations in SNAP and other programs, see Sonal Ambegaokar, Rachel Podesfinski, and Jennifer Wagner, “Improving Customer Service in Health and Human Services Through Technology,” Center on Budget and Policy Priorities, August 23, 2018, https://www.cbpp.org/research/health/improving-customer-service-in-health-and-human-services-through-technology.
[22] Karen Cunnyngham, “Reaching Those in Need: Estimates of State Supplemental Nutrition Assistance Program Participation Rates in 2016,” U.S. Department of Agriculture, Food and Nutrition Service, March 2019.
[23] For example, one recent study found that state policies influenced about one-quarter of the caseload increase between 2000 and 2011. See Stacy Dickert-Conlin et al., “The Downs and Ups of the SNAP Caseload: What Matters?” SSRN, December 1, 2016, https://papers.ssrn.com/sol3/papers.cfm?abstract_id=3052570. Another, which compared the caseload growth between Oregon and Florida before and during the Great Recession, found that participants in Oregon, which has a more robust outreach program and longer certification periods, were more likely to participate before the recession, and were less likely to exit, than participants in Florida — differences that could not be explained by economic or demographic trends. See Mark Edwards et al., “The Great Recession and SNAP Caseloads: A Tale of Two States,” Journal of Poverty, Volume 20, Issue 3, 2016, https://www.tandfonline.com/doi/abs/10.1080/10875549.2015.1094770. Another study found that the experience in Michigan of letting clients review information and submit paperwork online reduced the probability that eligible clients would exit the program by about 10 percent. Colin Gray, “Why Leave Benefits on the Table? Evidence from SNAP,” Upjohn Institute Working Paper 18-288, 2018, https://research.upjohn.org/cgi/viewcontent.cgi?referer=&httpsredir=1&article=1306&context=up_workingpapers.
[24] Alicia Mazzara, “Gap Between Federal Rental Assistance and Need Is Growing,” Center on Budget and Policy Priorities, August 16, 2017, https://www.cbpp.org/blog/gap-between-federal-rental-assistance-and-need-is-growing. All figures in this paragraph are for calendar years rather than fiscal years.
[25] Alicia Mazzara, “Census: Renters’ Incomes Still Lagging Behind Housing Costs,” Center on Budget and Policy Priorities, September 13, 2018, https://www.cbpp.org/blog/census-renters-incomes-still-lagging-behind-housing-costs.
[26] “The State of the Nation’s Housing, 2018,” Joint Center for Housing Studies of Harvard University, 2018, https://www.jchs.harvard.edu/sites/default/files/Harvard_JCHS_State_of_the_Nations_Housing_2018.pdf
[27] Brynne Keith-Jennings and Raheem Chaudhry, “Most Working-Age SNAP Participants Work, But Often in Unstable Jobs,” Center on Budget and Policy Priorities, March 15, 2018, https://www.cbpp.org/research/food-assistance/most-working-age-snap-participants-work-but-often-in-unstable-jobs.
[28] For more information on this harsh time limit and waivers, see Ed Bolen and Stacy Dean, “Waivers Add Key State Flexibility to SNAP’s Three-Month Time Limit,” Center on Budget and Policy Priorities, February 6, 2018, https://www.cbpp.org/research/food-assistance/waivers-add-key-state-flexibility-to-snaps-three-month-time-limit, and other papers available at https://www.cbpp.org/resources-on-snap-and-work#timelimit.
[29] Some 21 states never waived the time limit statewide or implemented in the years prior to 2016. One additional state, Michigan, newly implemented the time limit in some areas in 2017 after having a statewide waiver, and two more states, Illinois and Rhode Island, implemented the time limit in parts of their states in 2018. California also began implementing the time limit in parts of the state beginning in September 2018. See Bolen and Dean.
[30] Some of this decline may also be attributed to other factors besides the time limit, such as improving economic conditions, administrative access issues, or the effects of sanctions in states that mandate employment and training for some populations. In states that continued to waive the time limit statewide in 2016, the number of such adults fell by about 16 percent in this period. In states that had implemented the time limit prior to 2016, the number fell by 17 percent. Because more individuals participate over the course of the year than in an average month, the actual number of people who lost benefits is larger. Some of the non-disabled childless adults we identify as “potentially subject to the time limit” may not be subject to the time limit because they live in an area with a waiver or are exempt due to factors that the data do not allow us to identify. Others may be subject to the time limit and are working or participating during their first three months.
[31] Steven Carlson, Dorothy Rosenbaum, and Brynne Keith-Jennings, “Who Are the Low-Income Childless Adults Facing the Loss of SNAP in 2016?” Center on Budget and Policy Priorities, February 8, 2016, https://www.cbpp.org/research/food-assistance/who-are-the-low-income-childless-adults-facing-the-loss-of-snap-in-2016.
[32] For more on the work incentive feature of categorical eligibility, see Elizabeth Wolkomir and Lexin Cai, “The Supplemental Nutrition Assistance Program Includes Earnings Incentive,” Center on Budget and Policy Priorities, March 6, 2018, https://www.cbpp.org/research/food-assistance/the-supplemental-nutrition-assistance-program-includes-earnings-incentives.
[33] “Broad-Based Categorical Eligibility,” U.S. Department of Agriculture, October 2018, https://fns-prod.azureedge.net/sites/default/files/snap/BBCE.pdf.
[34] CBO estimates that restricting categorical eligibility to households receiving cash assistance under Temporary Assistance for Needy Families — effectively ending broad-based categorical eligibility — would reduce SNAP spending on benefits by about 2 percent a year. The number of participants eligible because of categorical eligibility is based on the 2016 SNAP Household Characteristics data and earlier CBO estimates of the number of people who would be affected by eliminating this state option.
[35] For example, Ganong and Liebman found that this option accounted for about 8 percent of the increase between 2007 and 2011, and Dickert-Conlin et al., found that broad-based categorical eligibility “only explains up to 12 percent of the recent caseload increase.”
[36] Elizabeth Wolkomir, “How SNAP Can Better Serve the Formerly Incarcerated,” Center on Budget and Policy Priorities, March 16, 2018, https://www.cbpp.org/sites/default/files/atoms/files/3-6-18fa.pdf.
[37] Katherine Gregg, “Feds Again Threaten State About Funding Over Food Stamp Problems,” Providence Journal, April 18, 2017, http://www.providencejournal.com/news/20180418/feds-again-threaten-state-about-funding-over-food-stamp-problems; Ann E. Marimow, “Lawsuit alleges widespread problems in District-run food stamp program, Washington Post, August 28, 2017, https://www.washingtonpost.com/local/public-safety/widespread-problems-in-district-run-food-stamp-program-alleged-in-new-lawsuit/2017/08/28/d4cb6c9c-8bf5-11e7-84c0-02cc069f2c37_story.html?utm_term=.d8a19243ea0c.
[38] Bethany Lanese, Rebecca Fischbein, and Chelsea Furda, “Public Program Enrollment Following US State Medicaid Expansion and Outreach,” American Journal of Public Health, Vol. 108, No. 10. October 2018, pp. 1349-1351.
[39] Shelby Gonzales, “Fearing Immigration-Related Consequences, Many Families Forgo Basic Health and Nutrition Services,” Center on Budget and Policy Priorities, September 6, 2018, https://www.cbpp.org/blog/fearing-immigration-related-consequences-many-families-forgo-basic-health-and-nutrition; Danilo Trisi and Guillermo Herrera, “Administration Actions Against Immigrant Families Harming Children Through Increased Fear, Loss of Needed Assistance,” May 15, 2018, https://www.cbpp.org/research/poverty-and-inequality/administration-actions-against-immigrant-families-harming-children; Emily Baumgaertner, “Spooked by Trump Proposals, Immigrants Abandon Public Nutrition Services, New York Times, March 6, 2018, https://www.nytimes.com/2018/03/06/us/politics/trump-immigrants-public-nutrition-services.html.
[40] Hamutal Bernstein et al., “One in Seven Adults in Immigrant Families Reported Avoiding Public Benefit Programs in 2018,” Urban Institute, May 2019, https://www.urban.org/sites/default/files/publication/100270/one_in_seven_adults_in_immigrant_families_reported_avoiding_publi_2.pdf. This study drew from data from the Well-being and Basic Needs Survey that oversampled non-citizen respondents.
[41] Marcella Alsan and Crystal Yang, “Fear and the Safety Net: Evidence from Secure Communities,” National Bureau of Economic Research, Working Paper 24731, March 2019, http://www.nber.org/papers/w24731.pdf.
[42] Trisi and Herrera, op. cit.
[43] Carlson et al., 2016, op. cit.
More from the Authors

Areas of Expertise