BEYOND THE NUMBERS
6 Signs That the Labor Market Remains in Deep Trouble
Today’s jobs report shows a labor market that, despite improvements since April, remains devastated by the COVID-19 recession, as these six charts show. The crisis has imposed severe, ongoing hardship on tens of millions of people, disproportionately those in Black, Latino, Indigenous, and immigrant households. Yet policymakers let the CARES Act’s $600 weekly supplemental unemployment benefit expire July 31, and the supplemental benefit that the President imposed by executive order will provide less, and short-lived, relief. Without further federal action, jobless workers grappling with sharply reduced incomes will face growing challenges paying their bills.
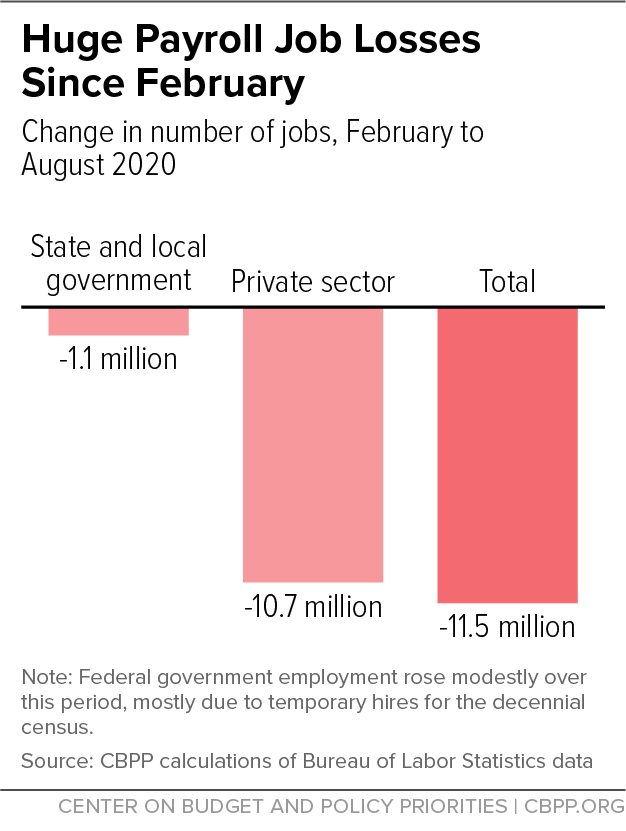
1. The jobs “hole” that opened in March and April remains huge.
Total (private plus government) nonfarm payroll employment fell by 22 million jobs in March and April, wiping out a decade of job growth. Despite job growth since then, including 1.0 million jobs in August, private payroll employment remains 10.7 million jobs below its February level. While the 238,000 temporary jobs that the federal Census created in August boosted federal government employment, state and local government payrolls remain 1.1 million jobs below their February level.
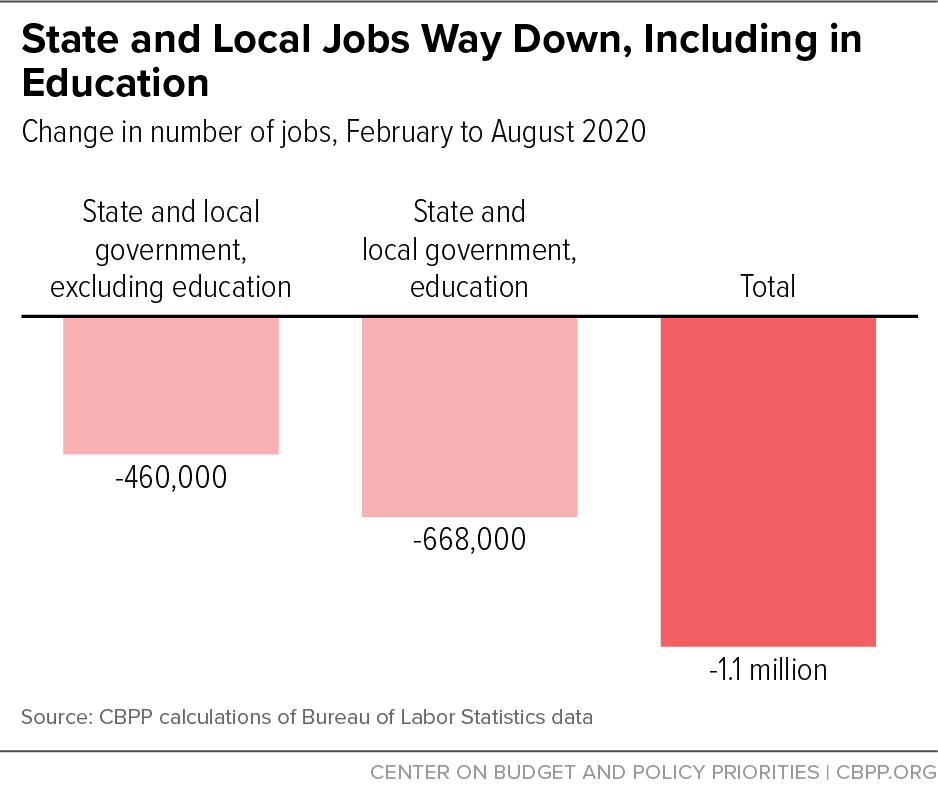
2. State and local job losses, many in education, remain large due to budget cuts.
State and local policymakers began slashing their workforces to help balance their budgets almost immediately after the pandemic began, when tax revenues plummeted as businesses shuttered and people lost their jobs. In April alone, more state and local workers were furloughed or laid off than in the Great Recession of a decade ago and its aftermath. Public employment has remained depressed in the months since.
Many job losses occurred in education, including teachers and support workers such as bus drivers, as well as college and university faculty and administrators. Of the 1.1 million state and local jobs lost from February to August, nearly two-thirds (668,000) were in K-12 schools or higher education.
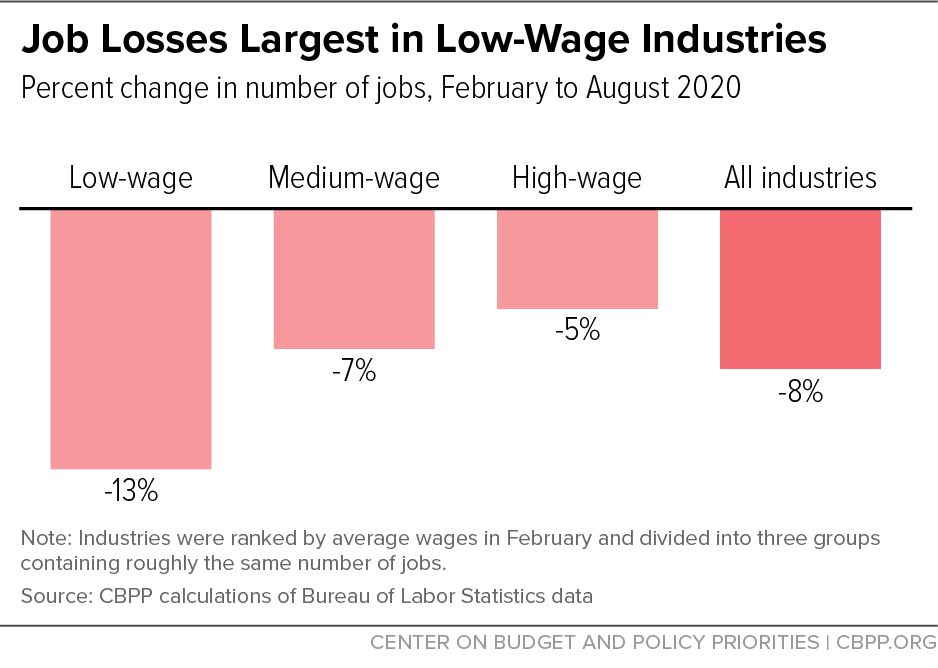
3. Most job losses have occurred in industries that pay low average wages, where a disproportionate number of workers are people of color.
A CBPP analysis that divided industries into three groups by average wages, with roughly the same number of jobs in each group as of February, found that the low-wage group accounted for 51 percent of the jobs lost from February to August. Jobs in the low-wage industries were down almost twice as much (12.9 percent) as jobs in medium-wage industries (7.4 percent) and almost three times as much as in high-wage industries (4.5 percent). The shares of Black, Latino, and immigrant workers in the lowest-wage group of industries exceed their shares of the overall population.
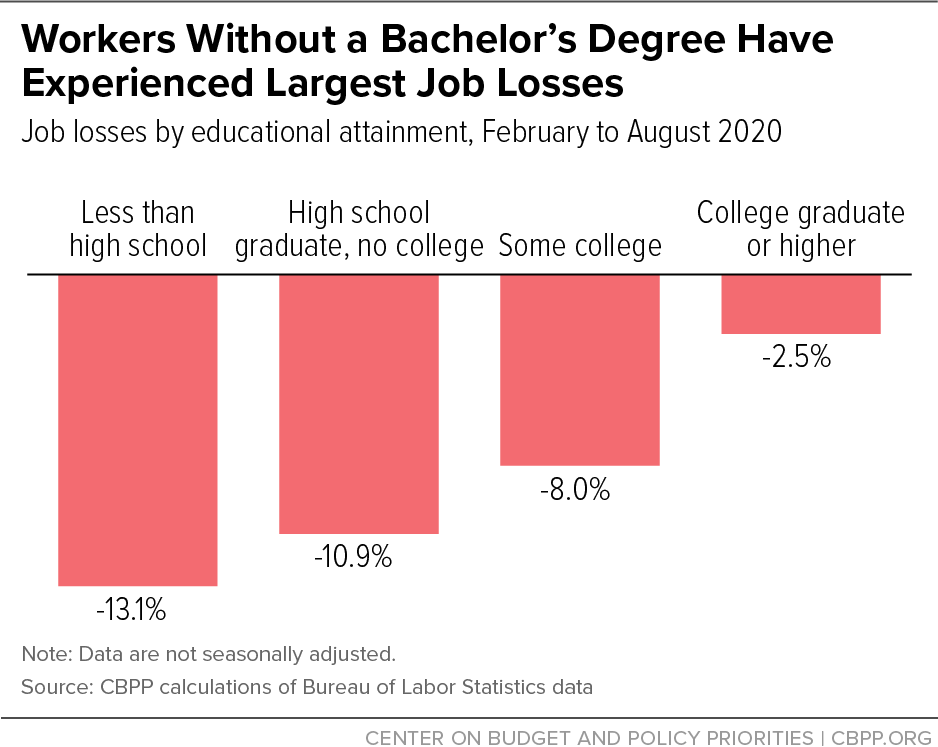
4. Workers without a bachelor’s degree have suffered the largest job losses.
The number of people aged 25 and over with a job fell by 6.7 percent between February and August, but there are stark differences by education level. The decline was 2.5 percent for those with a four-year college degree (about 43 percent of workers as of February), compared with 8.0 percent for the quarter of workers with a high school diploma and some college, 10.9 percent for the quarter of workers with a high school diploma but no college, and 13.1 percent for the 6 percent of workers with no high school diploma.
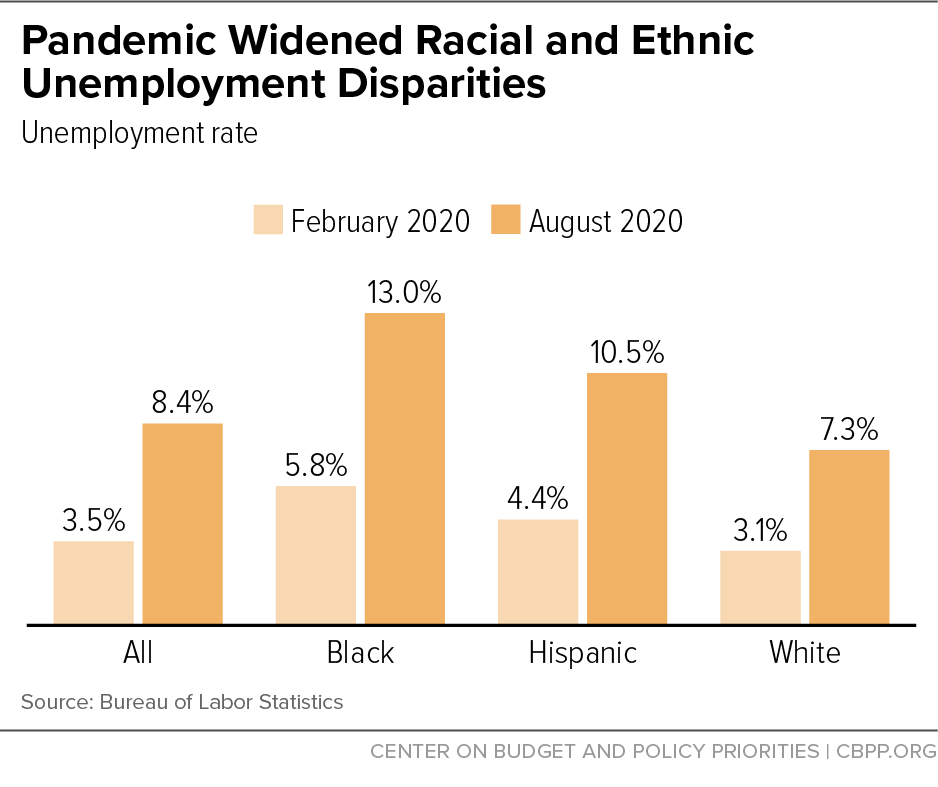
5. Unemployment was higher for Black and Hispanic workers than for white workers before the crisis hit and has risen more for them since then.
Although Black and Hispanic unemployment rates fell to historically low levels before the crisis, they exceeded the white rate even then. All rates rose sharply in the current recession and remained high in August, but both the August rate and the increase since February were larger for Black and Hispanic workers (7.2 and 6.1 percentage points, respectively) than for white workers (4.2 percentage points).
These patterns have endured in recessions and recoveries and are rooted in this nation’s history of structural racism, which curtails job opportunities for Black people through policies and practices such as unequal school funding, mass incarceration, and hiring discrimination. Black workers also tend to be “the last hired and first fired.” Higher Latino unemployment rates reflect many of the same barriers to opportunity.
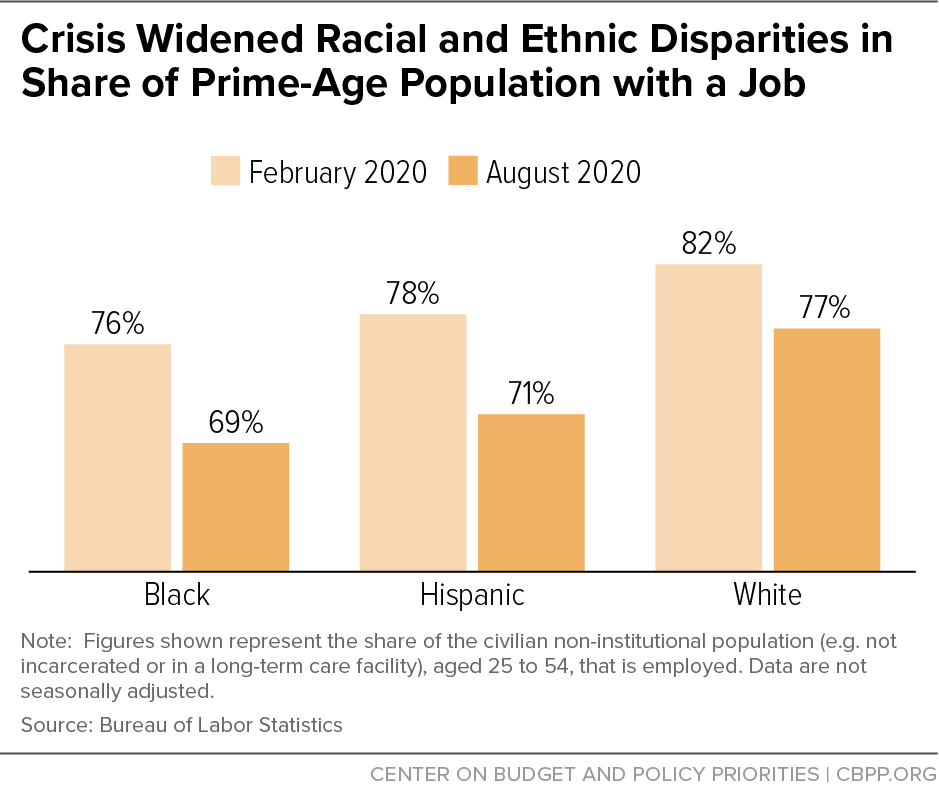
6. The crisis also widened racial and ethnic disparities in the share of prime-age workers with a job.
The unemployment rate is an incomplete measure of joblessness because it only includes people who are actively looking for work (or laid off but subject to recall to their former jobs). It doesn’t include people who want a job but haven’t been looking due to the lack of job opportunities.
The prime-age employment-to-population ratio, which measures the share of the population aged 25-54 with a job, doesn’t have that shortcoming. It was lower for Black and Hispanic workers than for white workers when the recession started and has fallen more for them since then: by 7 percentage points for Black and Hispanic workers versus 5 percentage points for white workers.
With COVID-19 still not under control and labor market conditions still poor, additional well-designed relief measures — including restoring a federal supplement to unemployment benefits to allow unemployed workers to support their families — are vital to relieving hardship and promoting a strong recovery.