TANF Cash Benefits Continued To Lose Value in 2013
Cash assistance benefits for the nation’s poorest families with children fell again in purchasing power in 2013 and are now at least 20 percent below their 1996 levels in 37 states, after adjusting for inflation. Seven states increased Temporary Assistance for Needy Families (TANF) grant amounts in 2013, with five of these based on annual adjustments. An additional state enacted a TANF benefit increase that will take effect next year. No state cut TANF benefit levels in nominal dollars this year. While several more states increased benefits this year than in the last few years, most kept family grant levels unchanged, allowing inflation to continue to erode the benefits’ value. With the country’s economic outlook looking somewhat more favorable in the coming year, states should halt the erosion of TANF benefits and slowly restore some of the purchasing power the grants have lost over the past 17 years.
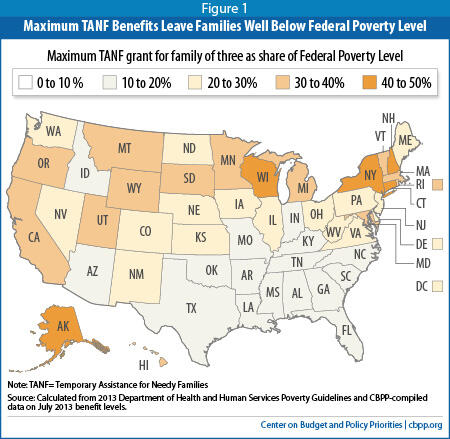
For 99 percent of TANF recipients, the purchasing power of TANF benefits is below 1996 levels, after adjusting for inflation. These declines came on top of even larger declines in benefits over the preceding quarter-century; between 1970 and 1996, cash assistance benefit levels for poor families with children fell by more than 40 percent in real terms in two-thirds of the states. As of July 1, 2013, every state’s benefits for a family of three with no other cash income were below 50 percent of the federal poverty line, measured by the Department of Health and Human Services 2013 poverty guidelines. Benefits were below 30 percent of the poverty line in most states. And, the TANF benefit level for a family of three with no other cash income is less than the Fair Market Rent for a two-bedroom apartment in every state, nationwide.[1] In fact, in 25 states, TANF benefits cover less than half of the Fair Market Rent. When SNAP benefits (the Supplemental Nutrition Assistance Program, formerly known as food stamps) are added to TANF family grants, families with no other income are still below the poverty line.
TANF provides a safety net to relatively few poor families: in 2012, just 25 families received TANF benefits for every 100 poor families, down from 68 families receiving TANF for every 100 in poverty in 1996. But for the families that participate in the program, it often is their only source of support, and without it, they would have no cash income to meet their basic needs.
This paper is an annual update of state TANF benefit levels as of July 1 each year (the beginning of the fiscal year for most states). This update covers the changes in TANF benefit levels between July 1, 2012 and July 1, 2013. The benefit levels cited here reflect the monthly benefits for a family of three with no other income as of July 1, 2013. However, while the family grants cited in this paper are among the highest a family can receive, they are not always the most typical grant families receive. TANF benefit levels in several states vary by geographic regions; in these states, families in some regions of the state receive lower benefits than the levels used in this analysis.[2]
| Table 1 States That Increased TANF Benefits (monthly benefit for a family of three) |
||
| State | July 2013 Benefits |
Increase since July 2012 |
| Connecticut | $688 | $14 |
| Maryland | $576 | $2 |
| Montana | $510 | $6 |
| New York | $789 | $19 |
| Ohio | $458 | $8 |
| Texas | $271 | $8 |
| Wyoming | $616 | $14 |
| Note: TANF = Temporary Assistance for Needy Families Source: CBPP-compiled 2013 state benefits |
||
A Few States Increased TANF Benefits in 2013
Between July 2012 and July 2013, no state cut benefit levels in nominal dollars. A few states increased benefits to follow through on past commitments to modestly raise benefits or adjust them for inflation. One state made legislative changes to improve benefit levels in the coming years.
Seven states increased benefit levels between July 2012 and July 1, 2013. (See Table 1 and Appendix 1.)
States with Annual Adjustments
- Effective July 2013, Connecticut increased its benefit level for a family of three from $674 to $688 based on an annual cost-of-living adjustment (COLA). The state’s COLA was enacted in 2007, but was suspended for the past four years.
- Maryland had a small benefit increase in October 2012 and will have a larger increase effective November 2013. Maryland increased the TANF benefit by $2 to $576 for a family of three on October 1, 2012. Effective November 1, 2013, Maryland’s benefit for a family of three will increase by $48 a month, to $624.[3]
- Ohio, which adjusts its TANF benefits annually in line with the Social Security COLA, raised its benefit for a family of three from $450 to $458, effective January 1, 2013.
- On October 1, 2012, Texas increased its benefit by $8 to $271. The Texas legislature generally adjusts its benefit level annually to maintain the average monthly TANF grant at 17 percent of the poverty line. Effective October 1, 2013, Texas’ benefit for a family of three increased by $6 to $277.
- Wyoming’s COLA, implemented in 2009, has enabled the state’s TANF benefit to keep pace with inflation since then. On July 1, 2013, Wyoming’s benefit for a family of three increased to $616.
Other Benefit Level Increases
- Montana made a one-time increase to its benefit from $504 to $510 for a family of three.Image
- Beginning in 2009, New York instituted three 10 percent annual increases to the basic allowance portion of its cash grants.[4] The final increase was originally slated to take place in 2011, but the governor postponed it. In 2012, the state implemented the delayed final increase in two separate steps, one in July and the other in October. After the final step, New York’s benefit for a family of three increased from $770 to $789 on October 1, 2012.
Future Benefit Level Increases
Additionally, California policymakers approved two changes to their TANF benefit level policy, which will take effect in 2014. In March 2014, the state will increase the family grant from $638 to $670 for a family of three. The state will also reintroduce a COLA for the family grant in 2014. However, unlike the state’s prior annual COLA, which has not been in effect for the last several years, the new COLA adjustments will occur only if there are sufficient funds available in the newly-created Child Poverty Account.
Benefits Leave Families Far Below Poverty Line
TANF benefit levels are so low that they are not sufficient to provide family income above half of the poverty line in any state.[5] (See Figure 1 and Appendix 2.) In 1996, 16 states had cash grants below 30 percent of the poverty line; today, benefits for a family of three with no other cash income are below 30 percent of the poverty line in 32 states and the District of Columbia. In 16 of those states, monthly benefit levels are less than 20 percent of the poverty line — that is, less than $326 a month for a family of three.
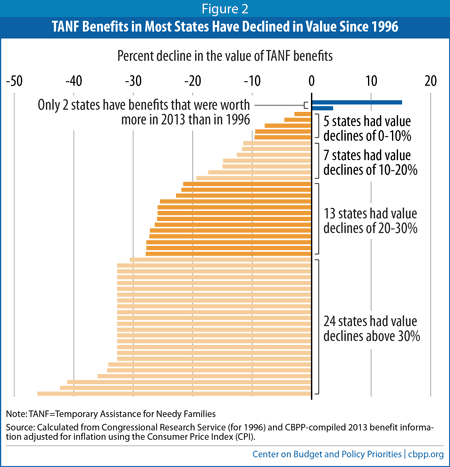
Because TANF benefits have declined substantially in value, they do much less to help families escape deep poverty than they did in 1996. With the exception of Maryland and Wyoming, a poor family relying solely on TANF to provide the basics for its children (such as during a period of joblessness, illness, or disability) in every state is further below the poverty line today than in 1996. (See Figure 2 and Appendices 2 and 3.) In many states, the decline in the value of benefits has been quite large:
- Since 1996, the value of cash assistance benefits has declined by 20 percent or more in 37 states.
- In the 17 states that have the same nominal benefit levels in July 2013 as in 1996, the benefits have declined in inflation-adjusted terms by more than 30 percent. Most of these states have not adjusted benefits since before welfare reform in 1996.
- In six states, TANF benefits are below their 1996 levels in nominal terms. Benefits in three of those states are worth at least 40 percent less than in 1996, when inflation is taken into account.
The decline in the value of benefits under TANF since 1996 follows a quarter century (prior to 1996) of major declines in the real value of benefits provided through Aid to Families With Dependent Children (AFDC; TANF replaced the program). Between 1970 and 1996, AFDC benefit levels fell by more than 20 percent, after adjusting for inflation, in all but one state and by more than 40 percent in two-thirds of the states.[6]
Supplemental Housing Benefits in TANF
States generally take housing needs in account in setting standardized TANF benefit level amounts (but these levels may represent only a fraction of the need). Some states do additional customization based on housing costs in determining a family’s benefit amount. For example, a few states recognize individual variations in housing costs and consider a family’s actual housing costs (up to a maximum) in setting benefit amounts. Some states provide lower standardized benefits to families whose housing costs are reduced because they receive subsidized or supplied housing or otherwise have no shelter costs. And, some states provide a supplemental housing benefit through TANF on top of the standard family grant for groups of families, such as those with high shelter cost or not receiving any housing subsidy.
Creating or increasing this type supplemental housing benefit can be an alternative to increasing the TANF benefit level. It may be possible to garner greater political support for increasing aid to families by making the case that TANF benefits are inadequate to house a family. And targeting the extra benefits to those families who are facing market rate housing may also be more acceptable than providing an across-the-board increase. Moreover, policymakers may be able to secure more funding to provide a housing supplement than they could for an increase in cash assistance. This year, two states added or expanded a supplemental housing benefit for TANF:
- Maine provides a housing supplement only to families not already receiving housing assistance; it does not vary by family size. The state legislature recently doubled the allotment, increasing it from $100 to $200 monthly. With this increase, Maine’s combined housing supplement and TANF benefit for a family of three (totaling $685) is still only 81 percent of Fair Market Rent (FMR) for a two-bedroom apartment.
- This year Minnesota’s legislature established a $110 per month housing assistance supplement set to begin July 2015. The supplement does not vary by family size. Child-only families (with no adult in the benefit unit) and families in subsidized or public housing are not eligible to receive the supplement.
These additional resources are critically important to helping families meet their basic needs. Supplemental assistance for housing does not, however, completely close the gap between benefits and Fair Market Rents.
Some families can combine TANF benefits with earned income to help meet basic needs; nearly all states have adopted “make work pay” policies under which TANF benefits phase out gradually as family earnings increase. But such families still become ineligible for TANF cash assistance at very low income levels in nearly all states. And, not all TANF families are able to supplement benefits with earnings; many families include parents with significant disabilities or other barriers to work, or who cannot find jobs in a labor market that remains weak.
TANF Benefits Alone Are Not Sufficient to Cover Housing Costs
TANF benefits cover only a fraction of a family’s housing costs, and housing is only one of the basic needs that a family must meet (although it is one of the largest). The monthly TANF benefit level for a family of three is now less than the estimated cost of a modest two-bedroom apartment (based on HUD Fair Market Rents, or FMRs) in all states, and less than half of the FMR in 28 states. (See Figure 3.) Some TANF families receive housing subsidies, but most do not. Only one in four eligible low-income households receives any federal housing assistance because of program funding limitations.[7] Many states provide small amounts of additional funds to help families cover housing costs, but this is often not enough to cover the large gap between TANF grants and FMR. (See box, “Supplemental Housing Benefits,” above.)
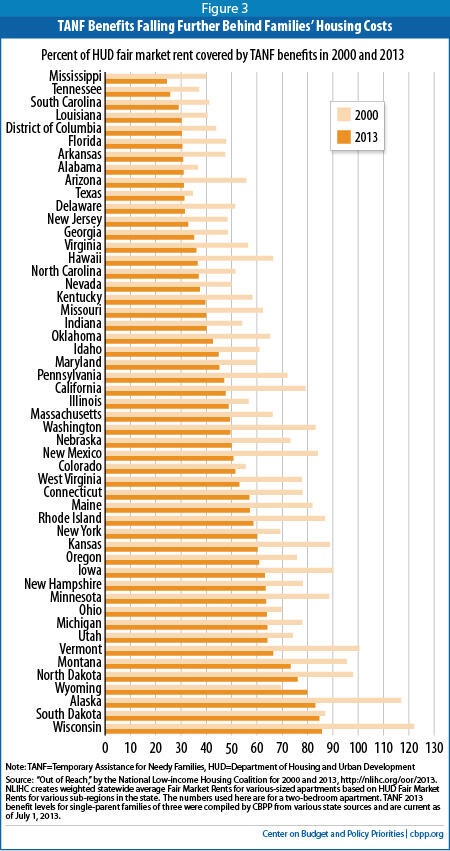
Between 2000 and 2013, the median Fair Market Rent in the 50 states and the District of Columbia increased from $580 to $795, while the median TANF benefit increased from $379 to just $428. (These figures are in nominal dollars — i.e., they are not adjusted for inflation.) As TANF benefits decline in real dollars in most states, they cover a smaller share of housing costs over time, as Figure 3 shows.
The share of the Fair Market Rent that TANF benefit levels cover has decreased quite sharply in some states. Vermont’s TANF benefit level, for example, equaled the FMR for a two-bedroom apartment in 2000 but covered only two-thirds of the FMR by 2013. (See Appendix 4.)
SNAP Benefits Help Fill the Gap, But a Substantial Shortfall Remains
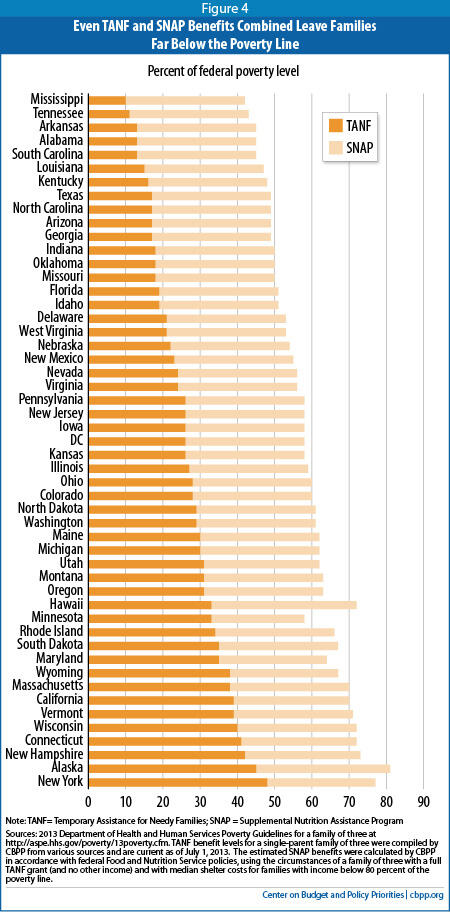
Unlike TANF, the Supplemental Nutrition Assistance Program (SNAP, formerly known as the Food Stamp Program) has provided a strong safety net for many unemployed families and individuals during the recession. TANF and SNAP benefits together do a better job of pulling families out of deep poverty than TANF alone. About 81 percent of TANF households consistently receive SNAP benefits.[8] In 2010, the average monthly SNAP benefit for households with TANF income was $427 a month.[9]
Nevertheless, families receiving both SNAP and TANF benefits still fall below 75 percent of the poverty line in 48 states and Washington, D.C. (See Figure 4.) In nearly all states, the gap between combined TANF and SNAP benefits and the poverty line is substantial.
Moreover, the current SNAP benefit levels reflect a temporary increase provided under the 2009 Recovery Act that is now phasing down and will end on October 31, 2013,[10] leaving TANF families that receive SNAP further below the poverty line. (In addition, to simplify the comparison, the SNAP benefit levels used for this comparison overstate the size of the SNAP benefit that many TANF families actually receive.[11])
After Years of Cuts and Stagnation, It’s Time to Raise TANF Benefits
This paper shows that it is increasingly difficult for TANF recipients to meet their basic needs, even when they also receive SNAP. The situation has worsened since TANF replaced AFDC. Though most states have increased TANF benefit levels (in nominal dollars) at least once since 1996, these small increases have been far from sufficient to keep up with inflation, and the benefits’ value has eroded. It is time for states to reconsider the value of their TANF benefits. A minority of states have begun to address the disparities between cash assistance and meeting a family’s basic needs through increasing benefit levels, instituting COLAs, and implementing and increasing housing supplements. But still more states should consider similar policy changes.
The Most Vulnerable Households Experienced Greatest Hardships in 2011
A recent report by the U.S. Census Bureau found that hardship among American households increased between 2005 and 2011. “The number of households with unmet essential expenses increased from 16.4 million to 20.0 million and the number of households experiencing food shortages rose from 2.7 million to 3.4 million. The number of households with unpaid rent or mortgage payments increased 2.7 million to 9.6 million,” the U.S. Census Bureau reported.a
While well-being declined for the country as a whole, households with the lowest incomes, the least amount of education, or with single parents caring for children often faced more hardship than households with higher incomes, more education, or married parents. In 2011, low-income households were more than twice as likely as middle- and high-income households to have had three or more instances of hardship. Those with less than a high school diploma were three times as likely as households with a bachelor’s degree or higher to have faced several episodes of hardship. Finally, households with a single parent raising children were more than twice as likely as households with married couples with children to have had multiple instances of hardship. Though the report does not specifically highlight TANF families, many households experiencing the greatest difficulty in meeting basic needs include TANF families.
a Julie Siebens, “Extended Measures of Well-Being: Living Conditions in the United States: 2011,” September 2013, U.S. Census Bureau. http://www.census.gov/newsroom/releases/archives/miscellaneous/cb13-160.html. The report defines hardship as having difficulty meeting essential expenses, not paying rent or mortgage, getting evicted, not paying utilities, having utilities cut off, having phone service cut, not seeing a doctor when needed, not seeing a dentist when needed, or not always having enough food.
Families receiving TANF have a limited period of time on benefits, and they must participate in work or work preparation activities (unless they qualify for a particular state exemption). During this time-limited, work-focused window, families should be able to meet their basic needs, allowing them to focus on finding work, increasing their skills, or both, so they are able to leave welfare. The chaos and instability that frequently result from the level of destitution that accompanies these low TANF benefit levels can interfere with these goals and undermine welfare reform.
While no state cut benefits between July 2012 and July 2013, few states raised them, restored recent reductions, or halted the declines in the benefits’ purchasing power. With state fiscal conditions beginning to improve, this is a good time for state policymakers to stem the decline and start to turn it around. States should consider taking two steps toward providing more adequate levels of basic assistance.
First, they should seek to restore at least part of the value of benefits that has been lost in recent years, even if that requires several incremental increases over a period of years. Second, they should put mechanisms in place to prevent the erosion from reoccurring.[12] Adjusting TANF benefits yearly in step with inflation can maintain these families’ purchasing power and help them meet their basic needs. Such COLAs will improve the lives of parents and children receiving TANF, while also helping struggling local communities as poor families quickly put that money into the local economy.
| Appendix 1 TANF Benefit Levels as of July 2013 (Single-Parent Family of Three) |
||||||||
| July 1996 | July 2000 | July 2005 | July 2010 | July 2011 | July 2012 | July 2013 | Change from 1996-2013 (in inflation-adjusted dollars) |
|
| Alabama | 164 | 164 | 215 | 215 | 215 | 215 | 215 | -11.7% |
| Alaska | 923 | 923 | 923 | 923 | 923 | 923 | 923 | -32.7% |
| Arizona | 347 | 347 | 347 | 278 | 278 | 278 | 278 | -46.1% |
| Arkansas | 204 | 204 | 204 | 204 | 204 | 204 | 204 | -32.7% |
| California | 596 | 626 | 723 | 694 | 638 | 638 | 638 | -27.9% |
| Colorado | 356 | 356 | 356 | 462 | 462 | 462 | 462 | -12.6% |
| Connecticut | 636 | 636 | 636 | 674 | 674 | 674 | 6881 | -27.2% |
| Delaware | 338 | 338 | 338 | 416 | 338 | 338 | 338 | -32.7% |
| D.C. | 415 | 379 | 379 | 428 | 428 | 428 | 428 | -30.6% |
| Florida | 303 | 303 | 303 | 303 | 303 | 303 | 303 | -32.7% |
| Georgia | 280 | 280 | 280 | 280 | 280 | 280 | 280 | -32.7% |
| Hawaii | 712 | 570 | 570 | 610 | 610 | 610 | 6102 | -42.3% |
| Idaho | 317 | 293 | 309 | 309 | 309 | 309 | 309 | -34.4% |
| Illinois | 377 | 377 | 396 | 432 | 432 | 432 | 4323 | -22.8% |
| Indiana | 288 | 288 | 288 | 288 | 288 | 288 | 288 | -32.7% |
| Iowa | 426 | 426 | 426 | 426 | 426 | 426 | 426 | -32.7% |
| Kansas | 429 | 429 | 429 | 429 | 429 | 429 | 429 | -32.7% |
| Kentucky | 262 | 262 | 262 | 262 | 262 | 262 | 262 | -32.7% |
| Louisiana | 190 | 190 | 240 | 240 | 240 | 240 | 240 | -14.9% |
| Maine | 418 | 461 | 485 | 485 | 485 | 485 | 485 | -21.9% |
| Maryland | 373 | 417 | 482 | 574 | 574 | 574 | 5764 | 4.0% |
| Massachusetts | 565 | 565 | 618 | 618 | 618 | 618 | 618 | -26.4% |
| Michigan | 459 | 459 | 459 | 492 | 492 | 492 | 492 | -27.8% |
| Minnesota | 532 | 532 | 532 | 532 | 532 | 532 | 532 | -32.7% |
| Mississippi | 120 | 170 | 170 | 170 | 170 | 170 | 170 | -4.6% |
| Missouri | 292 | 292 | 292 | 292 | 292 | 292 | 292 | -32.7% |
| Montana | 438 | 469 | 405 | 504 | 504 | 504 | 510 | -21.6% |
| Nebraska | 364 | 364 | 364 | 364 | 364 | 364 | 364 | -32.7% |
| Nevada | 348 | 348 | 348 | 383 | 383 | 383 | 383 | -25.9% |
| New Hampshire | 550 | 575 | 625 | 675 | 675 | 675 | 675 | -17.4% |
| New Jersey | 424 | 424 | 424 | 424 | 424 | 424 | 424 | -32.7% |
| New Mexico | 389 | 439 | 389 | 447 | 380 | 380 | 380 | -34.2% |
| New York | 577 | 577 | 691 | 753 | 753 | 770 | 7895 | -7.9% |
| North Carolina | 272 | 272 | 272 | 272 | 272 | 272 | 272 | -32.7% |
| North Dakota | 431 | 457 | 477 | 477 | 477 | 477 | 4776 | -25.5% |
| Ohio | 341 | 373 | 373 | 434 | 434 | 450 | 4587 | -9.6% |
| Oklahoma | 307 | 292 | 292 | 292 | 292 | 292 | 292 | -36.0% |
| Oregon | 460 | 460 | 460 | 485 | 506 | 506 | 506 | -25.9% |
| Pennsylvania | 421 | 421 | 421 | 421 | 421 | 421 | 4218 | -32.7% |
| Rhode Island | 554 | 554 | 554 | 554 | 554 | 554 | 554 | -32.7% |
| South Carolina | 200 | 204 | 205 | 270 | 216 | 216 | 216 | -24.9% |
| South Dakota | 430 | 430 | 501 | 555 | 555 | 565 | 565 | -11.5% |
| Tennessee | 185 | 185 | 185 | 185 | 185 | 185 | 185 | -32.7% |
| Texas | 188 | 201 | 223 | 260 | 260 | 263 | 2719 | -2.9% |
| Utah | 416 | 451 | 474 | 498 | 498 | 498 | 498 | -19.4% |
| Vermont | 597 | 622 | 640 | 640 | 640 | 640 | 64010 | -27.8% |
| Virginia | 354 | 354 | 389 | 389 | 389 | 389 | 38911 | -26.0% |
| Washington | 546 | 546 | 546 | 562 | 478 | 478 | 478 | -41.1% |
| West Virginia | 253 | 328 | 340 | 340 | 340 | 340 | 340 | -9.5% |
| Wisconsin | 517 | 673 | 673 | 673 | 673 | 653 | 65312 | -15.0% |
| Wyoming | 360 | 340 | 340 | 561 | 577 | 602 | 616 | 15.2% |
|
1 Connecticut's COLA has been suspended for the past four years because of budget constraints. The state finally adjusted benefits on July 1. The number listed is for Region A, which covers the highest cost area of the state. Most families of three in Connecticut receive a maximum benefit of $576 a month. |
||||||||
| Appendix 2 TANF Benefit Levels as a Percentage of the Federal Poverty Level |
||
| State | 1996 | 2013 |
| Alabama | 15.2% | 13.2% |
| Alaska | 68.3% | 45.4% |
| Arizona | 32.1% | 17.1% |
| Arkansas | 18.9% | 12.5% |
| California | 55.1% | 39.2% |
| Colorado | 32.9% | 28.4% |
| Connecticut | 58.8% | 42.3% |
| Delaware | 31.2% | 20.8% |
| D.C. | 38.4% | 26.3% |
| Florida | 28.0% | 18.6% |
| Georgia | 25.9% | 17.2% |
| Hawaii | 57.2% | 32.6% |
| Idaho | 29.3% | 19.0% |
| Illinois | 34.9% | 26.5% |
| Indiana | 26.6% | 17.7% |
| Iowa | 39.4% | 26.2% |
| Kansas | 39.7% | 26.4% |
| Kentucky | 24.2% | 16.1% |
| Louisiana | 17.6% | 14.7% |
| Maine | 38.6% | 29.8% |
| Maryland | 34.5% | 35.4% |
| Massachusetts | 52.2% | 38.0% |
| Michigan | 42.4% | 30.2% |
| Minnesota | 49.2% | 32.7% |
| Mississippi | 11.1% | 10.4% |
| Missouri | 27.0% | 17.9% |
| Montana | 40.5% | 31.3% |
| Nebraska | 33.7% | 22.4% |
| Nevada | 32.2% | 23.5% |
| New Hampshire | 50.8% | 41.5% |
| New Jersey | 39.2% | 26.1% |
| New Mexico | 36.0% | 23.3% |
| New York | 53.3% | 48.5% |
| North Carolina | 25.1% | 16.7% |
| North Dakota | 39.8% | 29.3% |
| Ohio | 31.5% | 28.1% |
| Oklahoma | 28.4% | 17.9% |
| Oregon | 42.5% | 31.1% |
| Pennsylvania | 38.9% | 25.9% |
| Rhode Island | 51.2% | 34.0% |
| South Carolina | 18.5% | 13.3% |
| South Dakota | 39.8% | 34.7% |
| Tennessee | 17.1% | 11.4% |
| Texas | 17.4% | 16.7% |
| Utah | 38.5% | 30.6% |
| Vermont | 58.5% | 39.3% |
| Virginia | 32.7% | 23.9% |
| Washington | 50.5% | 29.4% |
| West Virginia | 23.4% | 20.9% |
| Wisconsin | 47.8% | 40.1% |
| Wyoming | 33.3% | 37.8% |
| Note: TANF= Temporary Assistance for Needy Families Source: 2013 HHS Poverty Guidelines for a family of three at http://aspe.hhs.gov/poverty/13poverty.cfm. TANF benefit levels for a single-parent family of three were compiled by CBPP from various sources and are current as of July 1, 2013. |
||
| Appendix 3 Changes in Real (Inflation-Adjusted) Benefit Levels Comparing 2013 with 1996, 2000, 2005, and 2012 |
||||
| State | 1996-2013 | 2000-2013 | 2005-2013 | 2012-2013 |
| Alabama | -11.7% | -3.6% | -16.7% | -1.6% |
| Alaska | -32.7% | -26.5% | -16.7% | -1.6% |
| Arizona | -46.1% | -41.1% | -33.3% | -1.6% |
| Arkansas | -32.7% | -26.5% | -16.7% | -1.6% |
| California | -27.9% | -25.1% | -26.5% | -1.6% |
| Colorado | -12.6% | -4.6% | 8.1% | -1.6% |
| Connecticut | -27.2% | -20.5% | -9.9% | 0.4% |
| Delaware | -32.7% | -26.5% | -16.7% | -1.6% |
| D.C. | -30.6% | -17.0% | -6.0% | -1.6% |
| Florida | -32.7% | -26.5% | -16.7% | -1.6% |
| Georgia | -32.7% | -26.5% | -16.7% | -1.6% |
| Hawaii | -42.3% | -21.3% | -10.9% | -1.6% |
| Idaho | -34.4% | -22.5% | -16.7% | -1.6% |
| Illinois | -22.8% | -15.8% | -9.1% | -1.6% |
| Indiana | -32.7% | -26.5% | -16.7% | -1.6% |
| Iowa | -32.7% | -26.5% | -16.7% | -1.6% |
| Kansas | -32.7% | -26.5% | -16.7% | -1.6% |
| Kentucky | -32.7% | -26.5% | -16.7% | -1.6% |
| Louisiana | -14.9% | -7.1% | -16.7% | -1.6% |
| Maine | -21.9% | -22.7% | -16.7% | -1.6% |
| Maryland | 4.0% | 1.5% | -0.5% | -1.3% |
| Massachusetts | -26.4% | -19.6% | -16.7% | -1.6% |
| Michigan | -27.8% | -21.2% | -10.7% | -1.6% |
| Minnesota | -32.7% | -26.5% | -16.7% | -1.6% |
| Mississippi | -4.6% | -26.5% | -16.7% | -1.6% |
| Missouri | -32.7% | -26.5% | -16.7% | -1.6% |
| Montana | -21.6% | -20.1% | 4.9% | -0.5% |
| Nebraska | -32.7% | -26.5% | -16.7% | -1.6% |
| Nevada | -25.9% | -19.1% | -8.3% | -1.6% |
| New Hampshire | -17.4% | -13.7% | -10.1% | -1.6% |
| New Jersey | -32.7% | -26.5% | -16.7% | -1.6% |
| New Mexico | -34.2% | -36.4% | -18.6% | -1.6% |
| New York | -7.9% | 0.5% | -4.9% | 0.8% |
| North Carolina | -32.7% | -26.5% | -16.7% | -1.6% |
| North Dakota | -25.5% | -23.3% | -16.7% | -1.6% |
| Ohio | -9.6% | -9.7% | 2.3% | 0.1% |
| Oklahoma | -36.0% | -26.5% | -16.7% | -1.6% |
| Oregon | -25.9% | -19.1% | -8.4% | -1.6% |
| Pennsylvania | -32.7% | -26.5% | -16.7% | -1.6% |
| Rhode Island | -32.7% | -26.5% | -16.7% | -1.6% |
| South Carolina | -27.3% | -22.2% | -12.3% | -1.6% |
| South Dakota | -11.5% | -3.4% | -6.1% | -1.6% |
| Tennessee | -32.7% | -26.5% | -16.7% | -1.6% |
| Texas | -2.9% | -0.9% | 1.2% | 1.4% |
| Utah | -19.4% | -18.8% | -12.5% | -1.6% |
| Vermont | -27.8% | -24.4% | -16.7% | -1.6% |
| Virginia | -26.0% | -19.2% | -16.7% | -1.6% |
| Washington | -41.1% | -35.6% | -27.1% | -1.6% |
| West Virginia | -9.5% | -23.8% | -16.7% | -1.6% |
| Wisconsin | -15.0% | -28.7% | -19.2% | -1.6% |
| Wyoming | 15.2% | 33.2% | 50.9% | 0.6% |
| Note: TANF= Temporary Assistance for Needy Families Source: Calculated from figures in Appendix 1 adjusted for inflation using the Consumer Price Index (CPI) |
||||
| Appendix 4 TANF Benefit Levels as a Percentage of Fair Market Rents Comparing 2000 and 2013 |
||
| State | 2000 | 2013 |
| Alabama | 36.6% | 31.0% |
| Alaska | 117.0% | 83.1% |
| Arizona | 55.8% | 31.1% |
| Arkansas | 47.4% | 30.8% |
| California | 79.1% | 47.6% |
| Colorado | 55.5% | 51.5% |
| Connecticut | 78.0% | 57.0% |
| Delaware | 51.4% | 31.5% |
| D.C. | 43.9% | 30.3% |
| Florida | 47.8% | 30.5% |
| Georgia | 48.4% | 35.2% |
| Hawaii | 66.4% | 36.5% |
| Idaho | 60.9% | 44.8% |
| Illinois | 56.7% | 48.8% |
| Indiana | 54.1% | 40.1% |
| Iowa | 90.1% | 63.1% |
| Kansas | 88.8% | 60.3% |
| Kentucky | 58.2% | 39.6% |
| Louisiana | 40.5% | 30.2% |
| Maine | 81.9% | 57.2% |
| Maryland | 59.7% | 45.2% |
| Massachusetts | 66.2% | 49.4% |
| Michigan | 77.9% | 64.1% |
| Minnesota | 88.5% | 63.6% |
| Mississippi | 40.0% | 24.4% |
| Missouri | 62.3% | 39.9% |
| Montana | 95.5% | 73.3% |
| Nebraska | 73.2% | 50.0% |
| Nevada | 50.0% | 37.4% |
| New Hampshire | 78.1% | 63.4% |
| New Jersey | 48.3% | 32.8% |
| New Mexico | 84.1% | 50.7% |
| New York | 69.2% | 60.1% |
| North Carolina | 51.5% | 36.9% |
| North Dakota | 97.9% | 76.1% |
| Ohio | 69.7% | 63.9% |
| Oklahoma | 65.2% | 42.6% |
| Oregon | 75.8% | 60.8% |
| Pennsylvania | 72.0% | 47.0% |
| Rhode Island | 86.8% | 58.6% |
| South Carolina | 41.1% | 29.0% |
| South Dakota | 86.9% | 84.7% |
| Tennessee | 37.1% | 25.7% |
| Texas | 34.7% | 31.3% |
| Utah | 74.2% | 64.1% |
| Vermont | 100.5% | 66.4% |
| Virginia | 56.5% | 36.1% |
| Washington | 83.2% | 49.5% |
| West Virginia | 77.7% | 53.0% |
| Wisconsin | 122.1% | 85.6% |
| Wyoming | 69.4% | 79.8% |
| Note: TANF= Temporary Assistance for Needy Families Source: Out of Reach, by the National Low-income Housing Coalition for 2000 and 2013, http://nlihc.org/oor/2013. NLIHC creates weighted statewide average Fair Market Rents for various-sized apartments based on HUD Fair Market Rents for various sub-regions in the state. The numbers used here are for a two-bedroom apartment. TANF 2013 benefit levels for single-parent families of three were compiled by CBPP from various state sources and are current as of July 1, 2013. |
||
| Appendix 5 2013 TANF and SNAP Benefit Levels as a Percentage of the Federal Poverty Level |
||
| State | TANF as a Percent of FPL | SNAP + TANF as a Percent of FPL |
| Alabama | 13.2% | 45.5% |
| Alaska | 45.4% | 81.6% |
| Arizona | 17.1% | 49.4% |
| Arkansas | 12.5% | 44.9% |
| California | 39.2% | 70.4% |
| Colorado | 28.4% | 60.7% |
| Connecticut | 42.3% | 73.3% |
| Delaware | 20.8% | 53.1% |
| D.C. | 26.3% | 58.6% |
| Florida | 18.6% | 50.9% |
| Georgia | 17.2% | 49.5% |
| Hawaii | 32.6% | 71.6% |
| Idaho | 19.0% | 51.3% |
| Illinois | 26.5% | 58.9% |
| Indiana | 17.7% | 50.0% |
| Iowa | 26.2% | 58.5% |
| Kansas | 26.4% | 58.7% |
| Kentucky | 16.1% | 48.4% |
| Louisiana | 14.7% | 47.1% |
| Maine | 29.8% | 62.1% |
| Maryland | 35.3% | 64.9% |
| Massachusetts | 38.0% | 70.3% |
| Michigan | 30.2% | 62.5% |
| Minnesota | 32.7% | 57.9% |
| Mississippi | 10.4% | 42.8% |
| Missouri | 17.9% | 50.3% |
| Montana | 31.3% | 63.7% |
| Nebraska | 22.4% | 54.7% |
| Nevada | 23.5% | 55.9% |
| New Hampshire | 41.5% | 72.7% |
| New Jersey | 26.1% | 58.4% |
| New Mexico | 23.3% | 55.7% |
| New York | 48.5% | 77.6% |
| North Carolina | 16.7% | 49.0% |
| North Dakota | 29.3% | 61.6% |
| Ohio | 28.1% | 60.5% |
| Oklahoma | 17.9% | 50.3% |
| Oregon | 31.1% | 63.4% |
| Pennsylvania | 25.9% | 58.2% |
| Rhode Island | 34.0% | 66.4% |
| South Carolina | 13.7% | 45.6% |
| South Dakota | 34.7% | 67.0% |
| Tennessee | 11.4% | 43.7% |
| Texas | 16.7% | 49.0% |
| Utah | 30.6% | 61.8% |
| Vermont | 39.3% | 71.2% |
| Virginia | 23.9% | 55.5% |
| Washington | 29.4% | 61.7% |
| West Virginia | 20.9% | 53.2% |
| Wisconsin | 40.1% | 71.8% |
| Wyoming | 37.8% | 66.4% |
| Note: TANF= Temporary Assistance for Needy Families Sources: 2013 HHS Poverty Guidelines for a family of three at http://aspe.hhs.gov/poverty/13poverty.cfm. TANF benefit levels for a single-parent family of three were compiled by CBPP from various sources and are current as of July 1, 2013. The estimated SNAP benefits were calculated by CBPP in accordance with USDA Food and Nutrition Service policies using the circumstances of a family of three with a full TANF grant (and no other income) and with median shelter costs for families with income below 80 percent of the federal poverty level. |
||
End Notes
[1] The Fair Market Rent is the U.S. Department of Housing and Urban Development’s estimate of the amount needed to cover the rent and utility costs of a modest housing unit in a given local area.
[2] Please see the footnotes in table 1 of the appendix for states with regional variation in TANF benefits.
[3] Maryland’s TANF benefit is reconsidered each year under a state law that requires that the value of SNAP and TANF combined is at least 61 percent of the state’s minimum living standard. The October 2012 TANF increase was the first increase in four years because a boost in the value of SNAP benefits provided under the Recovery Act helped to meet this threshold; with the end of this SNAP boost in November 2013, there will be a significant TANF benefit increase to reach the 61 percent threshold.
[4] New York's benefit is made up of several components including a statewide monthly basic allowance (for recurring needs), a statewide home energy allowance, a statewide supplemental home energy allowance, and a variable portion for rent, which varies from $259-$447 depending on the county of residence. The 10 percent benefit increases were to the basic allowance portion and were not an overall 10 percent benefit increase.
[5] The 2013 HHS poverty guideline for a family of three is about $1,628 per month in the 48 contiguous states and D.C.; Alaska and Hawaii have higher poverty levels. (See http://aspe.hhs.gov/poverty/13poverty.cfm.) CBPP uses HHS’ poverty guidelines in this analysis because they are a simplification of the poverty thresholds (the Census Bureau’s measure of poverty) and because they are used to determine financial eligibility of certain programs.
[6] 1996 Green Book, U.S. House of Representatives Ways and Means Committee, Table 8-15, http://frwebgate.access.gpo.gov/cgi-bin/getdoc.cgi?dbname=104_green_book&docid=f:wm014_08.pdf.
[7] Worst Case Housing Needs 2009: A Report to Congress, U.S. Department of Housing and Urban Development Office of Policy Development and Research, February 2011.
[8] Temporary Assistance for Needy Families (TANF) Ninth Annual Report to Congress. U.S. Department of Health and Human Services, Office of Family Assistance, March 2012, http://www.acf.hhs.gov/sites/default/files/ofa/9th_report_to_congress_3_26_12.pdf.
[9] Characteristics of Supplemental Nutrition Assistance Program Households: Fiscal Year 2011, US Department of Agriculture Office of Research and Analysis, November 2012, http://www.fns.usda.gov/ORA/menu/Published/SNAP/FILES/Participation/2011Characteristics.pdf
[10] For more information see Stacy Dean and Dottie Rosenbaum, “SNAP Benefits Will Be Cut for All Participants in November 2013,” Center on Budget and Policy Priorities, August 3, 2013, https://www.cbpp.org/cms/index.cfm?fa=view&id=3899.
[11] For Figure 5, CBPP calculated typical SNAP benefits assuming that a family’s shelter costs are the same as the median shelter costs for families with incomes at or below 80 percent of the poverty line. A family’s SNAP benefit amount is calculated based on its income and deductions, with the capped deduction for high shelter costs playing a significant role. For over half of the states, the estimated SNAP benefit used in Figure 5 is the maximum monthly benefit for a family of three ($526). The SNAP benefit that an individual TANF family actually qualifies for, based on its particular circumstances, is often lower, however, than the estimate used here because many TANF households do not incur shelter expenses high enough to qualify them for the maximum SNAP benefit.
[12] See “State Cost-of-Living Adjustments for TANF Benefits” box in “The Value of TANF Cash Benefits Continued to Erode in 2012” at https://www.cbpp.org/sites/default/files/atoms/files/3-28-13tanf.pdf.
More from the Authors

Areas of Expertise