What to Look for in Next Week’s Census Figures on Poverty, Income, and Health Insurance
On September 12, the Census Bureau will release its official statistics on poverty, income, and health insurance coverage in 2016. Four points are worth noting in advance of the release.
1. Health Insurance Coverage Likely Remained Strong in 2016
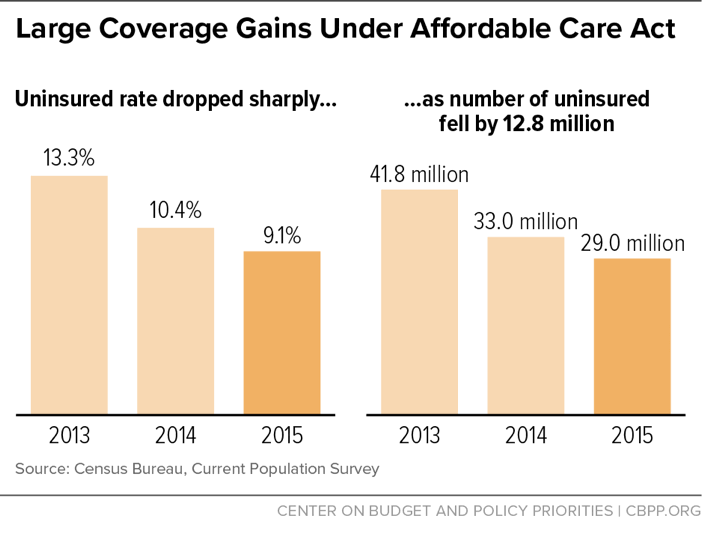
Census will issue national and state estimates of health insurance coverage for 2016, based on its Current Population Survey (CPS) and American Community Survey (ACS). Previous Census results showed historic coverage gains in 2014 and 2015, after the Affordable Care Act’s (ACA) major coverage expansions took full effect on January 1, 2014.[1] The share of Americans without health insurance dropped sharply from 13.3 percent in 2013 to 10.4 percent in 2014 and 9.1 percent in 2015 (see Figure 1), falling for virtually every demographic group the Census data cover, including by gender, income, employment status, and race/ethnicity.[2] Some 12.8 million fewer Americans were uninsured in 2015 than 2013.[3] (Comparisons with years before 2013 are hampered by technical changes in the CPS survey questions. But CPS and other survey data show substantial additional declines in uninsurance from 2010 to 2013, as earlier ACA provisions took hold. For example, data from the Centers for Disease Control and Prevention’s National Health Interview Survey show that the number of uninsured fell by 20 million from 2010 to 2015.[4])
Health coverage gains were greatest among the 28 states and the District of Columbia that extended Medicaid to low-income adults by 2015 under the ACA’s Medicaid expansion.[5] If the uninsured rate had fallen in non-expansion states at the same rate since 2013 as it did in expansion states, an additional 3.7 million uninsured Americans would have had coverage in 2015.
The 2016 data that Census will release on September 12 are expected to show that the uninsured rate remained stable, and at a historic low, last year. Data from the smaller, previously released National Health Interview Survey, which typically aligns with the Census Bureau data, found that health insurance coverage gains held steady in 2016.
This progress figured in the recent debates over legislation to repeal the ACA. Both the House-passed “repeal and replace” bill and bills developed in the Senate would have caused more than 20 million Americans to lose coverage, the Congressional Budget Office estimated. In addition, the Trump Administration has taken steps — and threatened to take others — that could jeopardize the stability of the health insurance marketplaces through which more than 10 million people receive coverage.
If policymakers focus on building on the ACA’s gains, the number of uninsured can shrink further. But if they continue seeking to undermine the law, this progress could be reversed in whole or in part.
2. Improvements in Poverty and Income Are Likely, Due to Economic Growth
Solid progress in employment and wages in 2016 makes it likely that poverty declined last year and median household income rose. In addition, 2016 followed a year of unusually strong improvement in poverty and median household income (in 2015), and several years of improvement on a range of labor-market indicators. For example, the period from 2011 to 2016 saw the strongest increase in employment rates for prime working-age adults (ages 25 to 54) of any five-year period in more than 25 years.
Improvements in the 2016 poverty and median income figures would strengthen the conclusion that recent years were a period of strong economic gains for lower- and middle-income households. For example, if median income — which rose by 5.2 percent in 2015 — rises by at least another 1.2 percent in 2016, the improvement over those two years combined will be the largest for any two-year period since the 1960s.
3. Official Poverty Data Can’t Be Used to Capture Long-Term Poverty Trends; “Anchored Supplemental Poverty Measure” Provides More Meaningful Trend Data
The official poverty measure is a revealing indicator of the state of the private economy for less-fortunate working-age adults and their families. But because it counts only cash incomes and omits the impact of key government income-assistance programs, the official poverty rate does not accurately portray the overall financial well-being of low-income Americans or how that has changed over time.
Some policymakers and pundits may be tempted to use the new poverty data to argue that federal anti-poverty programs have failed, contending that the official poverty rate has changed relatively little since the 1960s apart from fluctuations due to the business cycle. But comparing poverty rates between the 1960s and today using the official poverty measure yields highly misleading results and is shunned by most analysts as invalid for this reason. The official measure fails to count major non-cash and tax-based assistance that now accounts for the bulk of means-tested government assistance, including SNAP (formerly known as food stamps), the Earned Income Tax Credit (EITC), the refundable Child Tax Credit, and rental subsidies.
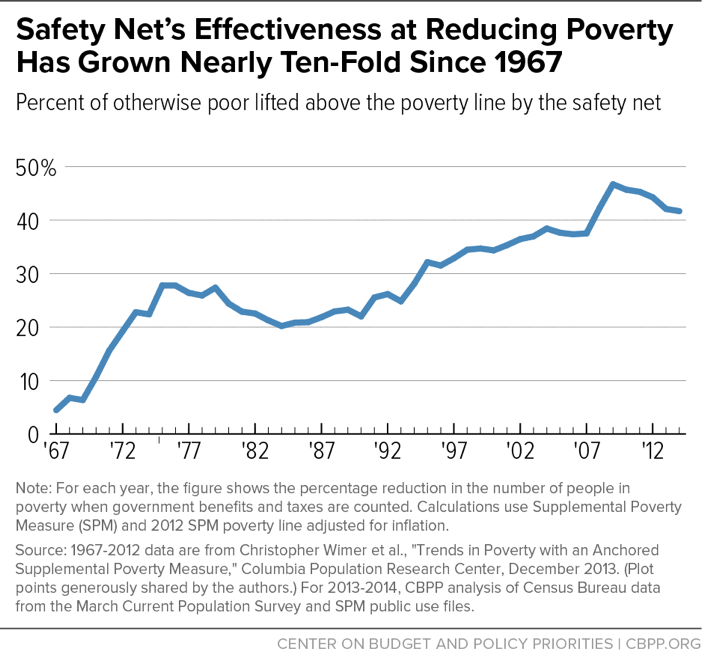
Fortunately, the Census Bureau also issues a second poverty measure, the Supplemental Poverty Measure (or SPM), which does count these benefits (and makes other improvements in poverty measurement, such as netting out income and payroll taxes). The Census’s SPM tables start in 2009, however, so they can’t by themselves answer longer-term questions, such as how much the level of poverty has changed since the 1960s or whether the poverty rate has returned to its level before the start of the Great Recession. But a set of historical SPM estimates that Columbia University researchers have produced, known as the “anchored SPM,” shows poverty trends and the impact of anti-poverty efforts over the long term.[6] These data show that government income-assistance and related programs lifted 4 percent of otherwise-poor individuals above the poverty line in 1967, but by 2014, this figure had climbed to 42 percent (according to a CBPP update of the Columbia University figures).[7] In other words, the safety net was nearly ten times more effective at reducing poverty in 2014 as in 1967. (See Figure 2.) Government programs lifted more than 50 million people above the SPM poverty line in 2014.
As a result, this SPM series shows that poverty has declined substantially over the past five decades. In 2015, the SPM poverty rate was two-fifths lower than in 1967.
We will analyze the Census Bureau’s 2016 SPM data in the days after September 12 to provide anchored SPM trends and more complete estimates of the safety net’s effects, both now and over time.
4. SPM Data Will Show Impact of Anti-Poverty Programs Presently Facing Cuts
The SPM tables that Census releases on Tuesday will show how many fewer people were poor in 2016 if one counts various forms of government assistance, including refundable tax credits for working families (the EITC and Child Tax Credit), SNAP, and housing assistance — none of which are counted in the official poverty measure. (The tables will also show how many people are lifted above the poverty line by programs that provide benefits in cash and are counted in the official poverty measure, such as Supplemental Security Income for the elderly and disabled poor, Social Security, and unemployment insurance.) These data are particularly timely, because both the budget plan that the House Budget Committee adopted on a party-line vote in July[8] (which is likely to be considered on the House floor in coming weeks) and the Trump Administration’s budget proposal[9] call for deep cuts in an array of low-income assistance programs.
End Notes
[1] Matt Broaddus and Edwin Park, “Census Data Show Large Health Coverage Gains Continued in 2015, Health Reform Coverage Expansions Are Key Driver,” Center on Budget and Policy Priorities, September 16, 2016, https://www.cbpp.org/research/health/census-data-show-large-health-coverage-gains-continued-in-2015.
[2] See https://www.cbpp.org/atom/21394.
[3] Figures are from the CPS. See Jessica C. Barnett and Marina S. Vornovitsky, Health Insurance Coverage in the United States, U.S. Census Bureau, September 2016, https://www.census.gov/library/publications/2016/demo/p60-257.html.
[4] See: Robin Cohen, Michael Martinez, and Emily Zammitti, Health Insurance Coverage: Early Release of Estimates from the National Health Interview Survey, 2015, Centers for Disease Control and Prevention, May 2016, https://www.cdc.gov/nchs/data/nhis/earlyrelease/insur201605.pdf. In addition, a CBPP analysis of historical CPS data on the uninsured — made comparable over time by using Census Bureau adjustment factors to account for survey changes — shows that the uninsured rate in the CPS fell to a record low in 2015, with data back to 1987. For more on CBPP’s historical analysis, see: Broaddus and Park, footnote 5.
[5] Matt Broaddus, “Census Data Show States Not Expanding Medicaid Falling Further Behind,” Center on Budget and Policy Priorities, September 13, 2016, https://www.cbpp.org/blog/census-data-show-states-not-expanding-medicaid-falling-further-behind.
[6] The “anchored” SPM uses a modernized poverty threshold reflecting living standards in 2012, adjusted in prior years for inflation. It is more widely accepted among conservative analysts than the standard SPM, which allows thresholds to grow slightly faster than inflation as living standards rise across decades. Christopher Wimer et al., “Trends in Poverty with an Anchored Supplemental Poverty Measure,” Columbia Population Research Center Working Paper No. 13-01, December 2013, http://cupop.columbia.edu/publications/2013.
[7] Danilo Trisi, “Safety Net’s Anti-Poverty Effectiveness Has Grown Nearly Ten-Fold Since 1967,” Center on Budget and Policy Priorities, January 4, 2016, https://www.cbpp.org/blog/safety-nets-anti-poverty-effectiveness-has-grown-nearly-ten-fold-since-1967.
[8] Isaac Shapiro, Richard Kogan, and Chloe Cho, “House GOP Budget Cuts Programs Aiding Low- and Moderate-Income People by $2.9 Trillion Over Decade,” Center on Budget and Policy Priorities, revised September 5, 2017, https://www.cbpp.org/research/federal-budget/house-gop-budget-cuts-programs-aiding-low-and-moderate-income-people-by-29.
[9] Isaac Shapiro, Richard Kogan, and Chloe Cho, “Trump Budget Gets Three-Fifths of Its Cuts From Programs for Low- and Moderate-Income People,” Center on Budget and Policy Priorities, May 30, 2017, https://www.cbpp.org/research/federal-budget/trump-budget-gets-three-fifths-of-its-cuts-from-programs-for-low-and.
More from the Authors

Areas of Expertise