House GOP Budget Cuts Programs Aiding Low- and Moderate-Income People by $2.9 Trillion Over Decade
Would Slash These Programs by More than One-Third in 2027
The 2018 House Republican budget plan — which has passed out of committee and may be voted on by the full House of Representatives in early September — would severely and disproportionately hit low- and moderate-income families and individuals. If the framework it sets out were to become law, we find that programs serving low- and moderate-income people would:
- be cut by approximately $2.9 trillion from 2018-2027;
- be cut by about 36 percent in 2027 alone;
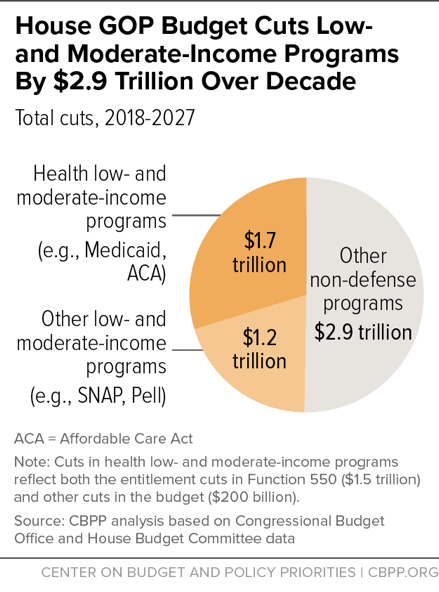
- constitute half of the plan’s budget cuts (see Figure 1), even though they represent about a quarter of non-defense spending; and
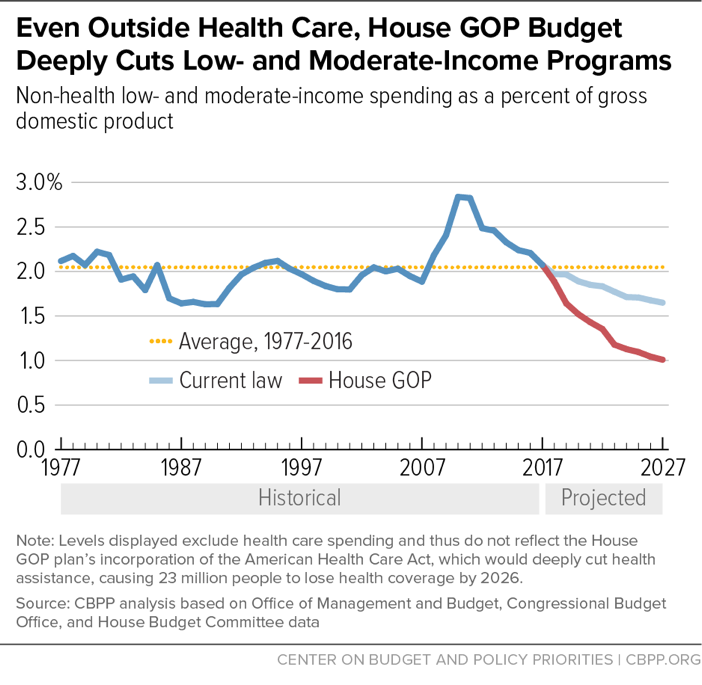
- outside of health programs, fall to their lowest level of spending as a share of the economy in 50 years — even before some key low-income programs such as the Earned Income Tax Credit (EITC) were established. (See Figure 2.)
About half of the low-income cuts would reflect the plan’s incorporation of the House-passed American Health Care Act, which the Congressional Budget Office (CBO) estimates would cause 23 million people to lose health coverage by 2026. Other cuts would significantly undermine the modest levels of basic food aid now provided to poor and near-poor households, and would make it far more difficult for students from low- and moderate-income families to attend college, among other negative effects. At the same time, the budget paves the way for the enactment of tax cuts that likely would largely benefit the wealthy; for example, the tax cuts in the House GOP’s Better Way proposal from last year would provide tax cuts to millionaires totaling $2.6 trillion over a decade. The budget also creates a fast-track approach in which cuts to low-income programs could be used to offset such tax cuts.
Distribution of Budget Cuts
As Table 1 shows, the plan proposes $5.8 trillion in non-defense budget cuts through 2027. Based on information from the CBO and the House Budget Committee, we estimate that cuts in low-income entitlement and discretionary programs would account for about $2.9 trillion — or 50 percent — of the non-defense reductions.
| TABLE 1 | ||
|---|---|---|
| Non-Defense Spending Cuts Under House GOP Budget 2018-2027, in billions of dollars |
||
| Total | Low-Income | |
| Entitlement programs | -4,440 | -2,580 |
| Function 650: Social Security | 0 | 0 |
| Function 570: Medicare | -490 | 0 |
| Function 550: Health (Medicaid, Affordable Care Act, etc.) |
-1,500 | -1,450 |
| Function 600: Income security | -890 | -660 |
| Function 500: Education, social services, etc. | -210 | -90 |
| Other specified functions | -530 | 0 |
| “Improper payments” | -700 | -330 |
| Other “government-wide” | -120 | -40 |
| Non-defense discretionary programs | -1,360 | -300 |
| Total non-defense program cuts | -5,800 | -2,880 |
Over the coming decade, the low-income cuts include:
- $1.5 trillion in entitlement cuts for low- and moderate-income people in the health area of the budget. The budget incorporates the House Republican bill that would repeal the Affordable Care Act (ACA). This bill, according to CBO, would cause 23 million people to lose coverage by 2026 and result in less adequate or more expensive coverage for millions more.[1] The bill would effectively end the ACA’s Medicaid expansion and restructure Medicaid by converting virtually the entire program to a block grant or a grant that pays each state a capped amount of money per enrollee, regardless of actual health care costs (a “per capita cap”). But whether or not the House health bill is enacted in part or in whole, the health cuts in the House GOP budget would be significant. For example, on top of the cuts in the health bill, the budget proposes a work requirement for Medicaid, cutting the program by another $110 billion.
- $150 billion in cuts to the nation’s largest anti-hunger program, the Supplemental Nutrition Assistance Program (SNAP, formerly known as food stamps). The plan would cut SNAP funds by $150 billion; most of these cuts would not occur for several years, but they would grow to roughly 40 percent in 2027. The plan would impose direct program cuts and also transfer “significant authority” over SNAP to the states (something akin to a “block grant”), starting midway through the next decade. A funding reduction of this magnitude would end food assistance for millions of low-income families, reduce benefits for tens of millions of such families, or some combination of the two.[2]
-
Roughly $500 billion in other low-income entitlement cuts in the income security area. In addition to the SNAP cuts, the budget calls for about $500 billion in entitlement cuts to federal income support programs. The plan identifies certain specific cuts in the school meals program, Supplemental Security Income (SSI), and refundable tax credits, all of which would have harmful effects on children. The budget would limit “community eligibility,” an option that allows high-poverty schools to provide school meals at no charge to all students and get reimbursed based on the school’s poverty level; reduce children’s SSI benefits if another member of their family is also a recipient; require more onerous income verification for the EITC; and eliminate some low-income families’ eligibility for the Child Tax Credit.
But the specific potential cuts discussed in the budget plan — including the proposed cuts in federal employees’ pensions, which are not counted in our analysis of low-income cuts — explain only a portion of the total entitlement cuts in income security programs. The remaining, unspecified cuts would either harm the programs described above in yet other ways or come from other safety net programs such as child care, foster care, adoption assistance, and Temporary Assistance for Needy Families, among others.
-
More than $90 billion of cuts in education and social services programs, including deep cuts in student aid. The budget calls for significantly scaling back Pell Grants, which help nearly 8 million students from low- and moderate-income families afford college. It would also repeal the Social Services Block Grant, which helps states provide services to their most vulnerable populations.
The Pell cuts of more than $75 billion would occur even though Pell Grants currently cover just 29 percent of the costs of college — the smallest portion covered in the program’s history. The cuts in Pell would be accompanied by up to $120 billion in cuts to student loans. These student loan cuts are not classified as low-income cuts in this analysis, though they would also impact lower-income students. In combination, the Pell Grant and student loan reductions would make it more expensive and thus more difficult for young people in low- and moderate-income families to attend college, thereby limiting their future prospects.[3]
-
$330 billion in “improper payments.” This is the portion of the budget’s targeted reductions in “improper payments” that we estimate would come from low-income entitlement programs. This translates to reductions in spending of another $330 billion in low-income programs such as Medicaid and the EITC (on top of what’s described above).[4]
Yet the budget does not offer any specific proposals to reduce improper payments, instead offering a commission to study the issue and come up with a plan. Given the long history of past budgets that claimed large savings through cutting “waste, fraud, and abuse” only to have those savings ultimately prove to be illusory, it is unlikely these savings would materialize. Or if they did materialize, it’s likely much of the savings would come in the form of real benefit and eligibility cuts, not rooting out erroneous payments.[5] Note that CBO assessed the President’s budget’s claims that it would reduce improper payments by $140 billion over the next decade and found that it should not be counted on to produce any savings.[6]
- About $300 billion in cuts to low-income non-defense discretionary programs over the coming decade. On top of the significant cuts in non-defense discretionary programs already imposed due to the tight spending constraints imposed by the 2011 Budget Control Act, the plan would cut non-defense discretionary programs another $1.4 trillion (from 2018 to 2027). We assume that low-income discretionary programs would be funded in the same proportion as they are in the 2018 appropriation bills that have been approved by the House Appropriations Committee; this method produces an estimate of approximately $300 billion in reductions in these programs. These cuts would hit important areas such as rental assistance and job training.
The Reconciliation Process: A First Step
The budget also puts in place a fast-track reconciliation process to achieve the first tranche of its cuts through legislation this year, calling for congressional committees to produce at least $203 billion over ten years in “reconciled” entitlement cuts to be enacted in the months ahead. This reconciliation process permits Congress to enact the program cuts with only a simple majority in the Senate — i.e., without any Democratic votes — and is the same process that GOP leaders have been using to try to undo the ACA. The $203 billion target is a floor for the required cuts, not a ceiling. As a result, the cuts could end up substantially deeper than $203 billion. In particular, tax-cut proponents could have an incentive to increase the size of these budget cuts; tax cuts enacted through the reconciliation process could be made larger if they were offset by bigger entitlement cuts.
The budget plan requires a number of specified congressional committees to come up with these reconciled budget cuts. Many of these committees have jurisdiction over programs important to low- and moderate-income families, including the Ways and Means Committee (which has jurisdiction over a number of income-assistance programs), the Agriculture Committee (with jurisdiction over SNAP), the Energy and Commerce Committee (with jurisdiction over Medicaid), and the Education and the Workforce Committee (with jurisdiction over Pell Grants and student loans).
Unprecedented Cuts to Low- and Moderate-Income Programs
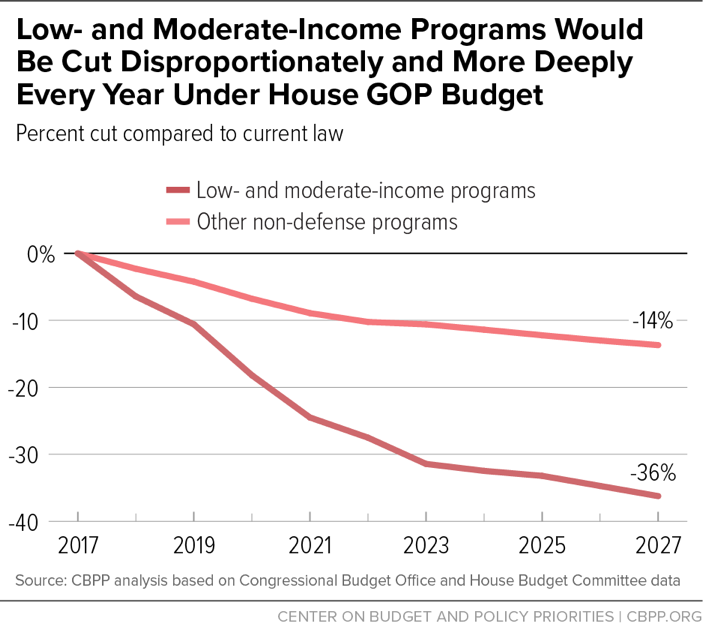
If enacted, these proposals would constitute reductions in the safety net of unprecedented magnitude. If enacted, these proposals would constitute reductions in the safety net of unprecedented magnitude. The cuts would grow over time until, in 2027, 36 percent of the resources for low- and moderate-income programs would be lost. In contrast, other non-defense programs would be cut by 14 percent that year. (See Figure 3.)
- All types of low-income programs would be hit hard. Low-income health programs would be cut by 35 percent in 2027, while other low-income programs would be reduced by 39 percent.
- The cuts in discretionary programs would come on top of cuts that have already occurred or would be required in future years due to existing appropriations caps and sequestration.[7] Overall, from 2010 to 2027, low-income discretionary programs would be cut by a stunning 55 percent, or more than half, after adjusting for inflation (and by significantly more if population growth or economic growth is taken into account).
- Outside of health care, the share of national resources devoted to programs assisting low- and moderate-income people would fall dramatically. Currently, spending on these programs equals 2.1 percent of the economy (or GDP), which is close to its average of 2.0 percent over the past 40 years. Even without policy changes, this percent will soon drop considerably below its historic average. Under the budget plan, the drop would be even sharper — with expenditures for these programs falling to 1.0 percent of GDP in 2027 — which would be the lowest percent since 1966, when programs like the EITC for low-earning workers didn’t even exist. (See Figure 2 above.)
Large Tax Cuts to Millionaires Could be Facilitated by Big Program Cuts Hitting People with Low or Moderate Incomes
As noted above, the House Budget Committee plan also includes a fast-track “reconciliation” process that would permit a tax bill to be passed with a simple majority vote (thus making it possible to pass without votes from any Democratic senators).
Although the budget resolution can’t dictate the actual details of the tax plan, it does include a section that highlights potential tax priorities. These priorities favor high-income households or corporations and are consistent with the House GOP’s “Better Way” tax plan from last year.[8]
The vast majority of the tax cuts in the Better Way plan would ultimately go to the highest-income households. Of the plan’s $3.1 trillion in tax cuts over ten years, millionaires would receive an estimated $2.6 trillion in tax cuts, gaining $330,000 apiece in 2017 alone, Tax Policy Center data indicate.[9] So if a proposal such as the Better Way plan were to be adopted, millionaires might benefit nearly as much from the tax cuts facilitated by the budget as low- and moderate-income people would be harmed under the budget. The poor would become substantially poorer and the rich, still richer.
The budget does call for its tax reform bill to be deficit neutral, but it fails to identify specific revenue-raising measures to pay for it. Similarly, the July 27 Joint Statement on Tax Reform[10] by the Trump Administration and congressional GOP leaders referenced several tax cuts benefiting those with high incomes without identifying a single offsetting revenue-raising proposal. This follows a familiar political story — promise large tax cuts and provide specifics about which taxes will be cut, and then claim that the tax cuts will be offset but provide limited or no information about how this would occur. This year’s budget resolution leaves open the possibility that the cost of some of the tax cuts could be offset by entitlement cuts that reduce assistance to people struggling to get by, as well as by gimmicks that help mask the tax cuts’ true cost.
A Different Approach Is Possible
The budget plan’s structure essentially dictates severe cuts to certain types of spending. The plan is designed to balance the budget in ten years while cutting revenues, increasing defense, and essentially holding Social Security harmless.[11] As a result, other programs, especially low-income programs, would be hit hard.
The plan could have aimed for significant deficit reduction without insisting on a deficit of zero in the final year.[12] Or it could have taken a more equitable approach, including new revenues, to reach its deficit reduction goal. Past bipartisan plans have taken a more balanced approach to deficit reduction, including the plan advanced by Erskine Bowles and Alan Simpson in 2010 as co-chairs of the National Commission on Fiscal Responsibility and Reform.[13] These plans accomplished significant deficit reduction by both increasing revenues and reducing expenditures, while largely avoiding cuts in programs for low-income people. Bowles and Simpson stated a principle that deficit reduction should not increase poverty or inequality.
Moreover, the House Budget Committee plan ignores what should be one of the largest sources for deficit reduction: tax expenditures. These are the more than $1 trillion a year in deductions, credits, and other preferences that former Federal Reserve Chairman Alan Greenspan called “tax entitlements” and former Reagan economic adviser Martin Feldstein said are the best target for cutting wasteful government spending. Tax expenditures tilt heavily toward the affluent, with half of their benefits going to the top fifth of households. A reduction in tax expenditures could be used to pay for tax cuts that advocates of the House plan envision, or tax expenditures could be scaled back to help reduce the deficit.
Rather than limit tax expenditures or take other steps that would have allowed for a less unbalanced approach to deficit reduction, however, the House Budget Committee’s plan adopts an approach that would make Americans with the least bear the brunt of the sacrifices.
End Notes
[1] Congressional Budget Office (CBO), “H.R. 1628: American Health Care Act,” May 24, 2017, https://www.cbo.gov/system/files/115th-congress-2017-2018/costestimate/hr1628aspassed.pdf; and Edwin Park, “New CBO Estimates: 23 Million More Uninsured Under House-Passed Republican Health Bill,” Center on Budget and Policy Priorities, May 24, 2017, https://www.cbpp.org/research/health/new-cbo-estimates-23-million-more-uninsured-under-house-passed-republican-health.
[2] Dorothy Rosenbaum, “House Budget Targets SNAP for Cuts,” Center on Budget and Policy Priorities, July 20, 2017, https://www.cbpp.org/blog/house-budget-targets-snap-for-cuts.
[3] Sharon Parrott, “Commentary: House GOP Appears Set on Making College Less Affordable for Millions of Students,” Center on Budget and Policy Priorities, July 27, 2017, https://www.cbpp.org/federal-budget/commentary-house-gop-appears-set-on-making-college-less-affordable-for-millions-of.
[4] This estimate is based on the distribution of improper payments used in the House Budget Committee’s report. The budget plan includes a general category of entitlement cuts labeled “government-wide savings,” most of which come from the claimed reductions in improper payments. The House Budget Committee has noted that medical malpractice reform is also included among its government-wide savings, but the rest of the cuts in this area are not specified. We assume that the remaining, unspecified government-wide reductions hit low- and moderate-income programs in proportion to their overall share of entitlement program cuts, thus yielding another $40 billion in cuts to the entitlement programs targeting low- and moderate-income people.
[5] Rooting out true waste, fraud, and abuse is desirable. But securing large savings by reducing improper payments is very difficult for several reasons. A large number of improper payments actually are proper payments that lack sufficient documentation; in these cases, improving compliance though more documentation doesn’t result in savings. In addition, some improper payments are underpayments, not overpayments. Moreover, improper payments are generally hard to identify before the fact, and doing so usually requires devoting substantial administrative resources to such efforts — resources that the House budget plan likely would shrink rather than augment, given its steep reductions in funding for non-defense discretionary programs, which include basic governmental operations. Finally, programmatic changes necessary to root out improper payments can be difficult to design without risking adverse effects on individuals and families that are indeed eligible for the programs.
[6] CBO, An Analysis of the President’s 2018 Budget, July 13, 2017, https://www.cbo.gov/publication/52846. If one assumes that the House GOP cuts to improper payments, as well, are largely illusory and should not be counted, the overall cuts to low- and moderate-income programs would drop to $2.6 trillion and the total non-defense cuts would drop to $5.1 trillion. Low- and moderate-income programs would still constitute half of the cuts.
[7] The Budget Control Act (BCA) of 2011 imposed caps or limits on funding for discretionary appropriations through 2021. It also established a mechanism called sequestration by which those caps were automatically reduced further when Congress failed to enact additional deficit reduction through revenue increases or entitlement cuts later in 2011. The resulting low appropriations caps through 2021 also create a baseline for budget projections after 2021. As a result, the BCA reduced projected discretionary appropriations through 2021 by the direct imposition of caps, and de facto reduced expected or baseline levels of discretionary appropriations in all years after 2021. It is relative to these resulting, low 2018-2027 levels that the House budget plan cuts another $1.3 trillion.
[8] Chuck Marr, “House GOP Budget Prioritizes Wealthy and Corporations for Tax Bill,” Center on Budget and Policy Priorities, July 25, 2017, https://www.cbpp.org/blog/house-gop-budget-prioritizes-wealthy-and-corporations-for-tax-bill.
[9] James R. Nunns et al., “An Analysis of the House GOP Tax Plan,” Tax Policy Center (TPC), September 16, 2016, http://www.taxpolicycenter.org/publications/analysis-house-gop-tax-plan; and TPC Tables T16-0196, T16-0197, T16-0198, and T16-0199, http://www.taxpolicycenter.org/simulations/house-gop-tax-plan-sep-2016. TPC only estimates the distribution of the tax cuts for 2017 and 2025. To estimate the tax cuts that millionaires would receive over the decade as a whole, we averaged the share of the tax cuts they would receive in those two years and multiplied the result by $3.1 trillion (TPC’s ten-year estimate of the plan’s total tax cuts). TPC found that millionaires would receive 71.2 percent of the tax cuts in 2017 and 96.5 percent in 2025, yielding an average of 83.9 percent. Multiplying that figure by $3.1 trillion produces a total tax cut for millionaires of $2.6 trillion.
[10] Speaker Ryan Press Office, “Joint Statement on Tax Reform,” July 27, 2017. https://www.speaker.gov/press-release/joint-statement-tax-reform
[11] The House plan includes Medicare savings that produce a 10 percent reduction in Medicare in the tenth year. This is not an insignificant reduction, though it is much smaller than the 36 percent average cut in low-income programs that would occur in 2027.
[12] Robert Greenstein and Joel Friedman, “Balancing the Budget in Ten Years and No New Revenue Are Flawed Budget Goals,” Center on Budget and Policy Priorities, updated March 9, 2016, https://www.cbpp.org/sites/default/files/atoms/files/3-13-15bud.pdf.
[13] Richard Kogan, “What Was Actually in Bowles-Simpson – And How Can We Compare It With Other Plans?” Center on Budget and Policy Priorities, October 2, 2012, https://www.cbpp.org/research/what-was-actually-in-bowles-simpson-and-how-can-we-compare-it-with-other-plans.