Chart Book: Economic Security and Health Insurance Programs Reduce Poverty and Provide Access to Needed Care
Today’s economic security programs lift tens of millions of Americans above the poverty line, provide health care to tens of millions of Americans, and have positive longer-term effects on children, many studies find, helping them do better (and go farther) in school and lift their earning power as adults. Still, poverty remains high and many families face serious hardship.
The following charts illustrate that:
Part I: Economic Security Programs Are Effective Against Poverty
Part II: Health Care Programs Help Millions Obtain Health Insurance
Part III: Economic Security and Health Care Programs Support Work
Part IV: Economic Security Programs Provide Long-Term Positive Effects
Part V: Programs Provide a Limited Safety Net
Part I: Economic Security Programs Are Effective Against Poverty
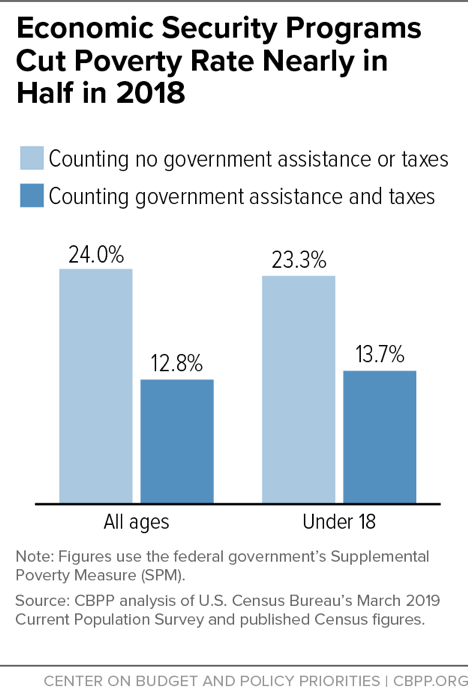
Economic security programs cut poverty nearly in half. These programs (i.e., the safety net of government assistance policies) lifted nearly 37 million people above the poverty line in 2018 — including 7 million children, we calculate using the federal government’s Supplemental Poverty Measure (SPM).
Unlike the official poverty measure, the SPM counts non-cash benefits, tax credits, and income and payroll taxes paid, as well as cash benefits such as Social Security and unemployment insurance. It also takes certain expenses (such as child care) into account when considering the income that a family has available to buy basics such as food, clothing, and shelter. It uses a modernized poverty threshold ($28,166 for a two-adult, two-child family renting in an average-cost community in 2018) that accounts for differences in family composition and geographic differences in housing costs.
Government benefits and tax policies cut the poverty rate from 24.0 percent to 12.8 percent in 2018; among children, they cut the poverty rate from 23.3 percent to 13.7 percent.
These SPM figures, moreover, understate the effectiveness of economic security programs. These programs lower the poverty rate by even more when using data that correct for households’ underreporting of key government benefits in the Census survey. Household surveys depend on participants’ recollections over many months and typically fail to capture some income; the Census data are no exception.
In 2016, the most recent year for which these corrections are available, economic security programs lowered the SPM poverty rate from 25.9 percent to 13.5 percent — 1.4 percentage points lower than in SPM data without these corrections.
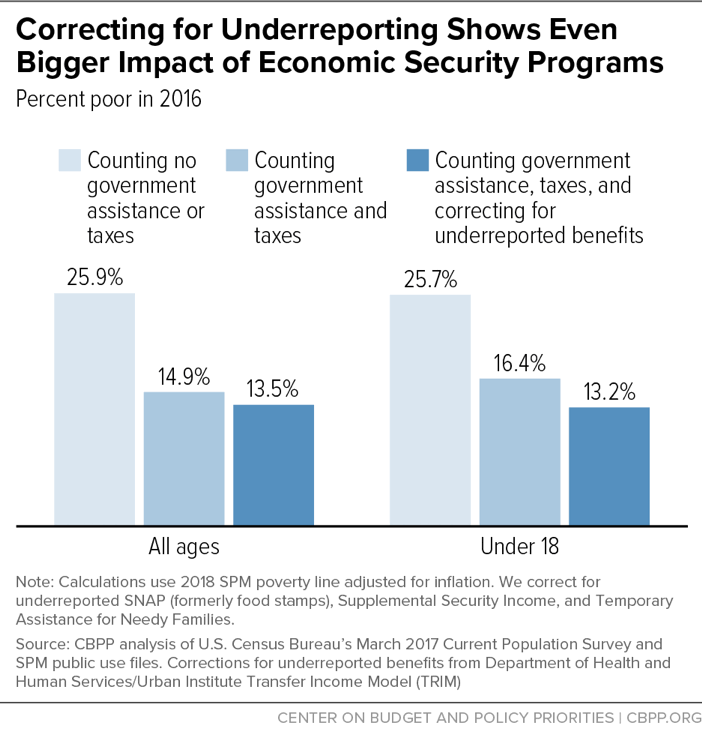
In order to correct for underreporting in the Census Bureau data, we use data from the U.S. Department of Health and Human Services and the Urban Institute for four types of government assistance: the Supplemental Nutrition Assistance Program (SNAP, formerly food stamps), Supplemental Security Income (SSI), rental assistance, and Temporary Assistance for Needy Families (TANF).
Correcting for underreporting makes an especially big difference in poverty for children, who are more likely than other age groups to receive SNAP and TANF.
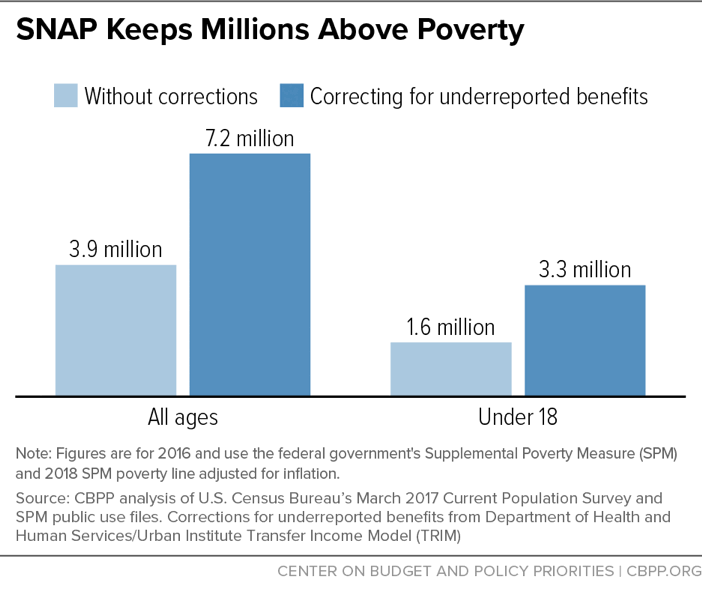
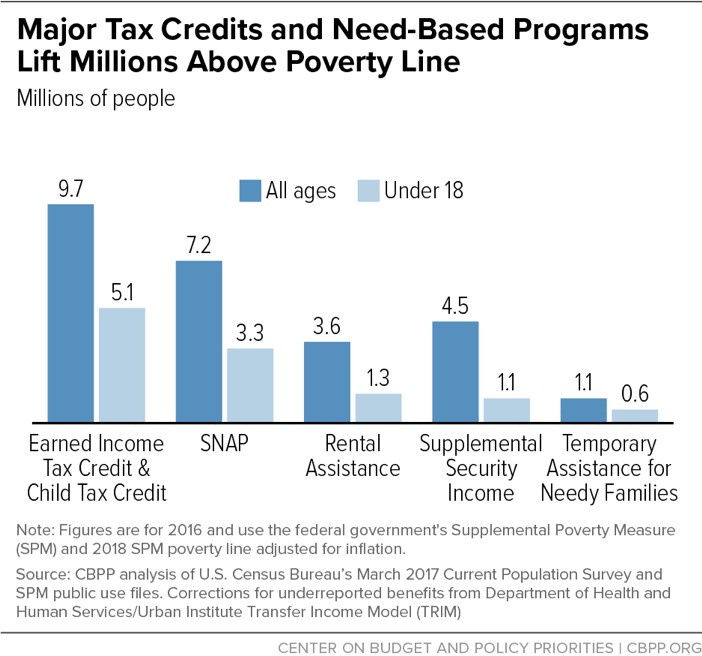
SNAP lifts more than 7 million people out of poverty. SNAP lifted 7.2 million people — including 3.3 million children — above the poverty line in 2016, using data that correct for underreporting. This is more than twice as many children than in figures reported by the Census Bureau that do not make these corrections.
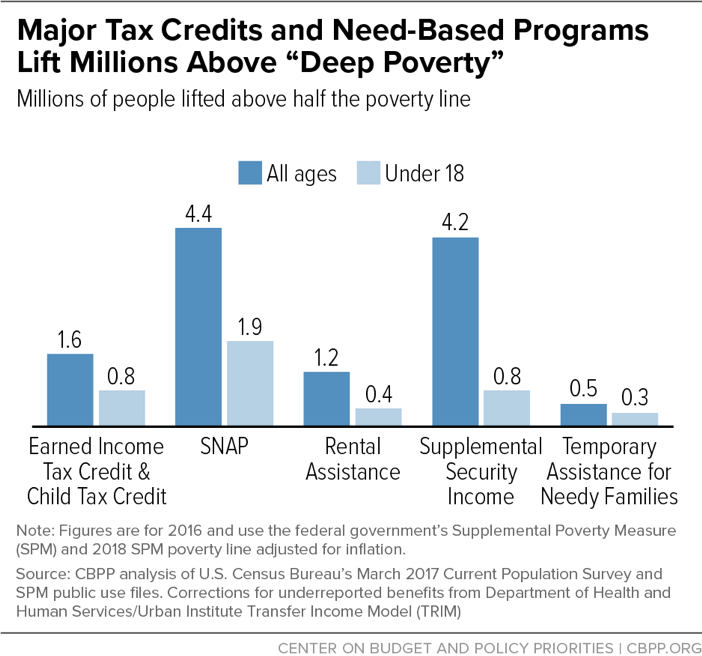
SNAP also lifted 1.9 million children out of deep poverty (defined as incomes below half of the poverty line) in 2016, more than any other government assistance program. And SNAP lifts more households with children out of extreme poverty — defined as having income of less than $2 per person per day — than any other government program.
One reason SNAP is so effective in fighting extreme poverty is that it focuses on many of the poorest households. Roughly 92 percent of SNAP benefits go to households at or below the poverty line each month, and 55 percent go to households below half of the poverty line (that is, below $890 a month for a family of three in fiscal year 2020), program records show.
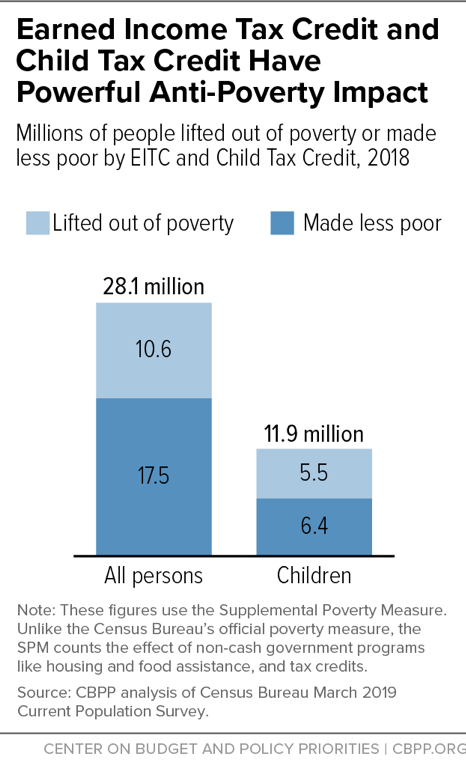
Tax credits lift over 10 million people in working families above the poverty line. Together, the Earned Income Tax Credit (EITC) and Child Tax Credit (CTC) lifted an estimated 10.6 million people, including 5.5 million children, above the poverty line in 2018. They also reduced the severity of poverty for another 17.5 million people, including 6.4 million children.
Social Security lifts nearly 18 million seniors and over 9 million others out of poverty. Social Security lifted over 27 million people above the poverty line in 2018 using the SPM, according to Census Bureau estimates. This includes nearly 18 million seniors ages 65 and older as well as many younger adults (early retirees, disabled workers, and survivors of deceased workers) and close to 1.5 million children.
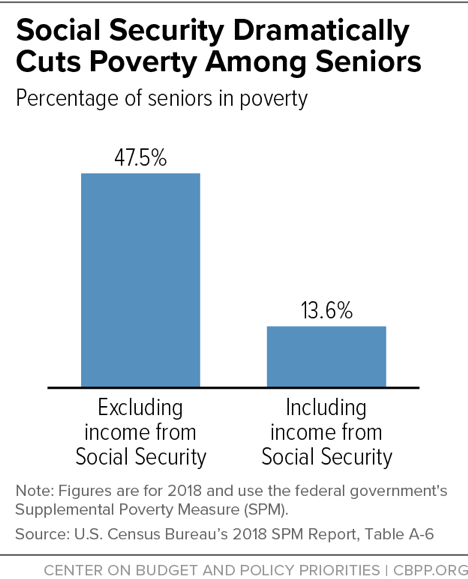
Without their Social Security income, 47.5 percent of seniors would have been poor in 2018, the Census Bureau reports; with Social Security, their poverty rate under the SPM is 13.6 percent. (While these figures use the SPM, Social Security also has a strong effect on the official poverty measure because it provides cash assistance.)
These estimates are subject to two major qualifications. If Social Security did not exist, many retirees likely would have saved somewhat more and worked somewhat longer, and many might live with their adult children rather than in their own households. In addition, the Census Bureau’s estimates are based on self-reported income; one study estimates that the share of elderly Americans that Social Security lifted above the poverty line in 2012 was about one-third lower when researchers match survey responses with official records. However, even after accounting for both underreporting and work effects, Social Security lifts many millions of Americans above the poverty line.
Need-based economic security programs lift millions out of poverty. Need-based programs overall — those limited to people with low or modest incomes — lifted more than 26 million Americans above the poverty line in 2016, including more than 11 million children, when using data that correct for underreporting. Need-based (also known as “means-tested”) programs include SNAP, SSI, rental assistance, TANF cash assistance, the EITC, and the low-income component of the Child Tax Credit. They also include the Low Income Home Energy Assistance Program (LIHEAP), the Special Supplemental Nutrition Program for Women, Infants, and Children (WIC), need-based veterans’ benefits, free and reduced-price school lunch, and state General Assistance programs.
Need-based programs also play a crucial role in easing deep poverty, particularly for families with children. SNAP lifted 4.4 million people above half the poverty line in 2016, including 1.9 million children. As noted, SNAP also lifted more children out of deep poverty than any other government program in 2016. After Social Security and SNAP, SSI lifted the most people of all ages out of deep poverty (4.2 million).
Rental assistance programs reach relatively few eligible households due to limited funding but have strong anti-poverty effects for those they do reach. In 2016, 10 million Americans in 5 million low-income households received federal rental assistance, well below the number that received other major needs-based programs like SNAP or the EITC. Yet, rental assistance lifted above the poverty line a larger share of those it assisted: over 30 percent of rental assistance recipients would be considered poor without this assistance but were above the poverty line because of it.
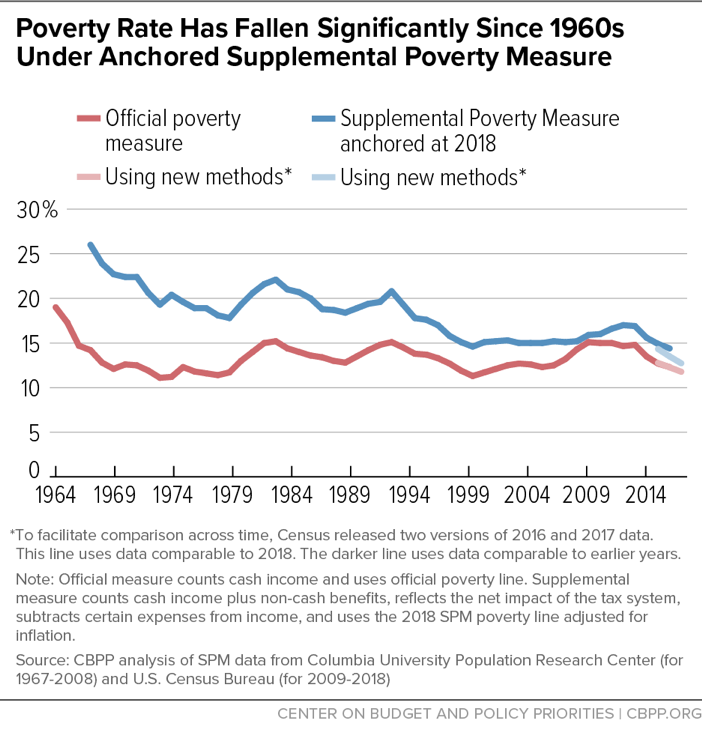
Expanded poverty measure shows progress against poverty that the official measure masks. Some policymakers and pundits have argued that federal anti-poverty programs are ineffective, noting that the official poverty measure fell sharply between 1959 and 1969 but has changed relatively little since then, apart from fluctuations due to the business cycle.
However, comparing poverty rates in the 1960s and today using the official measure yields misleading results because the official measure doesn’t count programs like SNAP, the EITC, and rental assistance, which now constitute a much larger part of government assistance than 50 years ago.
The poverty rate fell from 26.0 percent in 1967 to 14.4 percent in 2017 under a more comprehensive poverty measure that includes this assistance, as most analysts favor. These figures come from our update of the anchored Supplemental Poverty Measure series produced by Columbia University researchers. (These data do not adjust for underreporting because such adjustments are not available for the full historical series. In 2018, Census released data based on an updated processing system. To facilitate comparisons across time, Census released two versions of 2016 and 2017 data: one comparable to 2018, the other comparable to earlier years.)
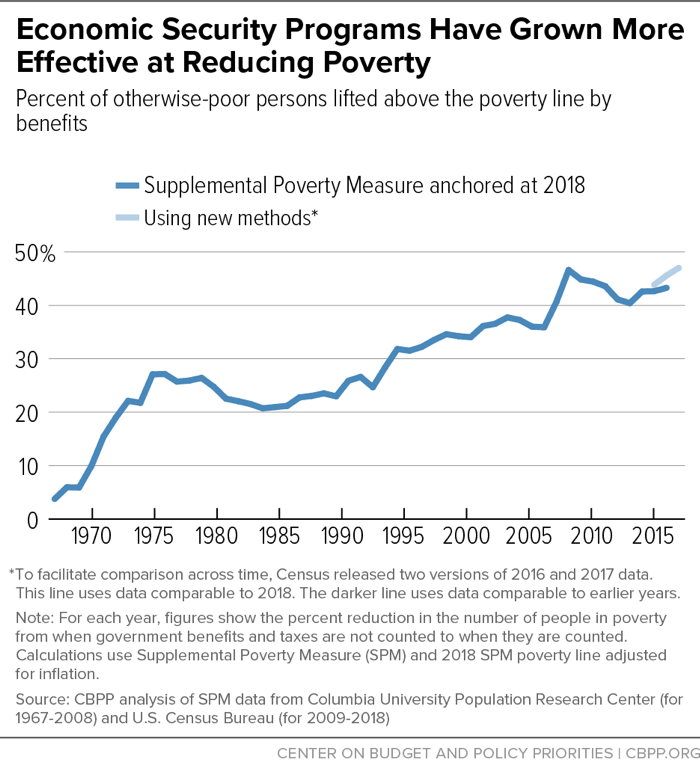
Effectiveness of programs in reducing poverty has grown substantially. In 1967, government assistance lifted above the poverty line just 4 percent of those who would otherwise be poor; by 2017, that figure had jumped to 43 percent.
In 2017, before accounting for government benefits and taxes (including tax credits), about 82 million people had incomes below the poverty line. Counting benefits and taxes, however, lowers that number by more than 35 million people or 43 percent.
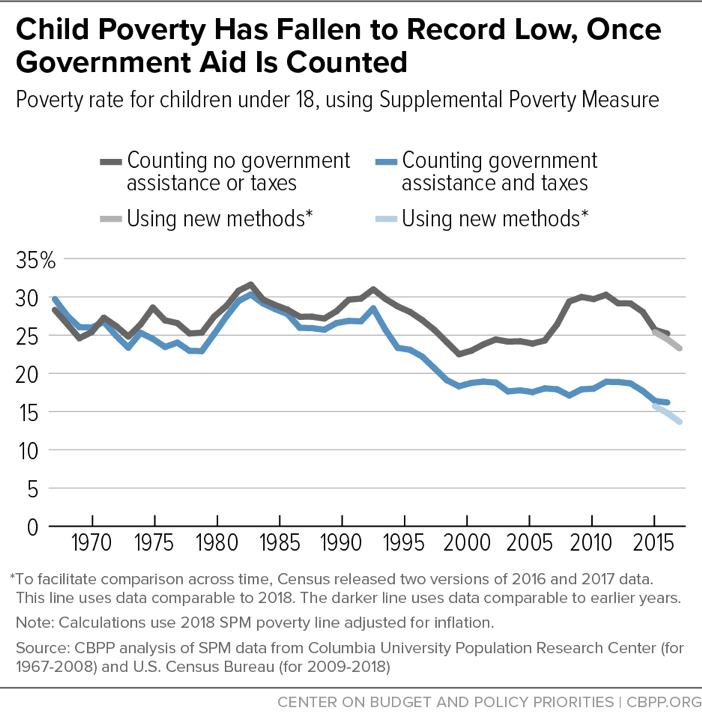
The child poverty rate has fallen to a record low, largely due to increasingly effective assistance policies. The child poverty rate fell to a record low of 16.2 percent in 2017, close to half its 1967 level of 29.7 percent.
Before taking government benefits and tax policies into account, child poverty has improved only modestly over the past five decades, falling from 28.3 percent in 1967 to 25.2 percent in 2017. Nearly 8 million more children would have been poor in 2018 if the anti-poverty effectiveness of government assistance programs had remained at their 1967 levels.
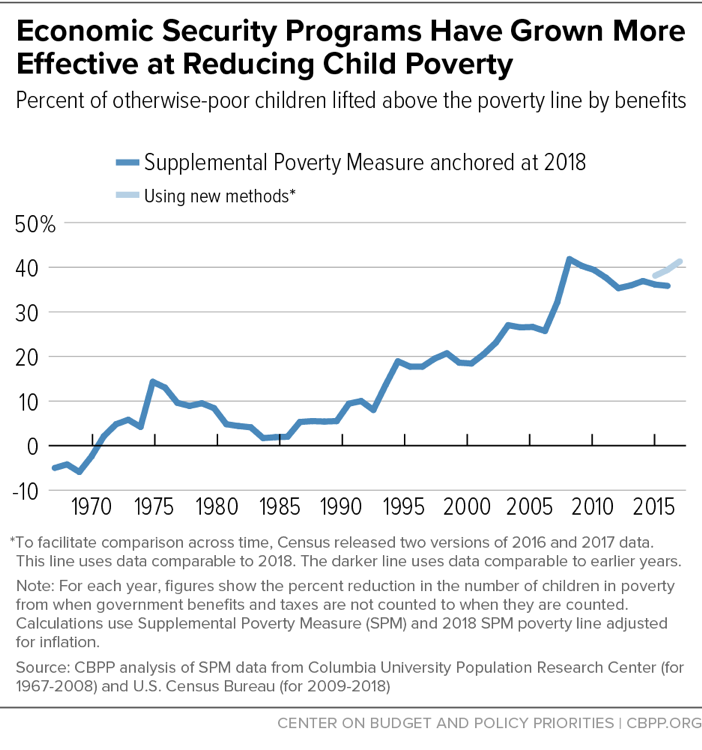
Effectiveness of programs in reducing child poverty has grown dramatically since 1967. In 2017, government policies lifted above the poverty line 36 percent of the children who would otherwise be poor, with the refundable tax credits and SNAP accounting for the majority of this strong anti-poverty effect.
In 1967, in contrast, child poverty was modestly higher after taking government benefits and taxes into account than before taking them into account, because a significant number of families with children were taxed into poverty. Since then, however, the EITC and the CTC were established and expanded, and today these tax credits lift over 5 million children above the poverty line. Similarly, nationwide implementation of SNAP in the early 1970s and its increased effectiveness over time in reaching more eligible people (especially working-poor families) have lifted millions of additional children out of poverty.
Part II: Health Care Programs Provide Coverage to Millions
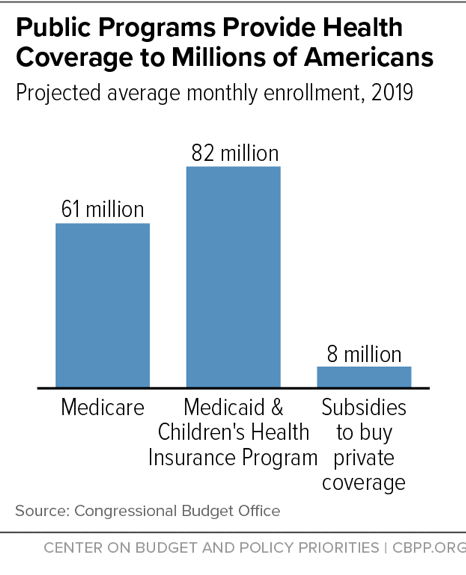
Public programs provide health coverage to millions of seniors and low-income people. Medicare and Medicaid cover millions of seniors, people with disabilities, parents, children, and — in states adopting the Affordable Care Act’s (ACA) Medicaid expansion — childless adults with incomes up to 138 percent of the poverty line. The ACA also provides near-poor and moderate-income people with subsidies to buy private coverage through insurance marketplaces.
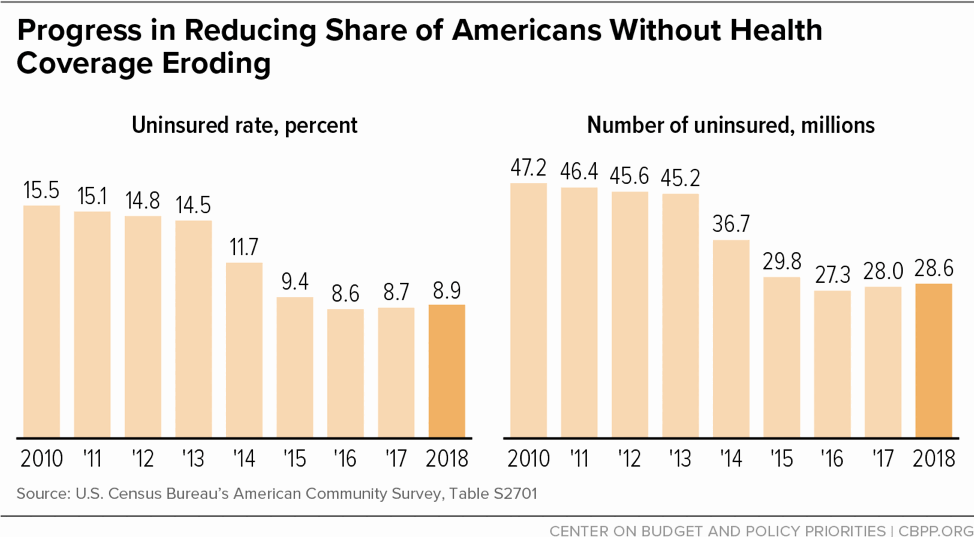
The share of Americans without health insurance has fallen to historic lows under the ACA. The uninsured rate reached a historic low in 2016, the third full year that the ACA’s major coverage expansions were in place: 8.6 percent of people lacked insurance, down more than one-third from 2013’s rate of 14.5 percent. The number of uninsured also hit a record low in 2016: 27.3 million, or nearly 18 million fewer than in 2013. Progress has stalled during the last couple of years, at least in part due to Trump Administration policies to weaken public health coverage.
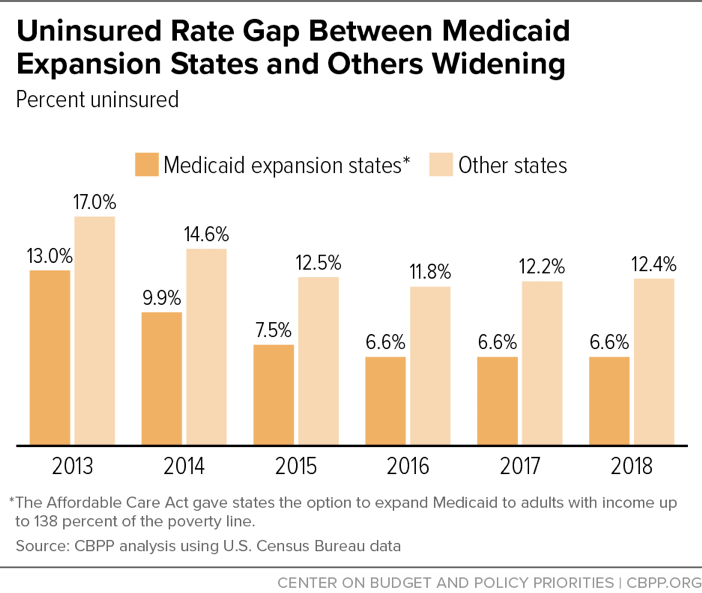
States not expanding Medicaid lag further in health coverage. States that had adopted the ACA’s Medicaid expansion had a much lower uninsured rate in 2018 than states that hadn’t. Some 6.6 percent of the people in the 32 states (including the District of Columbia) that expanded Medicaid by January 2018 lacked health insurance that year, compared with 12.4 percent in the 19 non-expansion states, according to the Census Bureau’s American Community Survey. (Since January 2018, Maine and Virginia have expanded Medicaid. Also, citizens in Idaho, Nebraska, and Utah passed ballot measures in November 2018 to expand Medicaid, but implementation has not happened due to delays initiated by the states’ legislatures or administering agencies.)
The ACA’s Medicaid expansion has produced not only historic health coverage gains but other positive effects, a large and growing body of research finds.
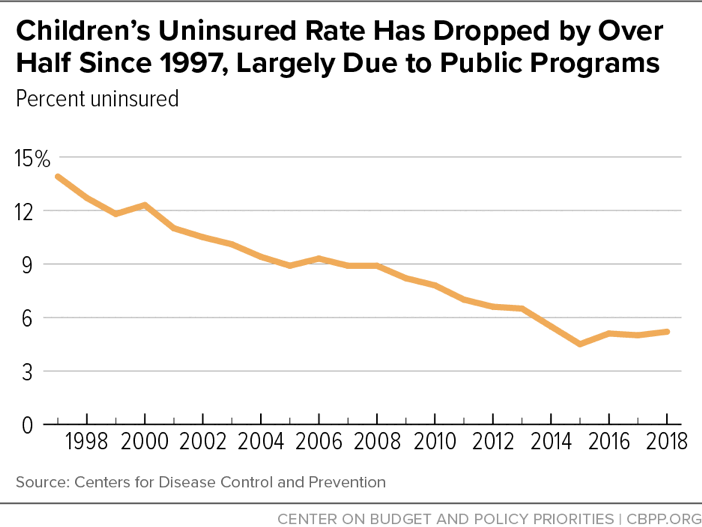
The children’s uninsured rate has dropped by over half since 1997. Over the past two decades, Medicaid expansions and the creation of the Children’s Health Insurance Program (CHIP) have significantly reduced the share of children who are uninsured, which fell from 13.9 percent in 1997 to 5.2 percent in 2018, according to data from the Centers for Disease Control and Prevention. Together, Medicaid and CHIP provide quality health coverage to more than 1 in 3 children, the great majority of whom lack access to affordable employer-sponsored coverage.
Medicaid and CHIP improve access to health care and health outcomes for children, including increasing the likelihood of receiving a well-child visit and reducing avoidable hospitalizations. They also have other far-reaching benefits.
Part III: Economic Security and Health Programs Support Work
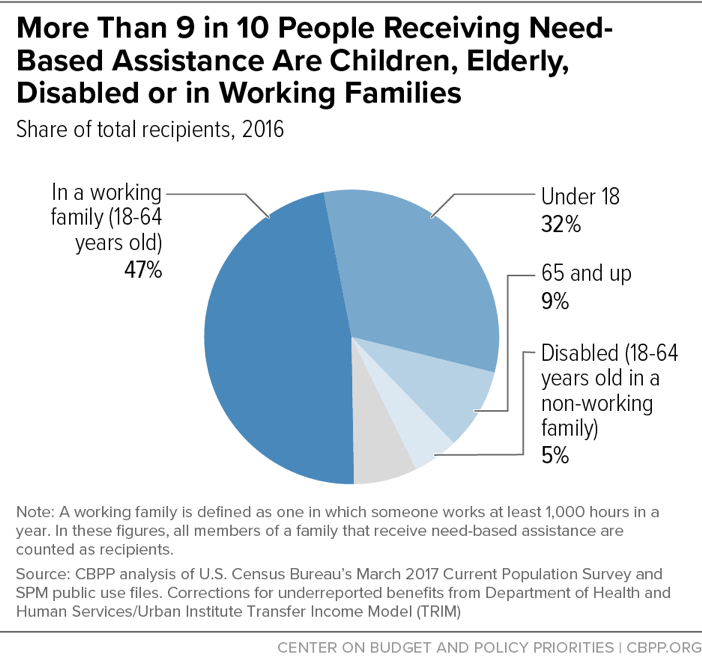
Most recipients of need-based government assistance either aren’t expected to work — such as children, the elderly, and people with disabilities — or are in working families. Need-based programs are those limited to people with low or modest incomes. Examples include SNAP, Medicaid, Supplemental Security Income, rental assistance, Temporary Assistance for Needy Families, and the Earned Income Tax Credit.
Most non-elderly adults who aren’t receiving disability benefits and participate in programs like Medicaid or SNAP are working — and many of those who aren’t working now have worked recently or will work soon. Of those who aren’t working, many are ill, caring for a family member who is ill or has a disability, or face other circumstances that make it difficult to work in the near term.
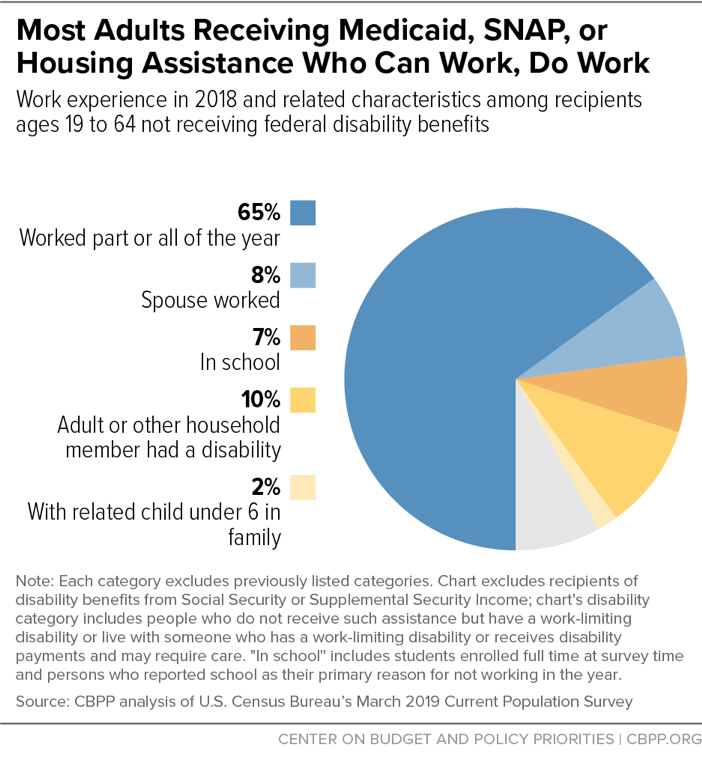
Most adult program participants who are expected to work, do work for part or all of the year. Some 65 percent of adults ages 19 to 64 who participated in Medicaid, SNAP, or rental assistance programs during any part of 2018 worked at some point that year. (These figures omit people with severe disabilities, as indicated by receipt of SSI or Social Security disability benefits.) They tended to work a substantial amount: an average of 44 weeks per year (or about five-sixths of the year) for 37 hours per week. Another 8 percent were married to someone who worked.
In total, therefore, 73 percent of these adults worked or were in a working couple. Most of the rest were in school, had a work-limiting disability or were living with someone with a disability who may require care, or had children under age 6.
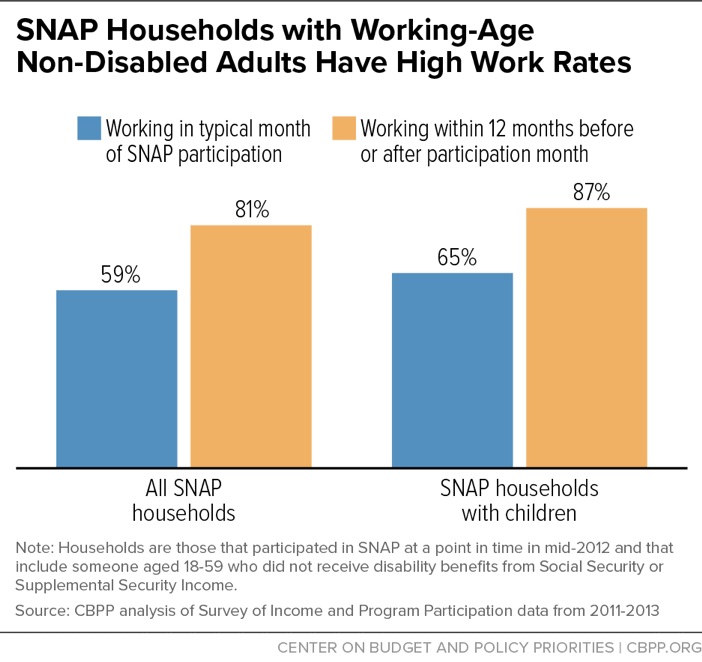
Among food assistance recipients who are able to work, most are working now, have worked recently, or will work soon. SNAP has become increasingly effective at supporting work among households that can work. More than half of SNAP households with at least one working-age, non-disabled adult work in a typical month of SNAP receipt — and more than 80 percent work within 12 months before or after that month. The rates are even higher for families with children: more than 60 percent work while receiving SNAP, and almost 90 percent work in the prior or subsequent year.
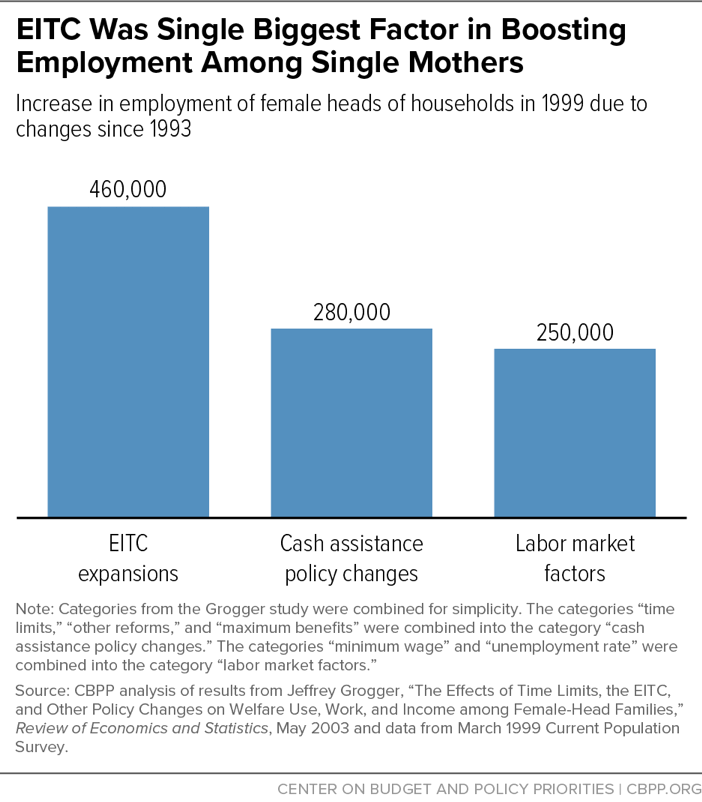
The Earned Income Tax Credit (EITC) boosts employment among parents. The EITC has repeatedly been found to act as a powerful work incentive, especially for single parents. The EITC expansions enacted in the 1990s “appear to be the most important single factor in explaining why female family heads [of households] increased their employment over 1993-1999,” according to a well-regarded study.
Under economic security programs, it pays to work. Economic security programs help millions of working families make ends meet and are structured so that families generally are better off when an adult can start working, work more hours, or receive a wage hike. Further, various changes in assistance programs over the past two decades (such as the expansion of working family tax credits and the enactment of the Affordable Care Act) have substantially increased incentives to work for people in poverty.
Families in which adults are not working and do not qualify for disability-related benefits often don’t have access to any cash income. In 2017, for every 100 families with children in poverty, only 23 received cash assistance from TANF, and a substantial majority of families with incomes low enough to qualify for TANF assistance don’t receive it. There is no federal cash assistance program for those without children — and very few states have state-level programs.
Families with children are far better off if the parent can find work, even if that work is low paid. Consider, for example, a single mother with two children who is not working and receives SNAP and Medicaid (the most common benefit configuration for such parents). Her family income would more than double if she took a half-time job at the federal minimum wage and would more than quadruple if she took a full-time job at the federal minimum wage. Under either scenario, she and her children would remain eligible for Medicaid in 35 states (33 of which have chosen the Medicaid expansion) and the District of Columbia. This accounts for states that expanded Medicaid by December 2019. This number would grow if more states take the Medicaid expansion.
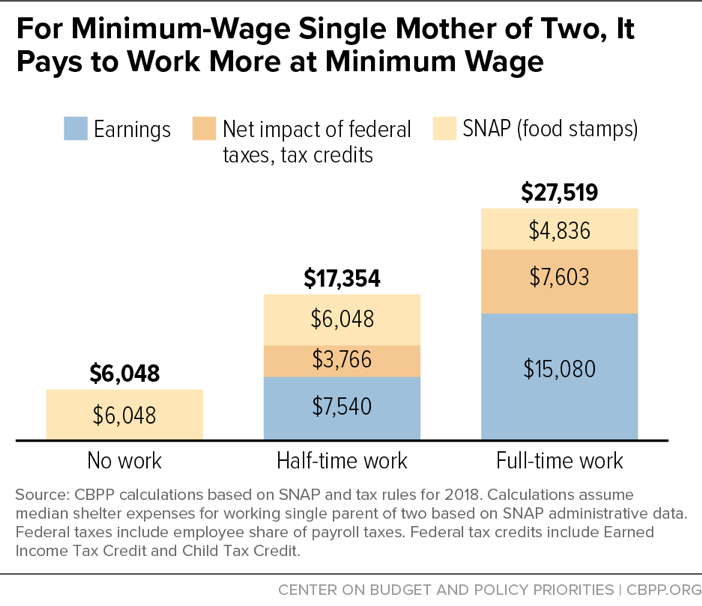
These calculations do not factor in work expenses. For parents, particularly those with younger children, child care assistance can offset a large share of these costs, but unfortunately, most low-income parents with children can’t get child care assistance due to insufficient funding. Fewer than 1 in 6 children eligible for child care assistance under federal law receive help.
Medicaid expansion enrollees report that health coverage helps them work and look for work. Most low-income adults with Medicaid expansion coverage in Ohio and Michigan find that Medicaid makes it easier to look for work and easier to work once they have a job. Health coverage helps low-income adults address health problems such as diabetes or depression, which are a common reason why some people lose their job or cannot find one. These employment benefits are on top of the health benefits that Medicaid expansion enrollees in these states also cited.

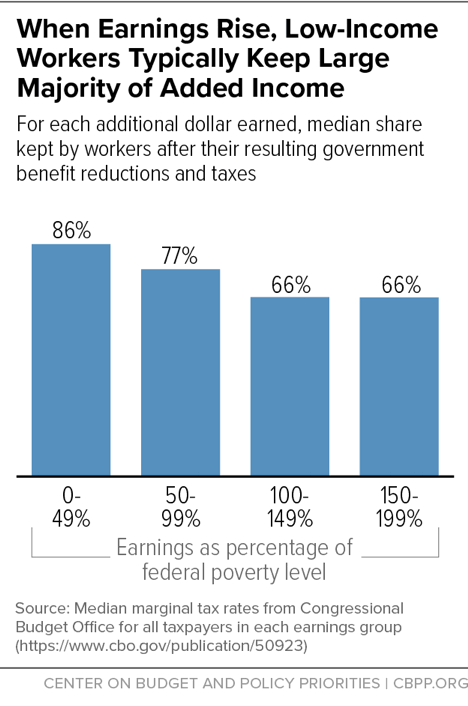
Claims that economic security programs discourage work often assume that workers receive a combination of benefits that few low-income workers actually get. The examples cited to support these claims, in which each additional dollar that a family earns is largely offset by the loss of benefits or increase in taxes, are generally worst-case scenarios that apply only to a small fraction of families with children. We estimate that only about 3 percent of single mothers with two children and earnings below 150 percent of the poverty line (below about $29,000) receive the EITC, SNAP, and either TANF or housing aid (or both) and are in the earnings range where these benefits all phase down at once — and consequently could lose 80 cents or more per added dollar of earnings. The proportion with such steep losses is even smaller for other family configurations.
The typical (median) worker with earnings below half of the poverty line keeps 86 percent of each additional dollar earned after accounting for higher taxes and/or lower benefits, according to the Congressional Budget Office. CBO also found that workers with earnings between 50 and 100 percent of the poverty line typically keep 77 percent of each additional dollar of earnings. Workers with earnings just above the poverty line typically keep about two-thirds of each additional dollar earned.
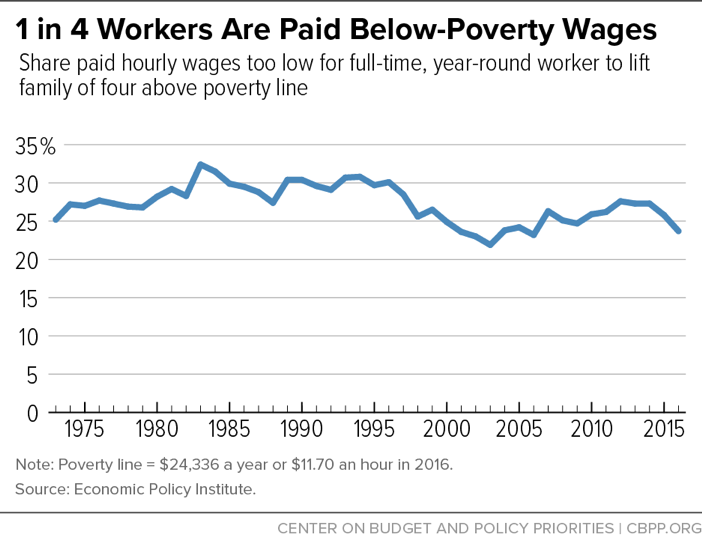
Many jobs pay too little to support a family. In 2016, 24 percent of workers were paid hourly wages too low to lift a family of four above the poverty line even if the worker worked full time all year (40 hours a week for 52 weeks), according to the Economic Policy Institute. In 1973, the share was similar: 25 percent.
Part IV: Economic Security Programs Provide Long-Term Positive Effects
A National Academy of Sciences committee of experts recently concluded that “the weight of the causal evidence indicates that income poverty itself causes negative child outcomes, especially when it begins in early childhood and/or persists throughout a large share of a child’s life. Many programs that alleviate poverty … have been shown to improve child well-being.” Many research studies have found that low-income children whose families participate in these programs achieve lasting improvements in education, health, and other outcomes.
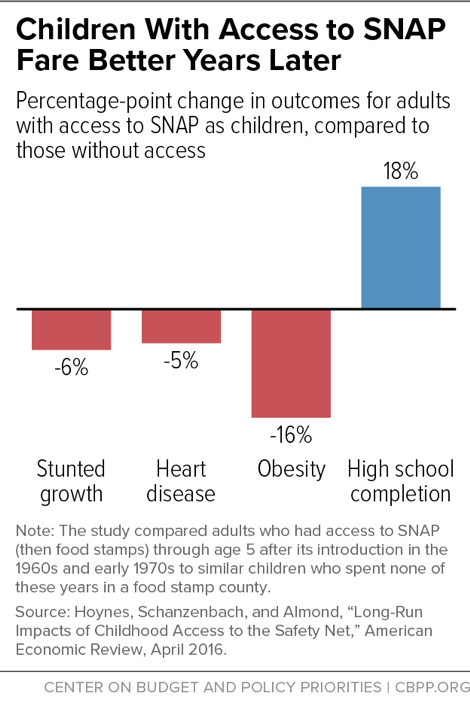
Children with access to food stamps in the 1960s and 1970s grew up healthier and were more likely to finish school. A study of what happened when food stamps (now called SNAP) gradually expanded nationwide in the 1960s and early 1970s found that disadvantaged children who had access to food stamps in early childhood and whose mothers had access during pregnancy had better health and educational outcomes as adults than children who didn’t have access to food stamps.
Among other things, children with access to food stamps were less likely in adulthood to have stunted growth, be diagnosed with heart disease, or be obese. They also were more likely to graduate from high school.
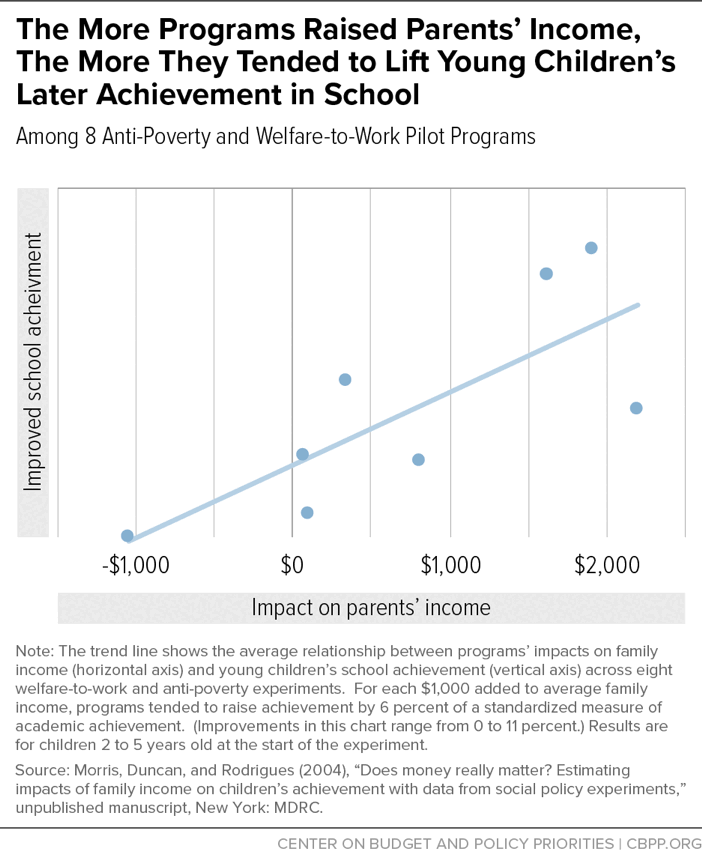
Programs that supplement families’ incomes improve children’s educational and other outcomes, evidence suggests. Many studies have linked increases in tax credits for working families with better health and educational outcomes for children. Gordon Berlin, president of MDRC, the leader in evaluation of welfare-to-work programs, has reported that “We have reliable evidence involving thousands of families in multiple studies demonstrating that ‘making work pay’ [by supplementing low earnings] causes improvements in young children’s school performance.”
Particularly compelling evidence that income support can help poor children succeed in school comes from a series of cross-program comparisons of several welfare-to-work and anti-poverty pilot programs in the United States and Canada in the 1990s. When programs provided more generous income assistance, the comparisons consistently showed better academic performance among young children transitioning into school. Assessing the cross-program data, researchers concluded that “young children’s school achievement is improved by the income gains generated by these programs but is not affected by changes in parental employment and welfare receipt occurring at the same time.” Other studies using other data and methods have found similar effects.
Another study tracked changes in families’ income over time from various sources. For children in low-income families, it found that an annual income boost of $3,000 (in 2005 dollars) between the children’s prenatal year and fifth birthday was associated with earning an average of 17 percent more as adults, and working 135 hours more annually, than similar children whose families did not obtain that income boost. The additional 135 hours of work is nearly a third of the gap in adult work hours between children raised in poor families and children raised in families with incomes exceeding twice the poverty line.
Evidence of tax credits’ positive effects begins early in life, several studies have found. Infants whose mothers were eligible for federal tax credit expansions or lived in a state that enacted a state EITC tended to experience the greatest improvements in birth weight — an early health indicator that strongly predicts children’s longer-term health outcomes, educational attainment, and early adult earnings. Studies have also linked living in a state that recently enacted or enlarged a state EITC with significant reductions in mothers’ mental stress.
In addition, numerous studies have found that young children in low-income families do better in school if their families receive additional income from the EITC or similar supports. For example, one study concluded that raising family income through refundable tax credits (primarily the EITC) is associated with improvements in children’s reading and math test scores; these higher skills, in turn, increase the likelihood that children in the family will attend college and have higher earnings as adults. In fact, the authors project that due to skill gains related to the EITC and CTC, each dollar of income provided through the tax credits increases a child’s future earnings by more than one dollar.
Another study found that children receiving larger state or federal EITCs tend to do better academically in both the short and long term. For example, an increase of about $3,000 (in 2008 dollars) in the federal maximum EITC during the 1990s resulted in higher math test scores for the affected children at the time, as well as a 7.2 percentage-point increase in high school completion several years later and a 4.8 percentage-point increase in college enrollment by age 19.
Medicaid improves children’s health, educational, and financial outcomes later in life. Children with Medicaid have comparable access to health care as those with private insurance, and significantly greater access to care than those who are uninsured. That care has a lasting impact: Medicaid eligibility in childhood is associated with better overall health in adulthood, including a 22 percent reduction in high blood pressure, reduced likelihood of hospitalization, and reduced mortality.
Also, children eligible for Medicaid for longer periods under eligibility expansions are less likely to drop out of high school and likelier to earn a bachelor’s degree. The positive impacts of these expansions are on par with the benefits from other education reforms, such as reducing elementary school class sizes and adopting school-wide performance standards.
In addition, children with Medicaid were found to earn higher incomes and contribute more in taxes through age 28 for each additional year they were likely Medicaid-eligible as children. Researchers estimate that their increased tax payments offset 56 cents of every dollar spent on Medicaid during childhood.
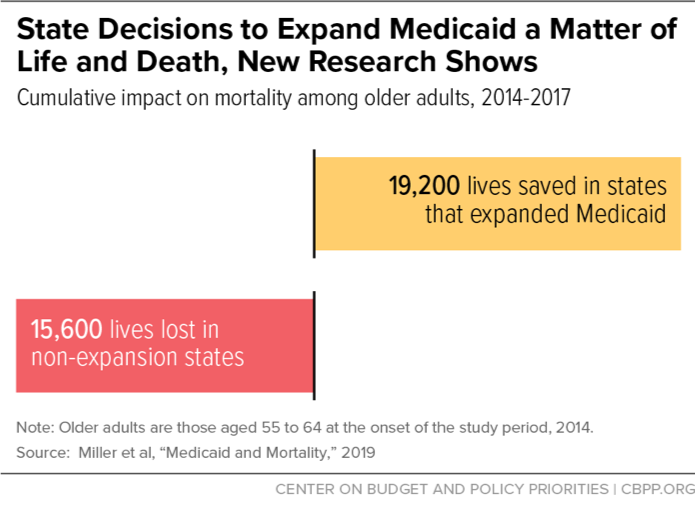
Medicaid expansion saves lives. Medicaid expansion saved the lives of at least 19,200 adults aged 55 to 64 between 2014 and 2017, a landmark study finds. Conversely, more than 15,600 older adults died prematurely because of state decisions not to expand Medicaid. Medicaid expansion ranks with other major public health interventions in terms of saving lives, the same landmark study shows. If all states had expanded Medicaid, the number of lives saved just among older adults in 2017 would nearly equal the number of lives saved by seatbelts among people of all ages.
Part V: Programs Provide a Limited Safety Net
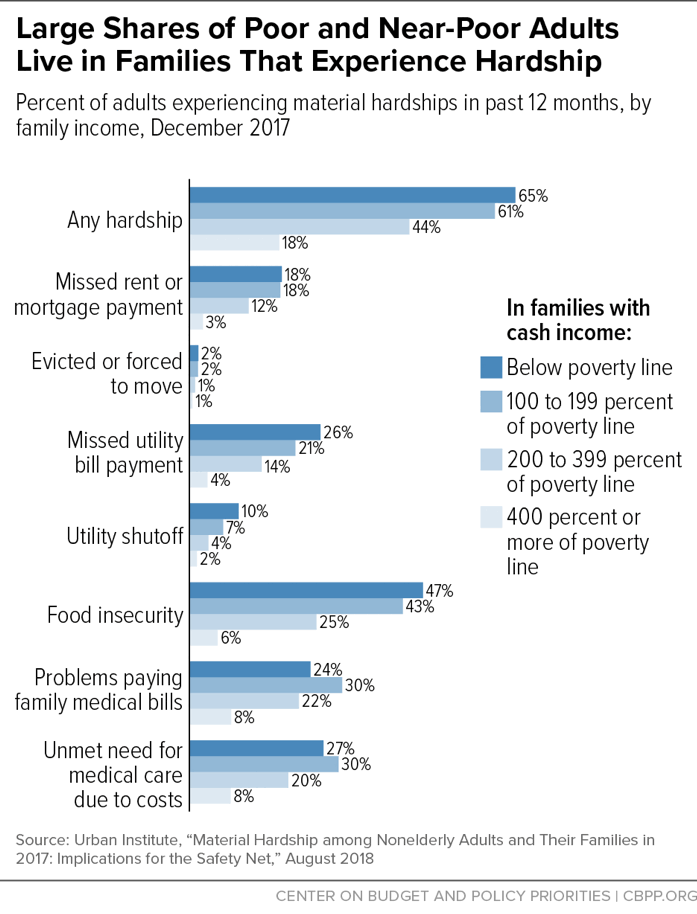
Many households continue to face hardships. In 2017, nearly two-thirds of adults below the federal poverty line reported that they or their families had trouble meeting at least one of seven measures of basic needs for food, health care, housing, or utilities, an Urban Institute study found. For example, they were unable to keep up with monthly rent payments, had utilities cut off, didn’t always have enough food, or had problems paying family medical bills.
While material hardships are highest in families with cash incomes below the poverty line, they also remain high among near-poor families. Sixty-one percent of adults in families with incomes between 100 and 200 percent of the poverty line reported that they or their families faced one or more of the seven hardships measured by the Urban Institute Well-Being and Basic Needs Survey. This reflects both the modest amount of assistance that near-poor households receive and the low level of the poverty line itself.
These findings are generally consistent with Census survey data. A CBPP analysis of Census data indicates that 51 percent of poor children lived in households that experienced at least one of three serious hardships in 2013: “low food security” (i.e., problems affording adequate food), falling behind on rent or mortgage payments, or falling behind on utility payments. Roughly 2 in 5 children in near-poor families faced such hardships, too. This is especially troubling in light of growing evidence that young children whose families struggle to afford the basics may be exposed to high levels of stress that can hinder children’s healthy brain development and future academic achievement.
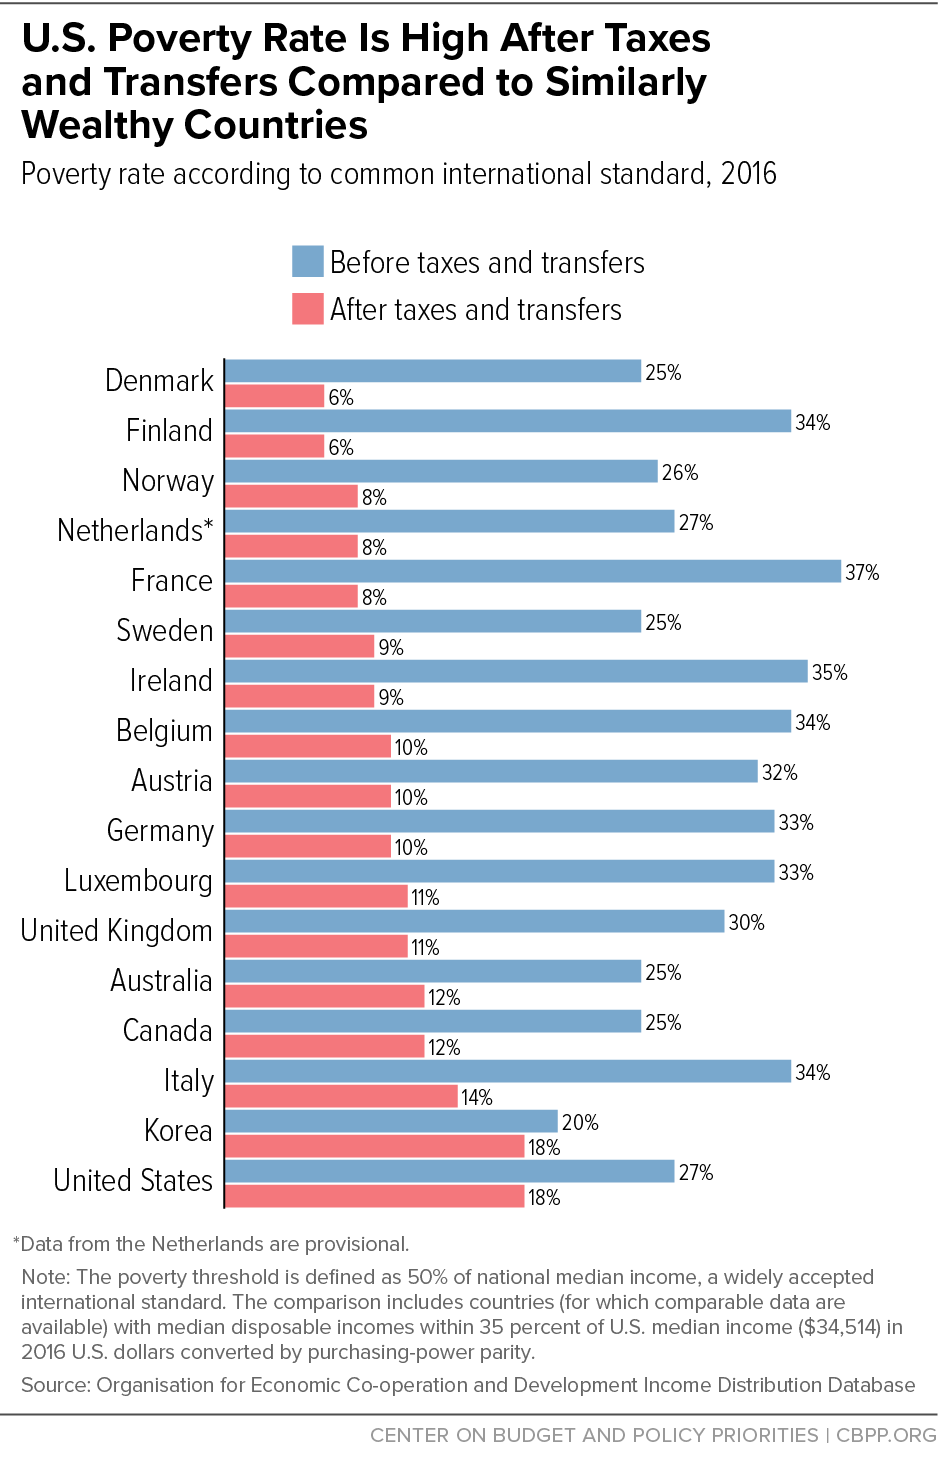
Other countries do more than the United States to reduce poverty. Many other wealthy countries’ poverty rates are similar to (or even higher than) the U.S. rate before factoring in the impact of economic security programs. But these countries have lower poverty rates — sometimes much lower — after counting benefits from government programs. This reflects the fact that nearly all of these other countries do more to fight poverty: their programs are more generous, more accessible, and broader in scope than those in the United States.