Recent Increase in SNAP Purchasing Power Invests in Children’s Health and Well-Being

Congress in the bipartisan 2018 farm bill directed the U.S. Department of Agriculture (USDA) to update the Thrifty Food Plan (TFP), which is used to set benefit levels for the Supplemental Nutrition Assistance Program (SNAP), to more accurately reflect the cost of a healthy diet.[1] This science-driven reevaluation, completed in August 2021, increased the purchasing power of SNAP benefits effective in October 2021 for the first time in decades. (Previously, the TFP had been adjusted only for inflation since the 1970s.) The added benefits are helping families, including those with children, afford a healthy diet.

SNAP forms a critical foundation for the health and well-being of children, delivering more nutrition assistance to low-income children than any other federal program. SNAP lifts millions of families with children out of poverty, reduces the depth and severity of poverty for millions more, and alleviates food insecurity. SNAP’s support also can have important, long-lasting effects, studies show — improving health, education, and economic outcomes that extend from childhood into adulthood.

A large body of research found that, prior to the TFP revision, SNAP benefits fell well short of what households need to ensure a healthy diet; many households ran out of benefits before month’s end, which increased their risk of food insecurity.[2] The revised TFP increased maximum benefits by 21 percent. Though this increase sounds large, average benefits rose from only about $4.25 per person per day (not counting temporary, pandemic-related increases) to about $5.45 per person per day in fiscal year 2022 — a modest but meaningful increase for millions of households. For households with children, the revised TFP raised average monthly benefits from $420 to $542. Roughly two-thirds of the added benefits from the TFP increase — or $1 billion per month — are going to households with children; 40 percent are going to households with income below 50 percent of the federal poverty level. (See Table 1 for state-by-state impacts.) The TFP increase will lift more than 1 million children above the poverty line.

Households With Children, Children of Color More Likely to Be Food Insecure

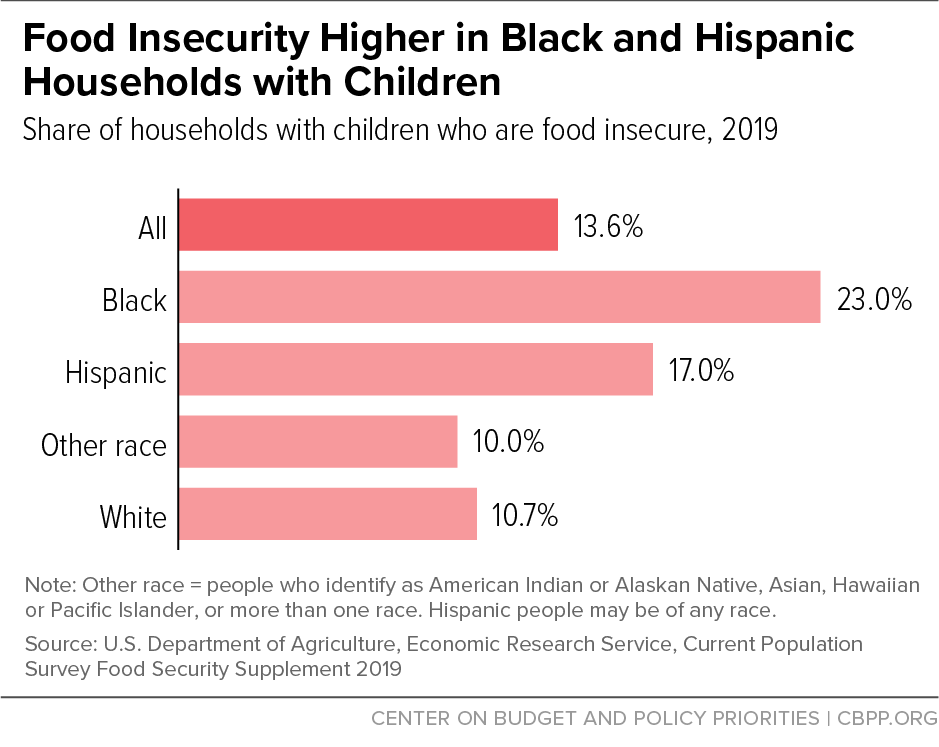
In 2019 (before the TFP increase and temporary pandemic-related benefits), 13.6 percent of households with children under age 18 experienced food insecurity, compared to 9.3 percent of households without children.[3] Children of color face even higher rates of food insecurity. Nearly 1 in 4 Black households with children and more than 1 in 6 Hispanic households with children (based on the race or ethnicity of the parent) were food insecure in 2019, compared to roughly 1 in 10 white households with children.[4] (See Figure 1.)

Food insecurity can have lasting negative consequences for children’s health and development.[5] Studies link food insecurity among children with reduced intake of some key nutrients, health problems, behavioral issues, and mental health conditions. These problems, in turn, can lower children’s test scores, their likelihood of graduating from high school, and their future earnings. Moreover, parents struggling to meet basic needs often report high levels of stress, which can have serious consequences for their children’s emotional and behavioral outcomes.

Even short periods of food insecurity pose long-term risks for children. Conversely, interventions that provide access to affordable food and reduce food insecurity have been linked to better health for young children as well as long-term improvements in health and longevity, greater high school completion, and higher earnings and self-sufficiency in adulthood.[6]

More Adequate SNAP Benefits Reduce Food Insecurity, Improve Long-Term Well-Being

Research shows more adequate SNAP benefits can reduce food insecurity. This, in turn, can have positive long-term impacts such as supporting economic mobility and reducing health care costs. Children participating in SNAP face lower risks of nutritional deficiencies and poor health, which can affect their health over their lifetimes. SNAP also can help children succeed in school. One study, for example, found that test scores among students in SNAP households are highest for those receiving benefits two to three weeks before the test. This suggests that SNAP does more to ensure an adequate diet before the end of the month, when benefits often run out, and that students learn better during the weeks when they have had access to more adequate food.[7]

The revised TFP has not been in place long enough for researchers to assess its impact on food security, nutrition, and health; nor have the temporary expansions in food assistance put in place during the pandemic. Nevertheless, some important lessons can be drawn from a similar (albeit smaller and temporary) increase in SNAP benefits made in response to the Great Recession. The 2009 Recovery Act increased maximum SNAP benefits by 13.6 percent in April 2009; benefits remained higher than they would have been until November 2013, when most participants saw their benefits reduced. Taking advantage of this natural experiment, researchers found that the temporary benefit increase:

  • Reduced food insecurity and increased spending on food and other essentials. Researchers at USDA’s Economic Research Service, for example, found that food expenditures by low-income households increased by about 5 percent and food insecurity declined by 2 percentage points from 2008 to 2009.[8] Conversely, food insecurity rose as the Recovery Act increase was eroded by inflation and eventually ended in November 2013.[9]
  • Improved children’s access to health care. Specifically, children in households eligible for SNAP were less likely than children in households with income slightly above the SNAP eligibility threshold to forgo or delay needed medical care and medications because they could not afford it, one study found.[10] This suggests that families may redirect funds to improve their children’s use of health care, particularly prescription drugs, when they receive additional resources to purchase food.
  • Fewer nutrition-related health risks. There is some evidence that the Recovery Act increase in SNAP benefits was associated with healthier weight outcomes among low-income youth.[11] Other research, not directly tied to the Recovery Act increase, has linked higher SNAP benefits with fewer emergency room visits to treat childhood asthma.[12]

Recent research also suggests that raising SNAP benefits not only increases low-income households’ spending on food but also improves the nutritional quality of their diets. Economists simulating an increase in SNAP benefits equivalent to the 2021 TFP increase, based on the food purchasing patterns of SNAP households, found that it resulted in increases in food spending (with larger increases for food prepared at home) as well as small but statistically significant improvements in the nutritional quality of food purchases. The positive effects were slightly larger for households with children. Among households with children, the benefit increase is projected to increase the relative amount of total fruit and whole fruit purchased and the quantity of several key nutrients, such as iron and calcium, by 6.5 to 7.7 percent.[13]

More Adequate SNAP Benefits Also Reduce Child Poverty

A major report from the National Academies of Sciences, Engineering, and Medicine documented compelling evidence of SNAP’s poverty-reducing importance in the lives of children and their families.[14] SNAP is second only to the combined effects of the Earned Income Tax Credit (EITC) and the refundable portion of the Child Tax Credit in lifting children above the poverty line, and no program is more effective than SNAP in lifting children out of deep poverty (income less than half of the poverty line). SNAP also improves food security and health outcomes for children and their families.

Of the 2.4 million people whom the TFP increase will lift above the poverty line, more than 1 million are children.[15] The increase will cut the number of children participating in SNAP whose families have annual incomes (including SNAP and other government benefits) below the poverty line by 15 percent and reduce the number of children in poverty overall by 12 percent, we estimate. It will reduce the severity of poverty for another 20.5 million people, including 6.2 million children.[16]

TABLE 1
Estimated Monthly Increase in SNAP Benefits From TFP Revision for Households With Children in Fiscal Year 2022, by State
State Estimated number of SNAP participants in households with childrena (thousands) Average monthly benefit increase per person in households with children Estimated total monthly benefit increase statewide to households with children (millions) Share of increase to all SNAP households going to those with children Share of increase to households with children going to those with lowest incomeb
Alabama 545 $37 $20 71% 46%
Alaska 63 $65 $4 67% 38%
Arizona 544 $36 $20 68% 47%
Arkansas 231 $37 $8 74% 50%
California 2,985 $36 $109 65% 43%
Colorado 348 $37 $13 66% 37%
Connecticut 203 $37 $7 54% 35%
Delaware 78 $37 $3 67% 48%
District of Columbia 79 $36 $3 53% 45%
Florida 1,715 $37 $63 60% 39%
Georgia 1,169 $37 $43 72% 43%
Guam 29 $52 $2 75% 41%
Hawai'i 104 $76 $8 57% 37%
Idaho 93 $37 $3 73% 46%
Illinois 1,308 $37 $48 66% 37%
Indiana 458 $37 $17 73% 44%
Iowa 195 $36 $7 69% 36%
Kansas 140 $36 $5 70% 41%
Kentucky 377 $37 $14 70% 49%
Louisiana 615 $37 $23 71% 51%
Maine 88 $37 $3 56% 27%
Maryland 543 $37 $20 63% 32%
Massachusetts 535 $36 $19 52% 28%
Michigan 793 $36 $29 61% 38%
Minnesota 274 $37 $10 65% 40%
Mississippi 307 $36 $11 76% 55%
Missouri 468 $37 $17 70% 48%
Montana 58 $36 $2 64% 51%
Nebraska 112 $36 $4 71% 43%
Nevada 275 $36 $10 63% 40%
New Hampshire 44 $37 $2 63% 23%
New Jersey 579 $36 $21 63% 25%
New Mexico 366 $37 $13 65% 33%
New York 1,525 $37 $56 52% 32%
North Carolina 1,184 $37 $43 72% 35%
North Dakota 33 $36 $1 67% 45%
Ohio 974 $36 $36 65% 43%
Oklahoma 452 $37 $17 70% 47%
Oregon 355 $37 $13 51% 35%
Pennsylvania 1,120 $37 $41 60% 29%
Rhode Island 75 $37 $3 53% 35%
South Carolina 464 $37 $17 78% 52%
South Dakota 50 $36 $2 68% 56%
Tennessee 592 $37 $22 70% 57%
Texas 2,761 $36 $100 79% 44%
Utah 121 $36 $4 76% 46%
Vermont 37 $36 $1 52% 28%
Virginia 558 $37 $21 69% 41%
Virgin Islands 16 $47 $1 65% 46%
Washington 468 $36 $17 54% 41%
West Virginia 181 $36 $7 61% 50%
Wisconsin 473 $36 $17 67% 30%
Wyoming 22 $36 $1 73% 38%
United States 27,235 $37 $1,002 66% 40%

a Participants in households with children as share of all participants in fiscal year (FY) 2019 SNAP household characteristics data applied to average FY 2022 USDA SNAP administrative data, available for October 2021 through March 2022, as of June 2022, https://www.fns.usda.gov/pd/supplemental-nutrition-assistance-program-snap.

b Households with income at or below 50 percent of the federal poverty level.

Source: CBPP analysis of FY 2019 SNAP household characteristics data with income and expenses inflated to FY 2022 and FY 2022 benefit parameters applied. Estimates exclude temporary COVID-19 changes to eligibility or benefit levels.

Topics:

End Notes

[1] U.S. Department of Agriculture, “Thrifty Food Plan, 2021,” August 2021, https://FNS.usda.gov/TFP; Joseph Llobrera, Matt Saenz, and Lauren Hall, “USDA Announces Important SNAP Benefit Modernization,” CBPP, August 25, 2021, https://www.cbpp.org/research/food-assistance/usda-announces-important-snap-benefit-modernization.

[2] Steven Carlson, Joseph Llobrera, and Brynne Keith-Jennings, “More Adequate SNAP Benefits Would Help Millions of Participants Better Afford Food,” CBPP, updated July 15, 2021, https://www.cbpp.org/research/food-assistance/more-adequate-snap-benefits-would-help-millions-of-participants-better.

[3] We use data from the 2019 Current Population Survey Food Security Supplement, before Congress made temporary changes to SNAP during the COVID-19 pandemic. The rate of food insecurity among household with children rose slightly in 2020 to 14.8 percent, but relief measures prevented food insecurity from rising more than it did. See CBPP, “Robust COVID Relief Achieved Historic Gains Against Poverty and Hardship, Bolstered Economy,” February 24, 2022, https://www.cbpp.org/research/poverty-and-inequality/robust-covid-relief-achieved-historic-gains-against-poverty-and.

[4] In 2020, racial and ethnicity disparities in food insecurity rates among households with children worsened. The rate of food insecurity rose for Black households with children (to 27.3 percent) and Hispanic households with children (to 21.8 percent), while dropping (to 9.7 percent) for white households with children.

[5] Brynne Keith-Jennings, Catlin Nchako, and Joseph Llobrera, “Number of Families Struggling to Afford Food Rose Steeply in Pandemic and Remains High, Especially Among Children and Households of Color,” CBPP, April 27, 2021, https://www.cbpp.org/research/food-assistance/number-of-families-struggling-to-afford-food-rose-steeply-in-pandemic-and.

[6] Claire Zippel and Arloc Sherman, “Bolstering Family Income Is Essential to Helping Children Emerge Successfully From the Current Crisis,” CBPP, updated February 25, 2021, https://www.cbpp.org/research/poverty-and-inequality/bolstering-family-income-is-essential-to-helping-children-emerge.

[7] Anna Gassman-Pines and Laura Bellows, “Food Instability and Academic Achievement: A Quasi-Experiment Using SNAP Benefit Timing,” American Educational Research Journal, Vol. 55, No. 5, 2018, https://journals.sagepub.com/doi/10.3102/0002831218761337.

[8] Mark Nord and Mark Prell, “Food Security Improved Following the 2009 ARRA Increase in SNAP Benefits,” Economic Research Service, USDA, April 2011, https://www.ers.usda.gov/publications/pub-details/?pubid=44839; Jiyoon Kim, “Do SNAP participants expand non-food spending when they receive more SNAP Benefits?—Evidence from the 2009 SNAP benefits increase,” Food Policy, Vol. 65, December 2016, https://www.sciencedirect.com/science/article/abs/pii/S0306919216304341.

[9] Although the analysis does not focus specifically on families with children, its conclusions are relevant since nearly half of all SNAP households include children and two-thirds of all participants live in families with children. Mark Nord, “Effects of the Decline in the Real Value of SNAP Benefits From 2009 to 2011,” Economic Research Service, USDA, August 2013, https://www.ers.usda.gov/publications/pub-details/?pubid=45102; Bhagyashree Katare and Jiyoon Kim, “Effects of the 2013 SNAP Benefit Cut on Food Security,” Applied Economic Perspectives and Policy, Vol. 39, No. 4, December 2017, https://onlinelibrary.wiley.com/doi/abs/10.1093/aepp/ppx025.

[10] Most children in families with low incomes were eligible for Medicaid and the Children’s Health Insurance Program (CHIP) even before the Affordable Care Act. In the study sample, approximately 6 percent of low-income children had delayed care due to cost. Three percent and 4 percent of children in low-income households and low-income single-parent households, respectively, reported needing health care but not being able to afford it. Taryn Morrissey and Daniel Miller, “Supplemental Nutrition Assistance Program Participation Improves Children’s Health Care Use: An Analysis of the American Recovery and Reinvestment Act’s Natural Experiment,” Academic Pediatrics, Vol. 20, No. 6, August 2020, https://www.sciencedirect.com/science/article/abs/pii/S1876285919304619.

[11] Katelin Hudak and Elizabeth Racine, “Do additional SNAP benefits matter for child weight?: Evidence from the 2009 benefit increase,” Economics & Human Biology, Vol. 41, May 2021, https://www.sciencedirect.com/science/article/abs/pii/S1570677X20302367#.

[12] Colleen Heflin et al., “SNAP benefits and childhood asthma,” Social Science & Medicine, Vol. 220, January 2019, https://www.sciencedirect.com/science/article/abs/pii/S0277953618306294.

[13] Michele Ver Ploeg and Chen Zhen, “Changes in SNAP Benefit Levels and Food Spending and Diet Quality: Simulations from the National Household Food Acquisition and Purchase Survey,” CBPP, May 12, 2022, https://www.cbpp.org/research/food-assistance/changes-in-snap-benefit-levels-and-food-spending-and-diet-quality.

[14] National Academies of Sciences, Engineering, and Medicine, A Roadmap to Reducing Child Poverty, National Academies Press, 2019, http://sites.nationalacademies.org/dbasse/bcyf/reducing_child_poverty/index.htm.

[15] In 2017, SNAP kept about 6.5 million people above the poverty line, including 3.1 million children, according to a CBPP analysis that uses a version of the Supplemental Poverty Measure (SPM) — which, among other differences from the “official” poverty measure, counts non-cash benefits (like SNAP) and refundable tax credits — and corrects for households’ underreporting of benefits. The SPM also subtracts federal and state income taxes, federal payroll taxes, and certain non-discretionary expenses (such as out-of-pocket health costs and child care) from income when calculating what resources a family has available to buy basics such as food, clothing, and shelter. Under the SPM, a family is considered to be in poverty if its resources are below a poverty threshold ($27,005 for a two-adult, two-child family renting in an average-cost community in 2017) that accounts for differences in family composition and geographic differences in housing costs.

[16] These CBPP estimates are based on the U.S. Census Bureau’s March 2018 Current Population Survey, using tax year 2017 tax rules that account for the Tax Cuts and Jobs Act. The estimates include corrections for underreported benefits from SNAP, Supplemental Security Income, and Temporary Assistance for Needy Families from the Department of Health and Human Services/Urban Institute Transfer Income Model (TRIM). The estimates reflect a pre-pandemic economy and do not account for temporary measures enacted to reduce hardship during the pandemic, such as the temporary increase in the Child Tax Credit.