Long-Term Budget Outlook Has Improved Substantially Since 2010 But Remains Challenging
The federal debt is expected to continue rising gradually as a percent of the economy under current budget policies, new CBPP projections of the long-term fiscal outlook show. We project the path of debt over the next 25 years to be virtually identical to the path we projected last year, though compared with the outlook in 2010, the nation’s projected long-term finances have notably improved (see Figure 1), largely due to significant reductions in prospective health care cost growth and interest rates.
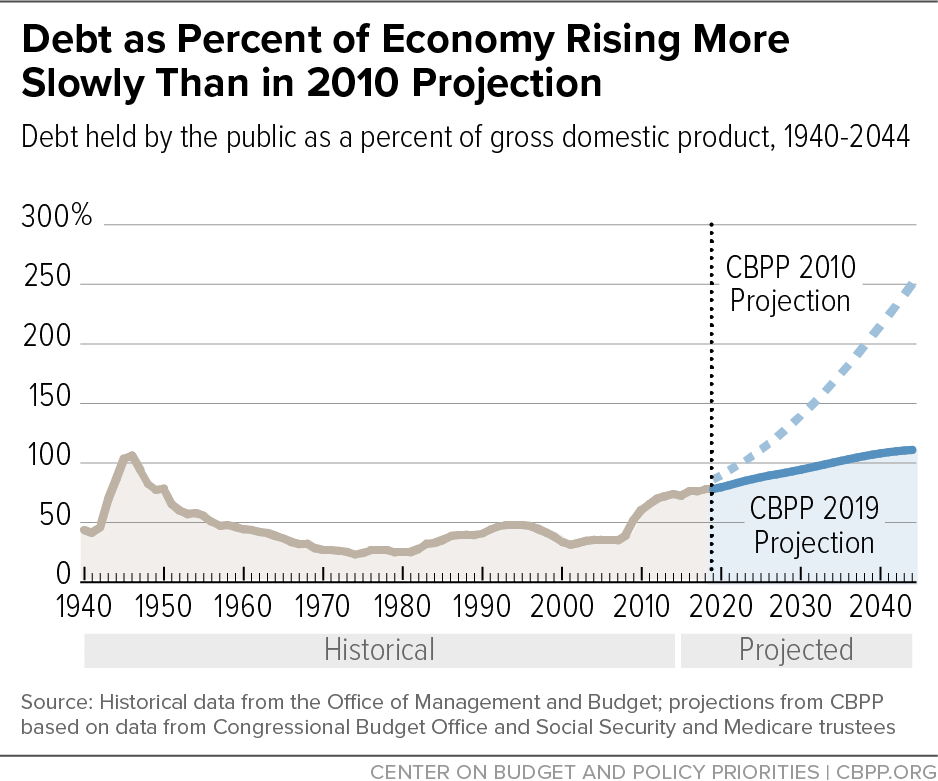
Compared with the outlook in 2010, the nation’s projected long-term finances have notably improved.Under our projections of current law and policies, the federal debt will rise in relation to the economy over the coming decades. The ratio of debt to gross domestic product (GDP) — currently 78 percent — will grow to 93 percent by 2029. Growth will then slow slightly but not halt, with the estimated debt-to-GDP ratio reaching 111 percent by 2044, the last year our projections cover. The estimated “fiscal gap” through 2044 — that is, the average amount of annual deficit reduction needed to stabilize the debt ratio at its current level — is 1.5 percent of GDP.
A stable or declining debt-to-GDP ratio is a common goal for fiscal stability. Although an increase in the debt ratio is appropriate when the economy is operating well below its potential, as in the Great Recession and ensuing sluggish recovery, a rising debt ratio in a strong, high-employment economy can, if sustained over the longer run, ultimately reduce economic growth and future national income and might eventually jeopardize financial stability. While acting to limit the growth of projected debt-to-GDP ratios is appropriate, policymakers should accomplish this through carefully designed policies that include significant additional revenues and impose costs on those best able to bear them. (See box.)
Our new projections update those we published in November 2018[1] to reflect the latest projections by the Social Security and Medicare trustees, and to reflect Congressional Budget Office (CBO) ten-year and long-term budget projections issued in May and June 2019, respectively. We have updated those CBO projections in two ways:
- We incorporate the noticeably lower interest rates CBO projected in August 2019.
- We incorporate the costs of the recent agreement on appropriations for 2020 and 2021, enacted as the Bipartisan Budget Act of 2019 (BBA). That agreement precluded the steep cut in appropriations for 2020 and 2021 that had been required under the 2011 Budget Control Act (BCA), as further reduced by the sequestration cuts triggered by that Act. The BBA instead provided modest increases, relative to the 2019 level. Our estimates project future funding levels starting from the BBA’s 2021 level, whereas CBO’s May and June projections started from the much lower 2021 level required under the BCA. Nonetheless, the levels of appropriations that we now project still decline as percentages of GDP over time and shortly fall below the lowest levels on record, with data going back to 1962. (See Appendix 1 for details on our projection methodologies.)
Our new estimates show essentially identical debt ratios to those we projected in 2018, with annually appropriated (“discretionary”) programs declining less rapidly than we projected last year because of the BBA but with lower interest rates fully offsetting those higher costs. We project a slightly larger fiscal gap than we did last year: 1.5 percent of GDP rather than 1.4 percent.
The deficit as a percent of GDP declined from its 2009 peak, during the Great Recession, to reach a low point of 2.4 percent of GDP in 2015 — a deficit sufficiently small that the debt ratio declined that year. But deficits started growing faster than the economy in 2016 and are now expected to increase further over the next several years, in part due to the 2017 tax law, the Bipartisan Budget Act of 2018 (which raised appropriations for 2018 and 2019), and the recent 2019 BBA.
Moreover, much of the 2017 tax cuts and some other aspects of tax law are temporary, with most of their costs expiring after 2025. If policymakers made current tax policies permanent without offsetting the cost, our projected debt ratio in 2044 would rise from 111 to 139 percent and our 25-year fiscal gap would rise from 1.5 to 2.8 percent of GDP. These cost increases would exceed the 25-year costs of the 2019 BBA.
Our long-run budget projections are not a prediction. Rather, we estimate the budget outlook if policymakers continue laws and policies as they currently exist or are scheduled to take effect. That is, our projections assume no future legislation that would either reduce or expand deficits, meaning that offsetting savings are assumed to fully cover any future tax cuts or spending increases.
The remainder of this report: 1) shows the revenue and spending outlook for the next 25 years under our assumptions; 2) compares our current projections with those in 2010; 3) quantifies the deficit reduction needed over the next 25 years to stabilize the debt-to-GDP ratio (that is, to close the fiscal gap); and 4) shows the effect on projected debt if policymakers close shortfalls in the Social Security and Medicare Hospital Insurance trust funds (either through increased revenues or reduced benefits), or if they extend expiring aspects of the tax code. Appendix 1 details our projection methodology and quantifies how our projections differ from CBO’s.
Revenue and Spending Outlook Through 2044
Revenues
The 2017 tax law, layered on top of the permanent tax cuts in the American Taxpayer Relief Act of 2012, reduced federal revenues to 16.5 percent of GDP in 2019, well below the 17.4 percent average over the last 40 years and even further below the 18.4 percent average in years when the economy was operating at or near its full capacity.
Most of the individual income tax cuts in the 2017 tax law are scheduled to expire after 2025. Because of that expiration and other factors, federal revenues are projected to rise over the next 25 years to 19.2 percent of GDP by 2044, or roughly the level in the final years of the Clinton Administration. Almost half of this revenue growth stems from rising real incomes, which push some income into higher tax brackets (so-called “real bracket creep”). Most of the rest is due to scheduled tax changes that will raise revenue.[2] These include not only the expiration of the individual income tax cuts enacted in 2017 but also the scheduled (albeit delayed) implementation of the Affordable Care Act’s (ACA) excise tax on high-cost health plans (the so-called “Cadillac tax”) — which policymakers haven’t allowed to take effect and are moving to repeal — and the expiration of some tax breaks that are nominally temporary but are periodically renewed. If these scheduled tax changes are not allowed to take effect, revenues will be 1.2 percent of GDP lower in 2029 than projected under these current-law estimates (they will be just 17.0 percent of GDP); the 25-year fiscal gap will rise substantially, from 1.5 percent of GDP to 2.8 percent; and the projected 2044 debt ratio will rise from 111 percent of GDP to 139 percent. Receipts from sources other than the individual income tax are projected to increase only slightly as a percentage of GDP.
Avoiding further tax cuts would prevent the fiscal gap from worsening but not stabilize the debt-to-GDP ratio. An aging population and rising health care costs will necessarily drive up spending for Social Security, Medicare, and Medicaid, as described below. Policymakers will need to raise revenue and to look for spending reforms that represent sound policy and wouldn’t increase poverty, racial inequity, or inequality.[3]
Spending
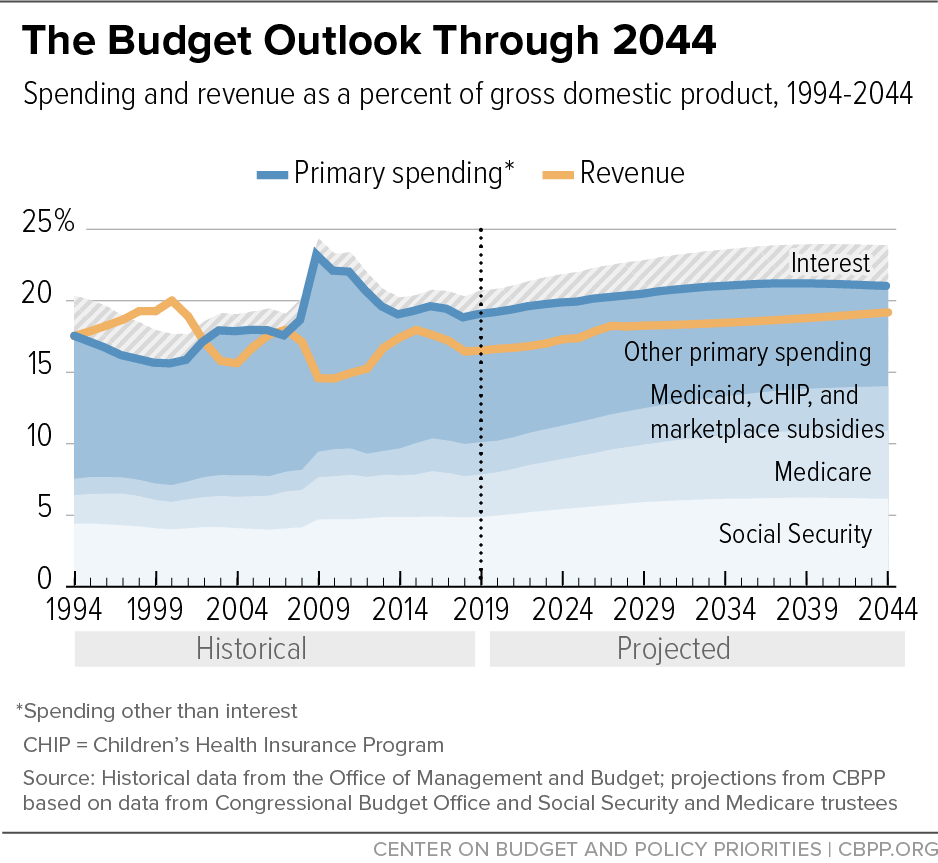
We project that federal spending will rise from 20.7 percent of GDP in 2019 to 23.9 percent in 2044. Five-eighths of the rise stems from primary, or non-interest, spending — that is, rising spending on programs that pay benefits to individuals or households or carry out the functions of government. (See Figure 2 and Table 1.) The rest stems from interest costs: interest rates ultimately will rise somewhat as existing debt that was financed at historically low interest rates rolls over to higher rates and as the federal debt gradually mounts.
If revenues fully covered the rise in primary spending, the projected debt ratio would decline every year, even with rising interest rates.[4] But as Figure 2 and Table 1 show, revenues are projected to remain significantly below primary spending.
Primary (Non-Interest) Spending
The composition of federal non-interest spending will change significantly by 2044. Because of an aging population and rising health care costs, Social Security, Medicare, Medicaid, and health insurance subsidies will grow substantially — both as a percentage of GDP and as a share of total non-interest spending — while all other programs as a whole will shrink by both measures. Social Security and the major health programs will rise from 53 percent of non-interest spending in 2019 to 67 percent by 2044.
| TABLE 1 | ||||||||||
|---|---|---|---|---|---|---|---|---|---|---|
| Outlays, Revenues, Deficits, and Debt as Percent of GDP Through 2044 | ||||||||||
| Social Security | Medicare | Medicaid, CHIP, and marketplace subsidies | Other program outlays | Total program outlays | Net interest | Revenues | Deficit (+) / Surplus (-) | Debt held by public | ||
| 1999 | 4.1% | 2.0% | 1.1% | 8.3% | 15.5% | 2.4% | 19.3% | -1.3% | 38% | |
| 2004 | 4.1% | 2.2% | 1.5% | 9.9% | 17.7% | 1.3% | 15.6% | 3.4% | 36% | |
| 2009 | 4.7% | 2.9% | 1.8% | 13.6% | 23.1% | 1.3% | 14.6% | 9.8% | 52% | |
| 2014 | 4.9% | 2.9% | 1.9% | 9.2% | 18.9% | 1.3% | 17.4% | 2.8% | 74% | |
| 2019 | 4.9% | 3.0% | 2.3% | 8.8% | 18.9% | 1.8% | 16.5% | 4.2% | 78% | |
| 2024 | 5.4% | 3.5% | 2.3% | 8.5% | 19.7% | 2.1% | 17.3% | 4.6% | 87% | |
| 2029 | 5.9% | 4.0% | 2.5% | 7.9% | 20.3% | 2.5% | 18.3% | 4.6% | 93% | |
| 2034 | 6.1% | 4.4% | 2.7% | 7.6% | 20.9% | 2.7% | 18.5% | 5.1% | 100% | |
| 2039 | 6.2% | 4.7% | 2.9% | 7.2% | 21.1% | 2.9% | 18.8% | 5.2% | 107% | |
| 2044 | 6.2% | 4.7% | 3.1% | 6.9% | 20.9% | 3.0% | 19.2% | 4.7% | 111% | |
Social Security. Benefits under Old-Age, Survivors, and Disability Insurance (commonly known as Social Security) will rise slowly but steadily in the next two decades — from a bit under 5 percent of GDP in 2019 to over 6 percent in the 2030s — and then stabilize. That pattern largely mirrors the aging of the population and is dampened by the scheduled rise in the program’s full retirement age, which historically was 65, is now 66½, and will gradually climb to 67 by 2022. (Each year that the full retirement age is raised lowers benefits across the board for future retirees by about 7 percent, regardless of whether they claim benefits early or work until the full retirement age or beyond.)[5]
The Debt-to-GDP Ratio
Generally, the debt-to-GDP ratio should rise during hard times or major emergencies and decline during good times, in part due to the automatic fluctuations in tax revenues and in spending on programs like unemployment insurance over the course of the business cycle. Allowing the debt-to-GDP ratio to vary also enables the government to cut taxes and increase spending to combat recessions and alleviate hardship during bad times, while creating a presumption against policies that markedly increase the debt during good times.
A stable debt-to-GDP ratio is a key test of fiscal sustainability. Increases in the dollar amount of debt, however, should not be a concern as long as the economy is growing at least as fast. Between 1946 and 1979, for example, debt held by the public grew significantly in dollar terms but — thanks to economic growth — plummeted as a percentage of GDP, from 106 percent to 25 percent.
Some suggest that exceeding a certain debt-to-GDP ratio has a sharply adverse effect on the economy. In reality, researchers have not found any particular threshold above which debt dramatically slows economic growth.a Moreover, today’s very low real (inflation-adjusted) interest rates suggest that the economy can support a higher debt-to-GDP ratio than was appropriate when the government faced much higher borrowing costs.b
All else being equal, a lower debt-to-GDP ratio is preferred because of the lower interest burden it carries and the additional flexibility it provides policymakers facing economic or financial crises. But all else is never equal. Lowering the debt ratio requires program cuts, tax increases, or both. That is why both the quantity and quality of deficit reduction are important: reducing deficits should not harm disadvantaged individuals and households, increase poverty, inequality, or racial disparities, or cut programs that can boost future productivity.
In addition, even with a higher debt ratio, the nation should use both automatic and discretionary counter-cyclical measures — temporary tax cuts and spending increases — to fight recessions.c Failure to fight recessions vigorously would not only harm the people who suffer most when times are bad but also delay or weaken a broader recovery, likely leading to shorter expansions and slower long-term growth. Similarly, when interest rates are very low, the costs of forgoing worthwhile investments due to deficit concerns may well exceed the modest adverse effects on the economy from a higher debt ratio.
a Andrea Pescatori, Damiano Sandri, and John Simon, Debt and Growth: Is There a Magic Threshold? International Monetary Fund WP/14/34, February 2014, p. 4.
b See Douglas Elmendorf and Louise Sheiner, Federal Budget Policy with an Aging Population and Persistently Low Interest Rates, Journal of Economic Perspectives, Vol. 31, No. 3, Summer 2017, pp. 175-194, https://pubs.aeaweb.org/doi/pdf/10.1257/jep.31.3.175; Olivier Blanchard, “Public Debt: Fiscal and Welfare Costs in a Time of Low Interest Rates,” PIIE Policy Brief 19-2, February 2019, https://www.piie.com/publications/policy-briefs/public-debt-fiscal-and-welfare-costs-time-low-interest-rates; and Jason Furman and Lawrence H. Summers, “Who’s Afraid of Budget Deficits? How Washington Should End Its Debt Obsession,” Foreign Affairs, March/April 2019, https://www.foreignaffairs.com/articles/2019-01-27/whos-afraid-budget-deficits.
c Chad Stone, “In a Recession, Put Deficit Concerns Aside,” Center on Budget and Policy Priorities, September 23, 2019, https://www.cbpp.org/blog/in-a-recession-put-deficit-concerns-aside.
Medicare. Net spending for Medicare benefits — that is, total payments minus the premiums that enrollees pay — are expected to rise from 3.0 percent of GDP in 2019 to 4.7 percent in 2044. Medicare faces the same demographic pressures as Social Security, plus an extra cost pressure: the tendency of medical costs, fueled by technological advances and increased utilization, to outpace GDP growth. The ACA’s cost controls and delivery system reforms, plus other developments in health care delivery, are curbing (though not eliminating) that pressure. Our projections are based on current law and assume that policymakers will retain cost-control provisions of the ACA and the Medicare Access and CHIP Reauthorization Act (MACRA).
Medicaid, CHIP, and health insurance subsidies. The joint federal-state Medicaid program provides acute health care coverage and long-term supports and services to eligible low-income people, while the Children’s Health Insurance Program (CHIP) covers many low-income children. The ACA expanded the reach of Medicaid, at state option, and created new state-based marketplaces to enable millions of people without other coverage to buy health insurance at reasonable prices, without exclusions for pre-existing conditions or other restrictions that had often made coverage unaffordable. It also provides federal subsidies to help people with low or moderate incomes afford marketplace coverage.
The ACA’s coverage expansions are the main reason that spending for this trio of programs rose from 1.6 percent of GDP in 2012 (before the expansions took effect) to 2.3 percent in 2019. Cost pressures will push this spending up to 3.1 percent of GDP in 2044.
Other program spending. This category includes many hundreds of defense and non-defense “discretionary” programs, so called because policymakers have the legal discretion to decide their funding levels each year through the appropriations process.[6] It also includes entitlement or “mandatory” programs such as SNAP (formerly known as food stamps), pensions for federal civilian and military retirees, veterans’ disability and education benefits, the refundable portions of the Earned Income Tax Credit and Child Tax Credit, Supplemental Security Income for poor people who are elderly or have disabilities, unemployment insurance, Temporary Assistance for Needy Families, farm price supports, and various smaller programs. Finally, this category includes an allowance for future natural disasters.
Over the next ten years, this broad category — which spiked at nearly 14 percent of GDP in 2009, during the depths of the economic downturn — is projected to fall as a percentage of GDP, from 8.8 percent in 2019 to 6.9 percent in 2044. Both figures are well below the 10.6 percent average of the last four decades.
Some three-quarters of the drop from 2019 to 2044 occurs in discretionary spending. Measured as a percent of GDP, defense spending is slated to fall by 2027 to its lowest level on record, while non-defense discretionary spending, including an allowance for disasters, is slated to do so in 2022. (Historical data go back to 1962.) These low and falling levels of discretionary spending as percentages of GDP are despite the BBA of 2019, which as noted has precluded the deeper cuts that were previously scheduled. Under our projections, both defense and non-defense discretionary spending continue to fall in all subsequent years as a percent of GDP.
Spending for the mandatory programs in the “other program spending” category drifts down as a percentage of GDP as well, though less rapidly than spending for discretionary programs. Unlike Social Security and the major health programs, most other mandatory programs do not face upward demographic or cost pressures.[7]
These projections of discretionary spending and mandatory spending outside of Social Security and health care programs are consistent with the historical pattern. In most cases, these categories of spending only rise at an unusual rate on a sustained basis: 1) if policymakers expand these programs, which by definition is not consistent with a projection of current law or policy; or 2) during recessions, when unemployment insurance, SNAP, and similar automatic stabilizers rise temporarily before falling back to normal levels as the economy recovers.
Interest Costs
Unlike every other spending category, net interest doesn’t reflect explicit funding decisions by policymakers. Instead, it’s jointly determined by the amount of borrowing fueled by policymakers’ revenue and spending decisions (in other words, by the debt) and by the interest rates set in financial markets.
Today, federal net interest costs constitute 1.8 percent of GDP. But CBO projects that today’s relatively low interest rates, which are holding down borrowing costs, will generally head up over the coming decade, in part because of rising federal debt. In addition, Treasury securities issued earlier in the decade, when interest rates were lower, will roll over at higher rates. As a result, by 2029, net interest costs are expected to rise by two-fifths, to 2.5 percent of GDP, even though the projected debt rises by only one-fifth (from 78 percent of GDP to 93 percent). By 2044, we project net interest to reach 3.0 percent of GDP and debt to reach 111 percent of GDP.
Stabilizing the Debt Ratio
As noted in the box, a stable debt ratio is a standard test of fiscal sustainability. The best way to determine the amount of deficit reduction needed to stabilize the debt ratio is to calculate the fiscal gap, which as CBO explains, “measures the change in spending or revenues that would be necessary to keep the ratio of debt to GDP the same at the end of a given period as at the beginning of the period.”[8] (In this context, “spending” excludes interest payments; it refers only to spending on government programs.)
Our 25-year budget projections show a fiscal gap of 1.5 percent of GDP. This means that annual revenue increases or program cuts averaging 1.5 percent of GDP over the next 25 years would hold the 2044 debt to today’s 78 percent of GDP.
A 25-year fiscal gap of 1.5 percent of GDP is big enough to be challenging. It is equivalent to 8.1 percent of revenues over the period; to eliminate the gap through revenue increases alone, projected revenues — including income taxes, payroll taxes, gasoline and other excise taxes, the estate tax, and tariffs — would need to rise by an average of 8.1 percent. Alternatively, eliminating the gap through program cuts alone would entail cutting all programs — Social Security, health care, defense, education, veterans’ benefits, law enforcement, transportation, and so on — by an average of 7.2 percent. Of course, if any tax provisions or spending programs were protected, the rest would have to be hit correspondingly harder.
Our estimate of a fiscal gap of 1.5 percent of GDP through 2044 is higher than the 1.4 percent estimate in our 2018 long-term projection, though well below the 4.5 percent estimate in our 2010 projection.
How Our Long-Term Estimates Have Changed
Since we published our 2010 long-term projections, the projected debt-to-GDP ratio has fallen substantially, as Figure 1 shows. It’s about half as high as we and others estimated in 2010 and is no longer projected to rise at explosive rates over the next 25 years. In January 2010 we projected that debt would reach 251 percent of GDP by 2044;[9] we now project 111 percent. In January 2010 we projected a fiscal gap of 4.5 percent of GDP through 2044; we now project 1.5 percent.
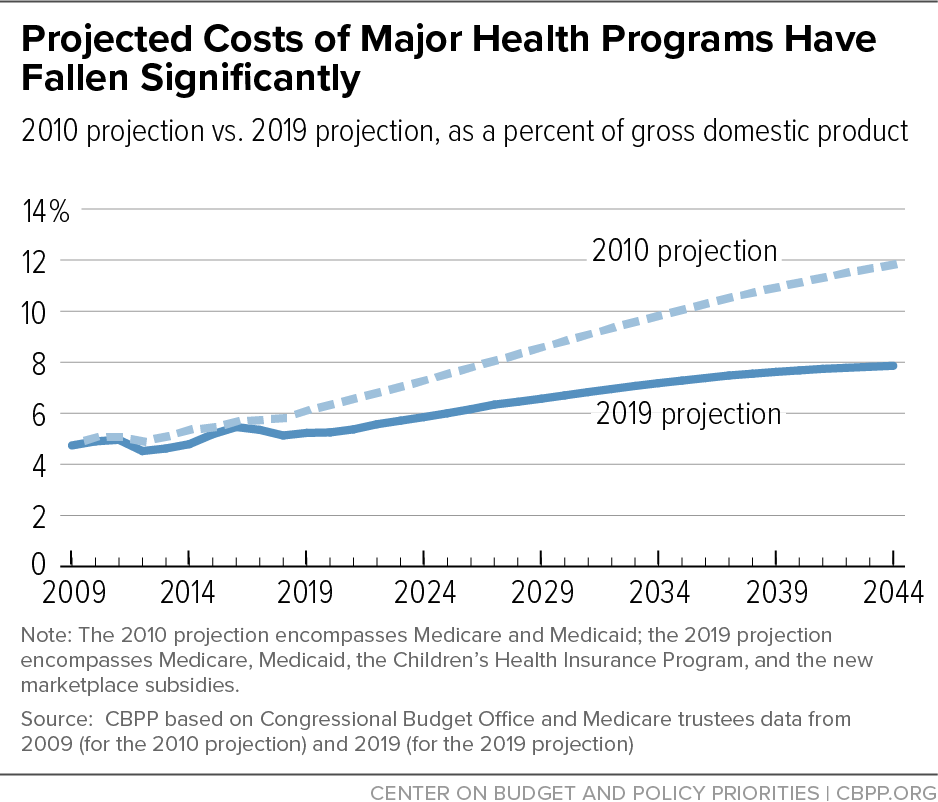
As Table 2 shows, the substantial improvement in the long-term budget outlook over the last nine years largely reflects lower health care costs and lower interest rates. The remarkable decrease in the projected costs of the major health programs — Medicare, Medicaid, health insurance subsidies, and CHIP — is shown in Figure 3. Using projections from CBO and the Medicare trustees, we estimated in January 2010 that Medicare and Medicaid together would cost 11.8 percent of GDP in 2044. The 2010 projection preceded the enactment of the ACA, with its coverage expansions. Yet the cost of those expansions is more than fully offset by a combination of factors that have slowed health cost growth. These factors are: (1) the ACA’s short- and long-term reductions in Medicare payment rates to health care providers; (2) the changes in health care payment and delivery systems initiated by the ACA and the 2015 MACRA; and (3) the growing effects of a health cost slowdown in the public and private sectors that commenced before the ACA.
| TABLE 2 | ||
|---|---|---|
| Change in CBPP’s Projections Since 2010 | ||
| 2044 debt ratio and fiscal gap estimated in 2010, as percentages of GDP | Debt Ratio 251 |
Fiscal Gap 4.5 |
| Changed projections of: | ||
| Lower observed and projected interest rates | -90 | -2.1 |
| Slower growth of major health programs | -76 | -1.7 |
| Lower discretionary spending | -8 | -0.2 |
| Higher GDP | 2 | 0.0 |
| Higher Social Security spending | 2 | 0.1 |
| Lower revenues | 10 | 0.2 |
| Higher spending on other mandatory programs | 11 | 0.2 |
| Increase in other means of financing the deficit | 11 | 0.3 |
| Delay starting date for deficit reduction; change debt target | n.a. | 0.3 |
| Total decrease, 2010 to 2019 | -140 | -3.0 |
| 2044 debt ratio and fiscal gap estimated in 2019, as percentages of GDP | 111 | 1.5 |
As a result, we now project that Medicare, Medicaid (including the ACA expansion), CHIP, and the marketplace subsidies will together cost 7.9 percent of GDP in 2044. This is about two-thirds of the 2010 estimate even though the 2010 estimate did not include the ACA and recent CHIP coverage expansions.
Indeed, the fact that health care costs remain the largest driver of future spending increases should not obscure how much their projected costs have fallen over the last decade. This development has substantially improved the long-run fiscal outlook.
The other major factor improving the long-term outlook relative to the 2010 projections is lower projected interest rates. In 2010, interest rates were historically low, in part due to the Great Recession, but CBO and other forecasters assumed that rates would rise as the economy recovered, reaching an average of about 5.0 percent on the panoply of new securities that the Treasury would issue by 2019. While interest rates have indeed risen since 2010 and CBO assumes that they will ultimately rise a bit more, CBO has steadily lowered its forecast, now projecting that average Treasury rates will reach about 2.8 percent by 2029. These significantly lower interest rates, continued through 2044, result in notably lower net interest costs.
Lower projected interest rates over the long term and a continued slowing of health care costs growth are certainly good news, though not nearly enough to eliminate the projected fiscal gap.
As Table 2 shows, there are other, smaller changes to our projections since 2010. For example, revenues are now projected to be somewhat lower as a percentage of GDP, with tax cuts contributing to that result. Other mandatory spending is now projected to be a somewhat higher percentage of GDP, with by far the largest contribution coming from veterans’ disability benefits; more conditions are now attributed to service in the armed forces. In addition, the refundable portions of the earned income tax credit and the child tax credit have been improved.
Appendix 2 explains and quantifies the changes in our projections since last year.
How Alternative Trust Fund or Tax Policies Would Alter the Projections
Assuring Solvency for Social Security and Medicare
Assuring long-run solvency for the Social Security and Medicare Hospital Insurance (HI) trust funds would substantially improve the long-run budget picture. The programs’ trustees project that the HI fund will be depleted in 2026 and the combined Social Security trust funds in 2035.[10] In those years, incoming revenues would support 89 percent of Medicare HI benefits and about three-quarters of Social Security benefits.[11] Like all other organizations’ long-term projections, ours assume that full benefits will still be paid even after those trust funds are depleted — implicitly, by transfers from the general fund (that is, by borrowing from the public).
Bringing the Social Security and HI trust funds into financial balance through tax increases, benefit reductions, or some combination of the two would avoid that assumed borrowing and so forestall much of the projected rise in the debt-to-GDP ratio. If Social Security and HI expenditures equaled their revenues in each year after the projected depletion of those trust funds, federal debt would peak at 97 percent of GDP in 2034 and decline to 93 percent of GDP by 2044. The fiscal gap would shrink from 1.5 percent of GDP to 0.7 percent.
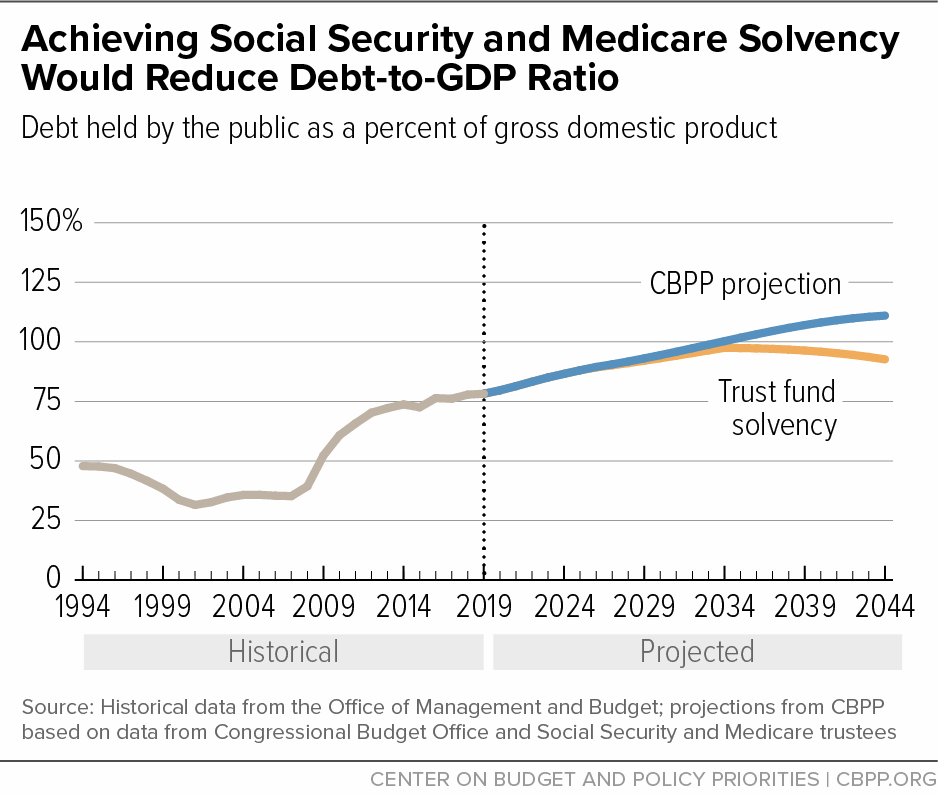
Because the trust funds cannot make benefit payments in excess of the amounts available in those trust funds, it is plausible to assume that policymakers will restore the funds’ solvency, one way or another. The “Trust Fund Solvency” line in Figure 4 assumes that this occurs abruptly, through a sudden benefit cut or tax increase once the funds’ assets are depleted. Phasing in some combination of additional revenues and lower benefits more gradually, starting sooner, might produce slightly lower debt ratios than those shown here.
To summarize, policymakers can avert more than half of the projected 33-percentage-point increase in the debt ratio through 2044 — and shrink the fiscal gap by more than half — by restoring solvency to the trust funds through revenue increases, benefit reductions, or a combination of the two. But to the extent that they instead restore trust fund solvency through transfers from the general fund, the 2044 debt ratio and the fiscal gap would not shrink. (See Table 3.)
What If Scheduled Changes in Tax Law Do Not Occur?
Considerable policy uncertainty surrounds our projections. As Appendix 1 explains, our projections approximate a continuation of current tax laws and policies, accounting for scheduled changes in those tax laws. But suppose, for instance, that policymakers take steps to further reduce revenues by making permanent or otherwise extending various temporary tax-cut measures now in effect, as House Republican leaders have proposed[12] and as President Trump has proposed in his two most recent budgets. Table 3 shows the effects on the long-term outlook if the tax cuts in the 2017 tax law that are scheduled to expire are instead made permanent, three ACA taxes that have been suspended aren’t allowed to take effect as scheduled,[13] and the full “expensing” of new business investments and the so-called “normal tax extenders” (which expired last year) are instead continued, without any tax increases or spending cuts to offset some or all of the resulting revenue loss. Under such a scenario, the 2044 debt would reach 139 percent of GDP rather than 111 percent and the fiscal gap would increase to 2.8 percent of GDP.
| TABLE 3 | ||
|---|---|---|
| Different Policy Assumptions Change Projected 2044 Debt Ratio and 25-Year Fiscal Gap | ||
| CBPP Projections based on current laws and policies | 2044 Debt Ratio (% of GDP) 111 |
25-Year Fiscal Gap (% of GDP) 1.5 |
| Achieve trust fund solvency via changes in taxes and benefits | -18 | -0.8 |
| Preclude scheduled changes in tax law: | ||
| Continue 2017 tax law provisions that are scheduled to expire | +19 | +0.9 |
| Repeal delayed ACA taxes | +6 | +0.3 |
| Continue expensing and other “tax extenders” | +3 | +0.2 |
| Subtotal, preclude scheduled changes in tax law | +28 | +1.3 |
| With trust fund and tax policy changes | 121 | 1.9 |
Appendix 1: Technical Note on Our Projections
Our projections of the long-term fiscal outlook are based on those published by CBO, but we make several key adjustments. This appendix details our adjustments to CBO’s projections for 2019-2029, details our adjustments to CBO’s projections for 2030-2044, and quantifies the differences between our projections and CBO’s by comparing our estimates of the debt-to-GDP ratio and the fiscal gap in 2044 to CBO’s estimates.
CBPP Projections for 2019-2029
We base the first ten years of our projections on CBO’s baseline budget estimates published in May 2019.[14] We adjust those ten-year projections in four respects. Specifically, we assume that:
- Certain timing anomalies will be smoothed. Some programs — e.g., Medicare Part C, Supplemental Security Income, and Veterans’ Compensation and Pensions — accelerate their monthly payments by a few days if the payments would otherwise fall on a weekend. When October 1 (the start of the federal fiscal year) falls on a weekend, there may be 13 “monthly” payments in the prior fiscal year; as a result, other fiscal years may have 11. This distorts the year-to-year path of expenditures, deficits, and debt. We smooth the path by assuming 12 such payments each year.[15]
- Emergency and disaster spending will reflect its average level. The CBO baseline generally continues the current-year funding level for routine disaster relief, as constrained by limits included in the 2011 Budget Control Act. Following baseline rules, CBO also continues any emergency funding that Congress may have enacted to supplement routine disaster relief when natural disasters are exceptionally expensive. In most years, funding for disaster relief is not especially high, but in some years it is far higher. Indeed, in its May 2019 baseline, funding is far below the average, or statistically likely, level. Our baseline replaces CBO’s projection of future disaster/emergency costs with the higher, statistically likely level based on average funding over the past three decades.
- The Bipartisan Budget Act of 2019 will be fully adhered to. That legislation prevents the deep cuts in discretionary funding for defense and non-defense discretionary programs that were otherwise required by the Budget Control Act of 2011 and were assumed in CBO’s May baseline. Our baseline therefore raises the assumed funding for these two budget categories in 2020 and 2021 to the levels specified in BBA 2019.[16] It also assumes that the increased 2021 level will be continued (after adjusting for inflation) for the remainder of the decade, an assumption that follows standard baseline rules.[17]
Finally, we adjust the May baseline to reflect the much lower interest rates that CBO published in August. CBO’s August baseline assumed interest rates for all ten years that are considerably lower than those it was using in the projections it published from January through May. We have adjusted CBO’s May baseline[18] to reflect those lower interest rates.
In all other respects, we follow CBO’s estimates through 2029, including its assumption of no future changes in law or policy. As discussed in this analysis, our estimates of the debt ratio would be noticeably higher if, for instance, we assumed continuation of the expiring tax cuts or the permanent delay of certain health taxes.
CBPP Projections for 2030-2044
Beyond 2029, we base our projections on other recent sources, including CBO’s most recent long-term budget outlook (June 2019) and the latest reports of the Social Security and Medicare trustees (April 2019).[19] Specifically, we assume that after 2029:
- Revenues and GDP are as projected in CBO’s June long-term extended baseline, as are expenditures for Medicaid, CHIP, health insurance subsidies, and all other mandatory programs.
- Social Security and Medicare costs grow, as a percent of GDP, with those in the trustees’ intermediate projections. (CBO makes its own projections of Social Security and Medicare costs; its projected Medicare growth rate is notably higher.)
- Discretionary spending grows with inflation plus population, thus keeping real per-capita spending constant at 2029 levels. (CBO assumes this category of spending rises more quickly, with GDP.[20])
- Emergency costs, including the routine “disaster” allowance permitted under the 2011 Budget Control Act, continue to reflect spending consistent with the statistically likely level of federal funding.
- Additional federal borrowing to finance student loans and certain other non-budgetary transactions continues to equal 0.1 percent of GDP, as it does in 2029.
For net interest, we first calculate how much borrowing results from the revenue and spending totals already calculated and then apply the overall interest rate on federal debt, assuming the continuation of the average interest rate on new federal debt that CBO projected for 2029 in August (2.8 percent).
CBO reported its long-term projections both with and without macroeconomic feedback; CBO’s feedback calculation assumes that a growing debt will slightly reduce GDP growth and increase interest rates, relative to the levels CBO assumes without such feedback. For two reasons, we use the CBO projections that do not include feedback. First, estimates of the macroeconomic feedbacks of policy changes are highly uncertain.[21] Second, the size of the fiscal gap, discussed in this analysis, is unaffected by macroeconomic feedback. To the extent a rising debt ratio may generate negative feedback in the form of lower GDP and higher interest rates — and thus make the debt ratio in 2044 still higher — actions to raise revenue and cut programs sufficiently would both reverse all the feedback and cut primary deficits enough to reduce the 2044 debt ratio to its current level.
Thus, we can calculate the needed primary deficit reduction (the size of the fiscal gap) without knowing if there will be any feedback from failure to close the fiscal gap, much less its possible size. CBO has written:
It would not be informative to include the negative economic effects of rising debt (and their feedback to the budget) in the fiscal gap calculation because the fiscal gap shows the budgetary changes required to keep debt from rising in the first place; if those budgetary changes were made, the negative economic effects (and their feedback to the budget) would not occur.[22]
Table 1, in the body of our report, shows our projections for each major category of the budget as a percent of GDP in selected years. Data for each year, including historical values since 1995, are posted on our website in a spreadsheet accompanying our analysis.[23]
Quantifying How CBO’s Projections Differ from CBPP’s
CBO’s debt ratio and fiscal gap projections for 2044 differ from ours primarily due to our different assumptions for Medicare spending, discretionary spending, and changes in interest rates:
- We project that, after 2029, Social Security and Medicare will grow at the rate projected by the programs’ trustees (measured as a percent of GDP). CBO makes its own projections and, for Medicare, assumes costs that are larger and growing faster.
- After 2029, we assume that discretionary programs will grow with population and inflation while CBO assumes they will grow with GDP, a faster rate. But CBO’s faster growth starting in 2030 does not overcome the fact that CBO projects much lower levels of discretionary spending in the first decade than we do because CBO’s June long-term projections do not reflect BBA 2019, the appropriations agreement, as explained above.
- We assume notably lower Treasury interest rates in the first decade since we use CBO’s August interest rate assumptions, while CBO’s June long-term projections use the higher interest rates CBO projected in January, April, and May. Moreover, we assume that Treasury interest rates will not rise after 2029 (since we do not incorporate macroeconomic feedback into our projections).
Table 4 quantifies the effects of these differences.
| TABLE 4 | ||
|---|---|---|
| CBO Projects Higher Debt and a Larger Fiscal Gap than CBPP | ||
| CBPP Projections based on current laws and policies | 2044 Debt Ratio (% of GDP) 111 |
25-Year Fiscal Gap (% of GDP) 1.5 |
| Effects of switching from CBPP to CBO assumptions: | ||
| Higher interest rates | 15 | 0.5 |
| Higher Medicare spending | 6 | 0.3 |
| Lower spending on discretionary programs (defense, non-defense, and disasters) | -9 | -0.4 |
| All other | -1 | -0.2 |
| Total, changes from CBPP to CBO | +11 | +0.2 |
| CBO projection | 122 | 1.7 |
Appendix 2: Changes to Our Long-Term Projections Since 2018
Since we published our most recent long-term projections in 2018, projections made by CBO and the Social Security and Medicare trustees have changed very little. As Table 5 shows, the four main changes between our 2018 and 2019 projections largely offset each other, causing only small changes to our top-line estimates of the debt-to-GDP ratio and fiscal gap in 2044.
The largest changes between our 2018 and 2019 projections occur because we now assume lower interest rates (consistent with those CBO published in August 2019) and higher discretionary spending to reflect the enactment of the 2019 BBA. That law ameliorates the steep and immediate decline in discretionary spending we projected last year, when we foresaw it shrinking from 6.4 percent of GDP to 4.4 percent by 2044. We now project discretionary spending to shrink more slowly, to 4.8 percent of GDP. Our assumption of lower interest rates reduced our estimates of the debt-to-GDP ratio and fiscal gap in 2044, while our assumption of higher discretionary spending increased both estimates by roughly the same magnitude.
Similarly, this year’s projection of revenues is lower than last year’s, but the loss of revenues is fully offset by a reduction in projected spending on mandatory programs, including Social Security and Medicare. As Table 5 shows, while our lower revenue projections increased the debt-to-GDP ratio in 2044 by 7 percentage points, our projected reductions in spending on Social Security and major health programs pushed the ratio back down by 6 percentage points.
| TABLE 5 | ||
|---|---|---|
| Change in CBPP’s Projections Since 2018 | ||
| 2044 debt ratio and fiscal gap estimated in 2018, as percentages of GDP | Debt Ratio 112 |
Fiscal Gap 1.4 |
| Changed projections of: | ||
| Lower interest rates | -10 | -0.4 |
| Lower spending for mandatory programs including Social Security and health care | -8 | -0.3 |
| Lower revenues | 7 | 0.3 |
| Higher discretionary spending | 11 | 0.5 |
| All other | -1 | * |
| Total decrease, 2018 to 2019 | -1 | +0.1 |
| 2044 debt ratio and fiscal gap estimated in 2019, as percentages of GDP | 111 | 1.5 |
End Notes
[1] Richard Kogan et al., Long-Term Budget Outlook Has Improved Considerably Since 2010 But Remains Challenging, Center on Budget and Policy Priorities, November 15, 2018, https://www.cbpp.org/research/federal-budget/long-term-budget-outlook-has-improved-considerably-since-2010-but-remains.
[2] For more information, see Congressional Budget Office, The 2019 Long-Term Budget Outlook, June 25, 2019, Figure 1-14, https://www.cbo.gov/system/files/2019-06/55331-LTBO-2.pdf.
[3] Paul N. Van de Water, 2017 Tax Law Heightens Need for More Revenues, Center on Budget and Policy Priorities, November 15, 2018, https://www.cbpp.org/research/federal-tax/2017-tax-law-heightens-need-for-more-revenues.
[4] The “primary deficit” equals revenues minus primary spending. With a primary deficit of zero, the stock of debt will rise from year to year only because the Treasury must pay interest on the existing debt; the debt will therefore rise by the interest rate. And if the GDP growth rate equals the interest rate, GDP will rise as fast as the debt and the debt ratio will not change. In CBO’s projections and ours, the GDP growth rate exceeds the interest rate in all years, so if the primary deficit were zero, the debt ratio would fall every year. See Kogan et al., Difference Between Economic Growth Rates and Treasury Interest Rates Significantly Affects Long-Term Budget Outlook, Center on Budget and Policy Priorities, February 27, 2015, Appendix 3, https://www.cbpp.org/sites/default/files/atoms/files/2-27-15bud.pdf.
[5] See “Why Does Raising the Retirement Age Reduce Benefits?” in Kathy A. Ruffing and Paul N. Van de Water, Social Security Benefits Are Modest, Center on Budget and Policy Priorities, updated August 7, 2017, https://www.cbpp.org/cms/?fa=view&id=3368.
[6] See “Policy Basics: Non-Defense Discretionary Programs,” Center on Budget and Policy Priorities, updated August 12, 2019, https://www.cbpp.org/research/federal-budget/policy-basics-non-defense-discretionary-programs.
[7] CBO’s projections, which we use for this subset of mandatory expenditures, show their costs shrinking from 2.58 percent of GDP today to 2.30 percent by 2029 and 2.04 percent by 2044. During the first decade, for which CBO provides detailed program projections, four-fifths of this 0.28 percentage-point decrease comes from two mandatory programs: SNAP and the refundable portions of the Earned Income Tax Credit, the Child Tax Credit, and other tax credits. Those programs shrink as a percent of GDP even during normal economic times, in part because their eligibility thresholds grow with inflation while per-person GDP grows faster than inflation. Also see Richard Kogan and Kathleen Bryant, Program Spending Outside Social Security and Medicare Historically Low as a Percent of GDP and Projected to Fall Further, Center on Budget and Policy Priorities, updated March 8, 2019, https://www.cbpp.org/research/program-spending-outside-social-security-and-medicare-already-low-in-historical-terms-is.
[8] CBO, The 2013 Long-Term Budget Outlook, p. 10, https://www.cbo.gov/publication/44521.
[9] Kathy Ruffing, Kris Cox, and James Horney, The Right Target: Stabilize the Federal Debt, Center on Budget and Policy Priorities, January 12, 2010, https://www.cbpp.org/research/the-right-target-stabilize-the-federal-debt.
[10] The Disability Insurance trust fund is expected to be depleted in 2052, the much larger Old-Age and Survivors Insurance fund (and the two funds combined) in 2034.
[11] Social Security and Medicare Boards of Trustees, Status of the Social Security and Medicare Programs, A Summary of the 2019 Annual Reports, April 25, 2019, https://www.ssa.gov/OACT/TRSUM/index.html.
[12] Chuck Marr and Brendan Duke, New House Republican Tax Proposal Fails Fiscal Responsibility Test, While Favoring the Wealthiest, Center on Budget and Policy Priorities, updated September 13, 2018, https://www.cbpp.org/research/federal-tax/new-house-republican-tax-proposal-fails-fiscal-responsibility-test-while; Paul Van de Water, Joel Friedman, and Sharon Parrott, 2020 Trump Budget: A Disturbing Vision, Center on Budget and Policy Priorities, March 11, 2019, https://www.cbpp.org/research/federal-budget/2020-trump-budget-a-disturbing-vision; Paul Van de Water, Why Congress Shouldn’t Repeal the Cadillac Tax, Center on Budget and Policy Priorities, July 11, 2019, https://www.cbpp.org/research/health/why-congress-shouldnt-repeal-the-cadillac-tax/.
[13] The three health taxes are the tax on health insurance providers, the medical device tax, and the tax on certain high-cost health insurance plans (the so-called Cadillac tax).
[14] Congressional Budget Office, Updated Budget Projections: 2019 to 2029, May 2, 2019, https://www.cbo.gov/publication/55151.
[15] 2029 is a year with 11 such “monthly” payments and therefore an artificially low spending level. We also remove these timing anomalies from CBO’s estimates for the other years during the coming decade period, (e.g., 2022, 2024, and 2028), and we do not project them to recur after 2028.
[16] The BBA of 2019 also included provisions extending some customs user fees for two years, into 2028 and 2029, and extending sequestration of selected mandatory programs — initially triggered by the Budget Control Act of 2011 — into 2028 and 2029. (Both the user fees and the mandatory sequestration had previously been extended a few years at a time in prior budget agreements.) Because these two provisions are now law, we reflect the 2028 and 2029 savings in our baseline. We do not extend them after 2029, consistent with our approach to all mandatory and revenue laws, in which we and CBO follow standard baseline rules by treating temporary provisions as in fact being temporary.
[17] In August 2018, CBO issued a table showing the ten-year costs of the BBA of 2019 we describe above. Our projections differ from CBO’s in two respects. First, our projections reflect an upward adjustment to the statutory caps that provides more than $2 billion per year for wildfire suppression. CBO does not, because that upward adjustment is first effective for 2020 and so has not yet occurred. Second, our projections reflect the agreed-upon levels of war funding (which is not constrained by the discretionary caps) for 2020 and 2021, and project the 2021 level to grow with inflation thereafter. CBO correctly interprets the agreed-upon level of war funding for those years as not being statutorily required or limited, and so ignores that aspect of the agreement, instead continuing the 2019 level of war funding (growing with inflation) in 2020-2029. While we view our two assumptions as more consistent with the appropriations agreement and existing law governing the discretionary caps, the difference between our levels and CBO’s is quite small.
[18] Relative to its May baseline, CBO’s August baseline also makes small reductions to revenues and mandatory programs generally. We do not reflect these for two reasons. First, they are small and very largely offsetting. Second, CBO’s long-term budget projections of June 2019 are consistent with the estimates for revenues and mandatory programs in its May baseline but not its August baseline, and we rely on CBO’s June long-term budget projection for GDP, revenues, and most mandatory programs. Therefore, switching from CBO’s May to August baseline would create inconsistences between those levels in the first decade and the subsequent 15 years.
[19] See CBO, The 2019 Long-Term Budget Outlook, op. cit., and Social Security Administration, The 2019 OASDI Trustees Report, https://www.ssa.gov/OACT/TR/2019/tr2019.pdf.
[20] Of course, as our nation becomes wealthier, it might choose to spend increasing constant-dollar amounts per person on infrastructure, research, data collection, education, environment, veterans’ health, national parks and forests, law enforcement, and other governmental activities, keeping up with the growth in GDP. But such a choice is better thought of as an increase in governmental benefits and services, and so not a reflection of current policy. Nor is it consistent with the historical pattern. Since the enactment of the Congressional Budget Act in 1974, growth in both defense and non-defense programs has more closely tracked population and prices than GDP.
[21] Paul N. Van de Water and Chye-Ching Huang, Budget and Tax Plans Should Not Rely on “Dynamic Scoring,” Center on Budget and Policy Priorities, updated November 17, 2014, https://www.cbpp.org/research/budget-and-tax-plans-should-not-rely-on-dynamic-scoring.
[22] CBO, The 2015 Long-Term Budget Outlook, June 16, 2015, https://www.cbo.gov/publication/50250. Also see Richard Kogan et al., Difference Between Economic Growth Rates and Treasury Interest Rates Significantly Affects Long-Term Budget Outlook, Center on Budget and Policy Priorities, February 27, 2015, Appendix 2, “Why Long-Run Projections Need Not Be Dynamic,” https://www.cbpp.org/research/federal-budget/difference-between-economic-growth-rates-and-treasury-interest-rates.
[23] “Data Accompanying CBPP’s Long-Term Budget Projections of October 2019,” Center on Budget and Policy Priorities, https://www.cbpp.org/sites/default/files/atoms/files/10-8-19-bud.xlsx.
More from the Authors

Areas of Expertise