Long-Term Budget Outlook Has Improved Considerably Since 2010 But Remains Challenging
For the 2019 version of CBPP’s long-term budget projections, see: https://www.cbpp.org/research/federal-budget/long-term-budget-outlook-has-improved-substantially-since-2010-but-remains.
New CBPP projections of the long-term fiscal outlook show that the debt, measured as a percent of the economy, is expected to continue rising gradually under current budget policies over the coming three decades. Compared with our 2016 projections, the outlook has worsened modestly. At the same time, compared with the outlook in 2010, the nation’s projected long-term finances are improved (see Figure 1), largely due to significant reductions in prospective health care cost growth and interest rates.
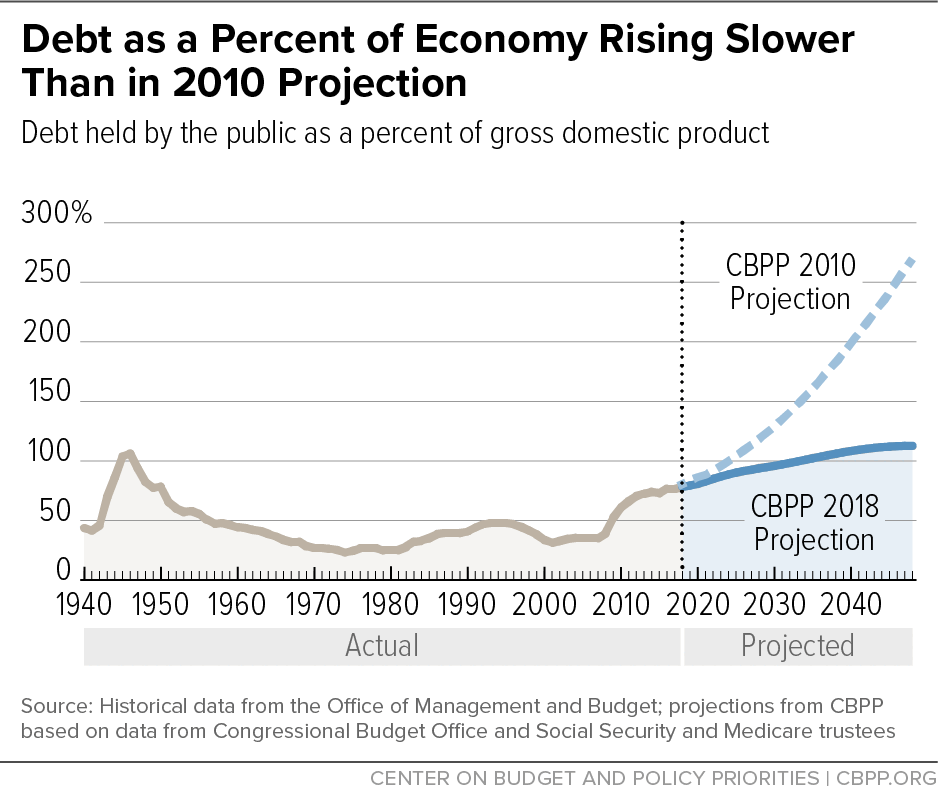
Under our projections of current law and policies, the federal debt will rise in relation to the economy over the coming decades. The ratio of debt to gross domestic product (GDP) — currently 78 percent — will grow to 94 percent by 2028. This growth is then projected to slow but not halt, with the estimated debt-to-GDP ratio reaching 113 percent by 2048, the last year our projections cover. The “fiscal gap” through 2048 — that is, the average amount of annual deficit reduction needed to stabilize the debt ratio at its current level — is an estimated 1.3 percent of GDP.
Policymakers should limit projected debt-to-GDP ratios through carefully designed policies that include significant additional revenues and impose costs on those best able to bear them.A stable or declining debt-to-GDP ratio is a common goal for fiscal stability. Although a rising debt ratio is appropriate when the economy is operating well below its potential, as in the Great Recession and ensuing sluggish recovery, a rising debt ratio in a strong, high-employment economy can reduce economic growth and future national income and might ultimately jeopardize financial stability. Policymakers should limit projected debt-to-GDP ratios through carefully designed policies that include significant additional revenues and impose costs on those best able to bear them. (See box.)
Our new projections update those we published in August 2016[1] to reflect the latest Congressional Budget Office (CBO) ten-year and long-term budget projections and the latest projections by the Social Security and Medicare trustees. We project slightly higher debt ratios and a larger fiscal gap than in 2016, with lower revenues and lower GDP mostly offset by lower interest rates and slower growth of Social Security and major health programs.
The deficit as a percent of GDP declined steadily since its 2009 peak, during the Great Recession, to reach a low point of 2.4 percent of GDP in 2015 — a deficit sufficiently small that the debt ratio declined in that year. But deficits started growing faster than the economy in 2016 and are now expected to increase further over the next several years, in part due to the 2017 tax law and the 2018 Bipartisan Budget Act. The latter increased appropriations targets above the historically low levels imposed by the 2011 Budget Control Act, as further reduced by the sequestration that Act triggered.
Since 2016, deficits have been sufficiently large to push the debt ratio up. This increase in projected deficits and debt poses a challenge because it occurs when the economy is quite strong — a time in the economic cycle when deficits normally should be lower and the debt ratio declining. On the one hand, these recent policies do not have a large effect beyond the first decade because most are temporary. On the other hand, if policymakers made these policies (such as the tax cuts enacted late last year) permanent without offsetting the cost, they would add substantially to the debt over the long term. (The recent tax cuts will cost noticeably more over the coming decade than the appropriations increases; the same would be true over the next three decades if both were extended indefinitely.)
These long-run budget projections are not a prediction. Rather, they estimate the budget outlook if policymakers continue laws and policies as they currently exist or are scheduled to take effect. That is, these projections assume no future legislation that would either reduce or expand deficits, meaning that offsetting savings are assumed to fully cover any future tax cuts or spending increases. Appendix 1 provides more information about how we made the projections.
The Revenue Outlook
Since our previous long-term budget analysis several years ago, Congress enacted the 2017 tax law, which cut taxes and added an estimated $1.9 trillion to the debt over the next ten years. As a result, federal revenues will total just 16.5 percent of GDP in 2019, well below the 17.4 percent average over the last 40 years, and even further below the 18.4 percent average in years when the economy was operating at or near its full capacity.
Most of the individual income tax cuts in the 2017 tax law are scheduled to expire after 2025. Because of that expiration and other factors, federal revenues are projected to rise for the next three decades from 16.5 percent of GDP in 2019 to 19.9 percent by 2048, or roughly the level in the final year of the Clinton Administration. Almost half of this revenue growth stems from rising real incomes, which push some income into higher tax brackets (so-called “real bracket creep”). Most of the rest is due to scheduled tax changes that will raise revenue.[2] These include not only the expiration of the individual income tax cuts but also the scheduled, albeit delayed, implementation of the excise tax on high-cost health plans that was enacted as part of the Affordable Care Act (ACA) but hasn’t been allowed to take effect. If these scheduled tax changes are not allowed to take effect, revenues will be 1.2 percent of GDP lower after 2027 than projected under these current-law estimates; the fiscal gap will rise substantially, from 1.3 percent of GDP to 2.2 percent; and the projected 2048 debt ratio would rise from the 113 percent of GDP to 139 percent. Receipts from sources other than the individual income tax are projected to increase only slightly as a percentage of GDP.
Avoiding further tax cuts will prevent the fiscal gap from worsening but is insufficient. An aging population and rising health care costs will necessarily drive up spending for Social Security, Medicare, and Medicaid, as described below. Policymakers will need to raise revenue (not just avoid tax cuts) and to look for spending reforms that represent sound policy and wouldn’t increase poverty or inequality.[3]
The Spending Outlook
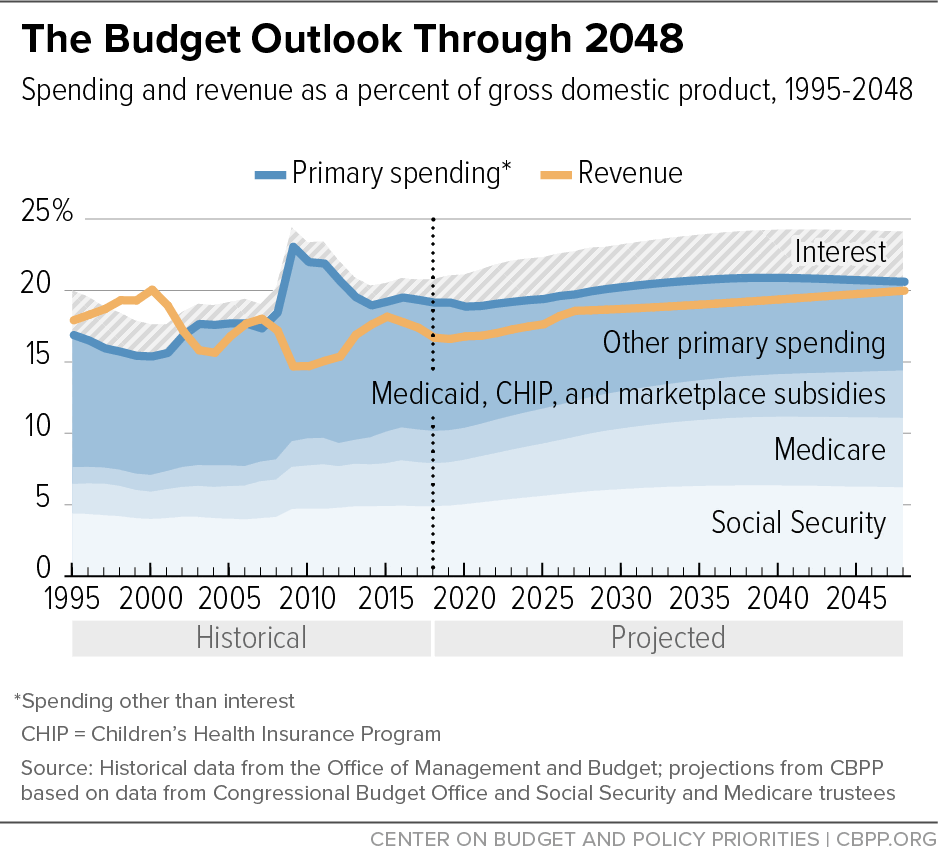
We project that federal outlays will rise from 20.8 percent of GDP in 2018 to 24.1 percent of GDP in 2048. Less than half of the rise stems from primary, or non-interest, spending — that is, spending on programs that pay benefits to ordinary Americans or carry out the functions of government. (See Figure 2.) The rest of the rise stems from interest costs, as interest rates rise from historic lows and the federal debt gradually mounts. If revenues fully covered primary spending, the projected debt ratio would remain steady or decline slightly, even with rising interest rates. But as Figure 2 shows, revenues are projected to remain significantly lower than primary spending.
Primary (Non-Interest) Spending
The composition of federal non-interest spending will also change significantly by 2048. Because of an aging population and rising health care costs, Social Security, Medicare, Medicaid, and health insurance subsidies will grow substantially — both as a percentage of GDP and as a share of total federal spending — while all other programs as a whole will shrink by both measures. Social Security and the major health programs account for 53 percent of non-interest spending today and are projected to reach 70 percent by 2048.
Social Security. Benefits under Old-Age, Survivors, and Disability Insurance (commonly known as Social Security) will rise slowly but steadily in the next two decades — from a bit under 5 percent of GDP today to over 6 percent in the 2030s — and then stabilize. That pattern largely mirrors the aging of the population and is dampened by the scheduled rise in the program’s full retirement age, which historically was 65, is now 66, and will gradually climb to 67 by 2022. (Each year that the full retirement age is raised lowers benefits across the board for future retirees by about 7 percent, regardless of whether they claim benefits early or work until the full retirement age or beyond.)[4]
Medicare. Net outlays for Medicare benefits — that is, total payments minus the premiums that enrollees pay — are expected to rise from 3.0 percent of GDP today to 4.9 percent of GDP in 2048. Medicare faces the same demographic pressures as Social Security, plus an extra cost pressure: the tendency of medical costs, fueled by technological advances and increased utilization, to outpace GDP growth. The cost controls and delivery system reforms in the ACA, plus other developments in health care delivery, are curbing (though not eliminating) that pressure. Our projections are based on current law and assume that policymakers will retain cost-control provisions of the ACA and the Medicare Access and CHIP Reauthorization Act (MACRA).
Medicaid, CHIP, and health insurance subsidies. The joint federal-state Medicaid program provides acute health care coverage and long-term supports and services to eligible low-income people, while the Children’s Health Insurance Program (CHIP) covers many low-income children. The ACA expanded the reach of Medicaid, at state option, and created new state-based marketplaces to enable millions of people without other coverage to buy health insurance at reasonable prices, without exclusions for pre-existing conditions or other restrictions that had often made coverage unaffordable. It also provided for federal subsidies to help people with low or moderate incomes afford marketplace coverage.
The ACA’s coverage expansions are the main reason that spending for this trio of programs rose from 1.6 percent of GDP in 2012, before the expansions took effect, to 2.3 percent today. Cost pressures will lead this spending to reach 3.3 percent of GDP in 2048.
Other program spending. This category includes hundreds of programs for which Congress appropriates funding on an annual basis — known as defense and non-defense “discretionary” programs. It also includes entitlement or “mandatory” programs such as SNAP (formerly known as food stamps), pensions for federal civilian and military retirees, veterans’ disability and education benefits, the refundable portions of the Earned Income Tax Credit and Child Tax Credit, Supplemental Security Income for poor elderly and disabled people, unemployment insurance, Temporary Assistance for Needy Families, farm price supports, and various smaller programs. Finally, the “other program spending” category includes an allowance for future natural disasters.
Over the next ten years, this broad category — which spiked at nearly 14 percent of GDP in 2009, during the economic downturn — is projected to fall as a percentage of GDP from 9.0 percent in 2018 to 7.5 percent in 2028. Both these figures are well below the 11 percent-of-GDP average of the last four decades.
Some four-fifths of the drop from 2018 to 2028 occurs in discretionary spending and is concentrated in the next few years. The 2018 Bipartisan Budget Act permitted funding for discretionary programs to increase in 2018 and 2019, but the 2011 Budget Control Act’s funding caps and sequestration cuts come back into full effect starting in 2020, squeezing defense and non-defense discretionary programs alike. Measured as a percent of GDP, defense spending is slated to fall by 2021 to its lowest level on record, while expenditures for non-defense discretionary programs are slated to do so in 2020. (Historical data go back to 1962.) Under our projections, both defense and non-defense discretionary spending continue to fall in all subsequent years as a percent of GDP.
The Debt-to-GDP Ratio
Generally, the debt-to-GDP ratio should be expected to rise during hard times or major emergencies and then decline during good times, in part due to the automatic fluctuations in tax revenues and spending on programs like unemployment insurance over the course of the business cycle. Allowing the debt-to-GDP ratio to vary also enables the government to cut taxes and increase spending to combat recessions and alleviate hardship during bad times, while creating a presumption against policies that markedly increase the debt during good times.
A stable debt-to-GDP ratio is a key test of fiscal sustainability. Increases in the dollar amount of debt are not a concern as long as the economy is growing at least as fast. Between 1946 and 1979, for example, debt held by the public grew significantly in dollar terms but — thanks to economic growth — plummeted as a percentage of GDP, from 106 percent to 25 percent.
Some suggest that exceeding a certain debt-to-GDP ratio has a sharply adverse effect on the economy. In reality, researchers have not found any particular threshold above which debt dramatically slows economic growth.a Moreover, today’s very low real (inflation-adjusted) interest rates suggest that the economy can support a higher debt-to-GDP ratio than was appropriate when the government faced much higher borrowing costs.b
All else being equal, a lower debt-to-GDP ratio is preferred because of the lower interest burden it carries and the additional flexibility it provides policymakers facing economic or financial crises. But all else is never equal. Lowering the debt ratio requires program cuts, increases in taxes, or both. That is why we emphasize the importance of both the quantity and the quality of deficit reduction, which should not harm disadvantaged individuals and households, increase poverty or inequality, or cut programs that can boost future productivity.
In addition, even with a higher debt ratio, the nation should still use the power of both automatic and discretionary counter-cyclical measures — temporary tax cuts and spending increases — to fight recessions. Failure to fight recessions vigorously would not only harm the people who suffer most when times are bad but would also delay or weaken a broader recovery, likely leading to shorter expansions and slower long-term growth.
a Andrea Pescatori, Damiano Sandri, and John Simon, Debt and Growth: Is There a Magic Threshold?, International Monetary Fund WP/14/34, February 2014, p. 4.
bDouglas Elmendorf and Louise Sheiner, Federal Budget Policy with an Aging Population and Persistently Low Interest Rates, Journal of Economic Perspectives, Vol. 31, No. 3, Summer 2017, pp. 175-194, https://pubs.aeaweb.org/doi/pdf/10.1257/jep.31.3.175.
Spending for the mandatory programs in this part of the budget drifts down as a percentage of GDP, as well, though less precipitously than spending for discretionary programs. Unlike Social Security and the major health programs, most other mandatory programs do not face upward demographic or cost pressures.[5]
Spending for relief and reconstruction after natural disasters is currently unusually high because of the exceptionally destructive hurricanes during the summer of 2017. Over the coming decade and through 2048, we assume a somewhat lower level that reflects longer-term historical averages as a percentage of GDP. (See Appendix 1.)
These projections of discretionary and other mandatory spending (i.e., mandatory spending outside of Social Security and health care programs) are consistent with the historical pattern: in most cases, these categories of spending rise at an unusual rate on a sustained basis only a) if Congress acts to increase these programs (which by definition is not consistent with a projection of current law or policy[6]); or b) during recessions, when unemployment insurance, SNAP, and similar automatic stabilizers rise temporarily (they then fall back to normal levels as the economy recovers). Taken together, these two assumptions result in a continued downward drift in the broad category of “other spending” — which includes both discretionary spending and “other mandatory spending” — from 7.5 percent of GDP in 2028 to 6.3 percent in 2048.
Interest Costs
Unlike every other spending category, net interest doesn’t reflect explicit funding decisions by policymakers. Instead, it’s jointly determined by the amount of borrowing fueled by policymakers’ other revenue and spending decisions (in other words, by the debt) and by the interest rates set in financial markets.
Today, federal net interest costs represent 1.6 percent of GDP, only modestly above the historic lows posted in the 1950s through early 1970s, when federal debt was far smaller. But today’s low interest rates, which are holding down borrowing costs, are heading up. As a result, by 2028, net interest costs are expected to nearly double to 3.0 percent of GDP, even though the projected debt rises by only one-fifth (from 78 percent to 94 percent of GDP). By 2048, we project net interest to reach 3.5 percent of GDP and debt to reach 113 percent of GDP.
Changes in Our Long-Term Estimates
Since we published our most recent long-term projections in 2016, those estimates have changed little in total because projections made by CBO and the Social Security and Medicare trustees have changed very little. The debt ratio is now projected to grow more rapidly through 2025 than we projected two years ago, primarily because of the 2017 tax cuts and the expectation of slower GDP growth. After 2025, when some parts of the 2017 tax law are slated to expire, projected debt rises less rapidly than in our 2016 projections but stands at a higher level. By 2048, we project the debt ratio will be 113 percent of GDP, modestly higher than our 2016 projection of 107 percent.
Over the past eight years, however, the projected debt-to-GDP ratio has fallen significantly, as Figure 1 shows. It’s about two-fifths as high as we and others had previously estimated and is no longer projected to rise at explosive rates over the next three decades: in January 2010 we projected that debt would reach 289 percent of GDP by 2048[7]; we now project 113 percent of GDP. The significant improvement in the long-term budget outlook over the last eight years stems largely from two sources: lower health care costs and lower interest rates. As we discuss below (see Table 1), policymakers might choose a) to extend tax policies that are currently in place but are scheduled to expire, and b) to extend the inflation-adjusted levels of discretionary appropriations in place for 2018 and 2019, which are currently scheduled to revert to much lower levels in 2020. If policymakers take such actions without offsetting the costs, we project that the debt ratio would reach 158 percent of GDP by 2048. That figure is significantly above the 113 percent of GDP in our base projection, though it is still quite far below the 289 percent of GDP we projected in January 2010.
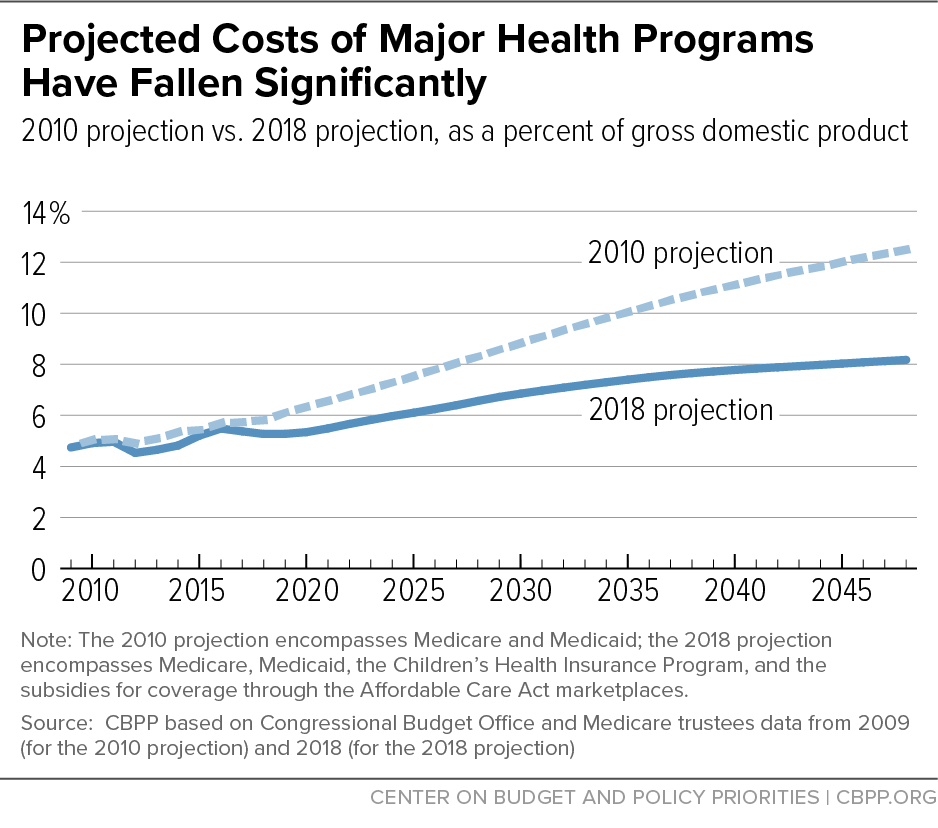
The remarkable decrease in the projected costs of the major health programs — Medicare, Medicaid, health insurance subsidies, and CHIP — is shown in Figure 3. Using projections from CBO and the Medicare trustees, we estimated in January 2010 that Medicare and Medicaid together would cost 12.5 percent of GDP in 2048. The 2010 projection preceded the enactment of the ACA, with its coverage expansions, but the cost of those expansions is more than offset by a combination of factors that have slowed health cost growth. These factors are (1) the ACA’s short- and long-term reductions in Medicare payment rates to health care providers; (2) the changes in health care payment and delivery systems initiated by the ACA and the 2015 Medicare Access and CHIP Reauthorization Act; and (3) the growing effects of a health cost slowdown in the public and private sectors that commenced before the ACA. As a result, we now project that Medicare, Medicaid (including the ACA expansion), CHIP, and the marketplace subsidies will together cost 8.2 percent of GDP in 2048. This is about two-thirds of the 2010 estimate even though the 2010 estimate did not include the ACA and recent CHIP coverage expansions.
Indeed, the fact that health care costs remain the largest driver of future spending increases should not obscure how much their projected costs have fallen over the last few years. This development has substantially improved the long-run fiscal outlook.
The other major factor that has improved the long-term outlook relative to the 2010 projections is lower interest rates and thus lower net interest costs. In 2010, interest rates were at historically low levels, in part due to the Great Recession. CBO and other forecasters assumed that rates would rise as the economy recovered, reaching an average of about 5.0 percent on the panoply of new securities that the Treasury would issue by 2019. While CBO still assumes that interest rates will rise over time, it has steadily lowered its forecast, now projecting that average Treasury rates will reach about 3.2 percent by 2028. These significantly lower interest rates, continued for the next two decades, result in notably lower net interest costs.
Lower projected interest rates over the long term and a continued slowing of health care costs growth are certainly good news, though not nearly enough to eliminate the projected fiscal gap. Appendix 2 provides more detail on how our current estimates differ from those in 2010 and 2016.
Stabilizing the Debt Ratio
As noted in the box, a stable debt ratio is a key test of fiscal sustainability. The best way to determine the amount of deficit reduction needed to stabilize the debt ratio is to calculate the fiscal gap, which as CBO explains “measures the change in spending or revenues that would be necessary to keep the ratio of debt to GDP the same at the end of a given period as at the beginning of the period.”[8] In this context, the term “spending” excludes interest payments; it refers only to spending on government programs. For a discussion of fiscal gap concepts and calculations, see Appendix 4.
Our 30-year budget projections show a fiscal gap of 1.3 percent of GDP. This means that annual revenue increases or program cuts averaging that percentage of GDP over the next 30 years would hold the 2048 debt to today’s 78 percent of GDP.
A 30-year fiscal gap of 1.3 percent of GDP is big enough to be challenging. It is equivalent to 6.7 percent of revenues over the period; to eliminate the gap entirely through revenue increases, all projected revenues — income taxes, payroll taxes, gasoline and other excise taxes, the estate tax, and tariffs — would need to rise by an average of 6.7 percent. Alternatively, eliminating the gap entirely through program cuts would entail cutting all programs — Social Security, health care, defense, education, veterans’ benefits, law enforcement, transportation, and so on — by an average of 6.2 percent. Of course, if any tax provisions or spending programs are protected, the rest would have to be hit correspondingly harder.
Our estimate of a fiscal gap of 1.3 percent of GDP through 2048 is slightly higher than the estimate of 1.1 percent associated with our 2016 long-term projection, though well below the estimate of 4.7 percent associated with our 2010 projection.
Assuring Solvency for Social Security and Medicare
Assuring long-run solvency for the Social Security and Medicare Hospital Insurance (HI) trust funds would substantially improve the long-run budget picture. Like other organizations’ long-term projections, ours assume that full benefits will still be paid even after those trust funds are depleted. The programs’ trustees project that the HI fund will be depleted in 2026 and the combined Social Security trust funds in 2034.[9] In those years, incoming revenues would support 91 percent of Medicare HI benefits and about three-quarters of Social Security benefits.[10]
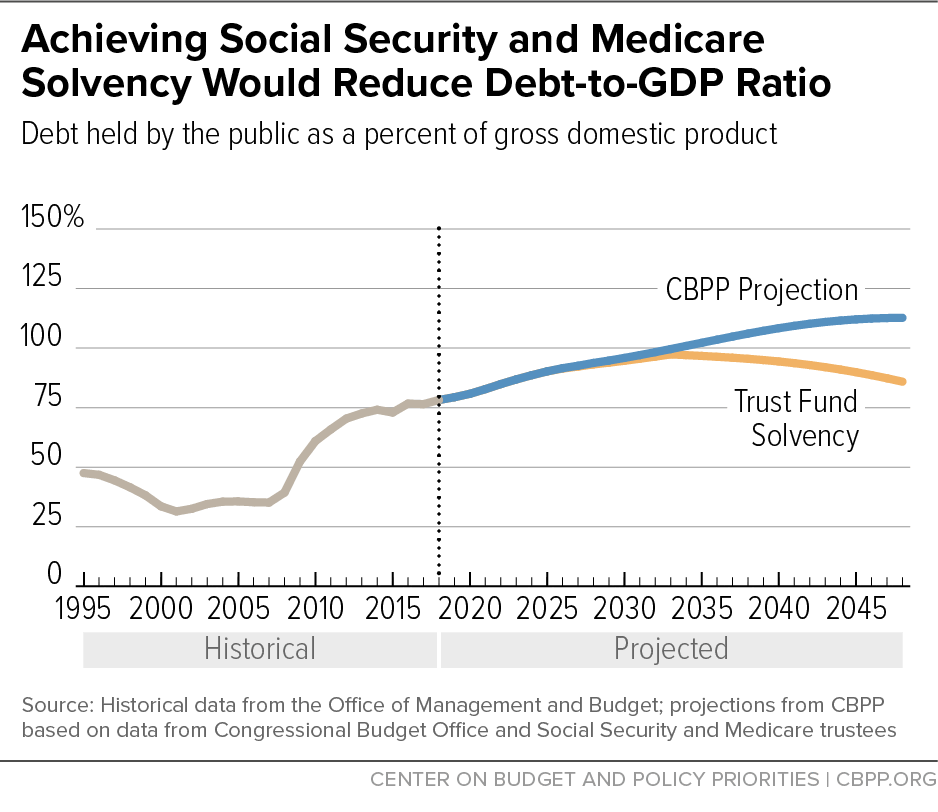
Bringing the Social Security and HI trust funds into financial balance — through tax increases, benefit cuts, or some combination of the two — would forestall much of the projected rise in the debt-to-GDP ratio. If Social Security and HI expenditures equaled their revenues in each year after the projected depletion of those trust funds, federal debt would peak at 97 percent of GDP in 2033 and decline to 86 percent of GDP by 2048. The fiscal gap would shrink from 1.3 percent of GDP to 0.3 percent.
Benefit payments cannot exceed amounts available in the trust funds, so it is plausible to assume that policymakers will restore the funds’ solvency, one way or another. The “Trust Fund Solvency” line in Figure 4 assumes that this occurs abruptly, through a sudden benefit cut or tax increase once the funds’ assets are depleted. Phasing in some combination of additional revenues and lower benefits more gradually, starting sooner, might produce slightly lower debt ratios than those shown here.
To summarize, policymakers can avert more than three-quarters of the projected 35-point increase in the debt ratio through 2048 and likewise shrink the fiscal gap by more than three-quarters by restoring solvency to the trust funds through revenue increases, benefit reductions, or a combination of the two. But to the extent that they instead restore trust fund solvency through transfers from the general fund, the 2048 debt ratio and the fiscal gap would not be reduced.
Uncertainty of Long-Run Projections
Like any long-run budget projections, these are highly uncertain. In June 2018 CBO estimated, for example, that if the per-beneficiary costs of Medicare and Medicaid grew one percentage point per year more quickly than projected, the debt ratio in 2048 would be 54 percentage points higher, while if per-beneficiary costs grew one percentage point per year more slowly, the 2048 debt ratio would be 42 percentage points lower. CBO also estimated that if productivity in the economy grew by one-half percentage point a year less or more rapidly than it had projected, the 2048 debt ratio would be roughly 30 percentage points higher or lower.[11]
Likewise, if real interest rates over the 2019-2048 period are one-half percentage point higher or lower than we project, the debt ratio in 2048 would be 13 percentage points higher or 11 percentage points lower than we project, all else being equal. Since these variables could all move favorably or unfavorably at the same time, and since other critical variables are also inherently difficult to predict, the actual range of estimating uncertainty surrounding these long-run projections is even greater.
In addition to uncertainty about the economic future, considerable policy uncertainty surrounds our projections. As Appendix 1 explains, our projections approximate a continuation of current laws and policies, accounting for scheduled changes in those laws.
But suppose, for instance, that policymakers take steps to further reduce revenues, as House Republican leaders have proposed.[12] Table 1 shows the effects on the long-term outlook if the tax cuts in the 2017 tax law that are scheduled to expire are instead made permanent, three ACA taxes do not take effect as scheduled,[13] and the so-called “normal tax extenders” (which expired last year or are scheduled to expire at some future point) are instead made permanent, without any tax increases or spending cuts to offset some or all of the revenue loss from these policies. In addition, policymakers may reach a new agreement to set discretionary defense and non-defense appropriations starting in 2020 at levels that are consistent with those set under the two-year bipartisan agreement that covers 2018 and 2019, in order to prevent the sharp reductions that otherwise are scheduled under current law. At these higher levels, discretionary spending would still be low by historical standards.[14] But the increases would add to the long-term debt ratio relative to projections, including ours, that assume these steep cuts will take effect, as shown in Table 1.
If all those tax and spending policy costs occurred (without offsetting revenue increases or spending cuts), the 2048 debt would reach 158 percent of GDP rather than 113 percent. If only the tax policies are continued, the debt would reach 139 percent. Over three decades, continuing those revenue-losing policies would be almost half again as costly as continuing the discretionary appropriations increases enacted for 2018 and 2019, even though the latter would occur sooner and so compound over a longer period. Continuing the revenue-losing policies and the defense increase would be almost four times as costly as continuing the non-defense discretionary increases.[15]
On the other hand, as noted in the previous section, if solvency in the Social Security and Medicare Hospital Insurance trust funds is achieved by increasing revenues dedicated to those trust funds or reducing their benefits, the 2048 debt would be 86 percent of GDP, notably lower than the 113 percent we project.
Policymakers shouldn’t ignore long-run budget projections just because they’re uncertain. After all, some of the important underlying trends — notably the aging of the population and rising health costs — are highly probable, even if we can’t predict their magnitude precisely. But the uncertainty grows dramatically as the time horizon expands. That’s why we and CBO focus on the next 30 years or so for long-run budget estimates, a period that amply documents future fiscal pressures.
| TABLE 1 | ||
|---|---|---|
| Different Economic or Policy Assumptions Change Projected 2048 Debt Ratio | ||
| Change in debt as a percent of GDP | Resulting ratio: 2048 debt as a percent of GDP | |
| Changes in economic assumptions, relative to baseline: | ||
| 1.0 percentage pt. higher annual excess cost growth in Medicare/Medicaid(a) | +54 | 167 |
| 1.0 percentage pt. lower annual excess cost growth in Medicare/Medicaid(a) | -42 | 71 |
| 0.5 percentage pt. higher annual productivity growth(a) | -29 | 84 |
| 0.5 percentage pt. lower annual productivity growth(a) | +32 | 145 |
| 0.5 percentage pt. higher Treasury interest rates | +13 | 125 |
| 0.5 percentage pt. lower Treasury interest rates | -11 | 102 |
| New savings or new policy costs, not offset: | ||
| Continue expiring provisions of 2017 tax law(b) | +19 | |
| Repeal postponed Affordable Care Act taxes | +5 | |
| Continue 100% expensing and other “normal tax extenders” | +3 | |
| Subtotal, tax changes(b) | +27 | 139 |
| Raise defense caps starting in 2020(c) | +9 | |
| Raise non-defense caps starting in 2020(c) | +10 | |
| Subtotal, appropriations changes | +18 | 131 |
| Subtotal, tax plus appropriations changes | +45 | 158 |
| Achieve solvency in Social Security and Medicare HI via tax and benefit changes | -27 | 86 |
Appendix 1: Technical Note on Our Projections
We base the first ten years of our projections on CBO’s baseline budget estimates published in April 2018.[16] We adjust those projections in two respects. Specifically, we assume that:
- Emergency and disaster spending will reflect its average level. The CBO baseline generally continues the current-year funding level for routine disaster relief, as constrained by limits included in the 2011 Budget Control Act. It also continues any emergency funding that Congress may have enacted to supplement routine disaster relief when natural disasters are exceptionally expensive. Indeed, funding for 2018 is far above average because of the major hurricanes in the summer of 2017. Recognizing that the 2017 hurricanes were atypical, CBO also published an alternative projection of emergency funding representing the recent five-year average costs of such emergencies; our baseline incorporates that path.
- Certain timing anomalies will be smoothed. Some programs — e.g., Medicare Part C, Supplemental Security Income (SSI), and Veterans’ Compensation and Pensions — accelerate their monthly payments by a few days if the payments would otherwise fall on a weekend. When October 1, the start of the federal fiscal year, falls on a weekend, there may be 13 “monthly” payments in the prior fiscal year; as a result, other fiscal years may have 11. This distorts the year-to-year path of expenditures, deficits, and debt. We smooth the path by assuming 12 such payments each year.[17]
In all other respects, we follow CBO’s estimates through 2028, including its assumptions that there will not be future changes in law or policy. As discussed in this analysis, our estimates of the debt ratio would be noticeably higher if, for instance, we assumed continuation of the higher level of discretionary funding allowed for 2019, continuation of the expiring tax cuts, or the permanent delay of certain health taxes.
Beyond 2028, we base our projections on other recent sources. Those include CBO’s most recent long-term budget outlook and the latest reports of the Social Security and Medicare trustees (each published in June 2018).[18] Specifically, we assume that after 2028:
- Revenues and GDP are as projected in CBO’s June 2018 long-term extended baseline, as are expenditures for Medicaid, CHIP, health insurance subsidies, and all other mandatory programs.
- Social Security and Medicare costs grow, as a percent of GDP, with those in the trustees’ intermediate projections. (CBO makes its own projections of Social Security and Medicare costs; it’s projected Medicare growth rate is notably higher.)
- Discretionary spending grows with inflation plus population, thus keeping real per-capita spending constant at 2028 levels. (CBO assumes this category of spending rises more quickly, with GDP.)
- Emergency costs, including the routine “disaster” allowance permitted under the 2011 Budget Control Act, gradually increase over the second decade, from CBO’s five-year average of 0.10 percent of GDP to the 1989-2018 average of 0.14 percent of GDP.
- Additional federal borrowing to finance student loans and certain other non-budgetary transactions continue to equal 0.2 percent of GDP, as they do in 2028.
- For net interest, we first calculate how much borrowing results from the revenue and spending totals already calculated and then apply the overall interest rate on federal debt, assuming the continuation of the average interest rate on new federal debt that CBO projects for 2028 (3.2 percent).
CBO reported its long-term projections both with and without macroeconomic feedback; CBO’s feedback calculation assumes that a growing debt will slightly reduce GDP growth and increase interest rates, relative to the levels CBO assumes without such feedback. We use the CBO projections that do not include feedback, for two reasons. First, estimates of the macroeconomic feedbacks of policy changes are highly uncertain.[19] Second, the size of the fiscal gap, discussed in this analysis, is unaffected by macroeconomic feedback. To the extent a rising debt ratio may generate negative feedback in the form of lower GDP and higher interest rates — and thus make the debt ratio in 2048 still higher — actions to raise revenue and cut programs sufficiently would both reverse all the feedback and cut primary deficits enough to reduce the 2048 debt ratio to its current level. Thus, we can calculate the needed primary deficit reduction (the size of the fiscal gap) without knowing if there will be any feedback from failure to close the fiscal gap, much less its possible size. “It would not be informative,” as CBO has written, “to include the negative economic effects of rising debt (and their feedback to the budget) in the fiscal gap calculation because the fiscal gap shows the budgetary changes required to keep debt from rising in the first place; if those budgetary changes were made, the negative economic effects (and their feedback to the budget) would not occur.”[20]
Table 2 shows our projections for each major category of the budget as a percent of GDP in selected years. Data for each year, including historical values since 1995, are posted on our website in a spreadsheet accompanying our analysis.[21]
| TABLE 2 | ||||||||||
|---|---|---|---|---|---|---|---|---|---|---|
| Outlays, Revenues, Deficits, and Debt as Percent of GDP Through 2048 | ||||||||||
| Social Security | Medicare | Medicaid, CHIP, and marketplace subsidies | Other program outlays | Total program outlays | Net interest | Revenues | Surplus (+) / Deficit (-) | Debt held by public | ||
| 2000 | 4.0% | 1.9% | 1.2% | 8.3% | 15.4% | 2.2% | 20.0% | +2.3% | 34% | |
| 2005 | 4.0% | 2.3% | 1.4% | 10.0% | 17.8% | 1.4% | 16.7% | -2.5% | 36% | |
| 2010 | 4.7% | 3.0% | 1.9% | 12.4% | 22.0% | 1.3% | 14.6% | -8.7% | 61% | |
| 2015 | 4.9% | 3.0% | 2.2% | 9.2% | 19.3% | 1.2% | 18.1% | -2.4% | 73% | |
| 2018 | 4.9% | 3.0% | 2.3% | 9.0% | 19.2% | 1.6% | 16.6% | -4.2% | 78% | |
| 2020 | 5.0% | 3.1% | 2.2% | 8.5% | 18.9% | 2.2% | 16.7% | -4.4% | 81% | |
| 2025 | 5.6% | 3.7% | 2.4% | 7.7% | 19.5% | 2.9% | 17.5% | -4.8% | 90% | |
| 2028 | 6.0% | 4.0% | 2.5% | 7.5% | 20.0% | 3.0% | 18.5% | -4.5% | 94% | |
| 2030 | 6.1% | 4.2% | 2.6% | 7.3% | 20.3% | 2.9% | 18.6% | -4.6% | 96% | |
| 2035 | 6.3% | 4.6% | 2.8% | 7.1% | 20.8% | 3.1% | 18.9% | -5.0% | 102% | |
| 2040 | 6.4% | 4.8% | 3.0% | 6.8% | 20.9% | 3.3% | 19.3% | -5.0% | 108% | |
| 2045 | 6.3% | 4.9% | 3.2% | 6.5% | 20.8% | 3.4% | 19.7% | -4.5% | 112% | |
| 2048 | 6.2% | 4.9% | 3.3% | 6.3% | 20.7% | 3.5% | 19.9% | -4.2% | 113% | |
Appendix 2: Changes in CBPP Estimates Since 2010 and 2016
Table 3 and Table 4 present the change in CBPP’s long-term estimates since 2010 and 2016, respectively, showing how changes in health care spending, interest rates, and other factors affected the debt ratio and fiscal gap.[22]
| TABLE 3 | ||
|---|---|---|
| Change in CBPP’s Projections Since 2010 | ||
| Debt ratio | Fiscal Gap | |
| 2048 debt ratio and fiscal gap estimated in 2010, as percentages of GDP | 289 | 4.7 |
| Factors that reduced (-) or increased (+) debt ratio and fiscal gap: | ||
| Slower growth of major health programs | -94 | -2.4 |
| Lower interest rates | -91 | -1.7 |
| All other factors, net | +8 | +0.7 |
| Total, reduction in debt ratio and fiscal gap | -176 | -3.4 |
| 2048 debt ratio and fiscal gap estimated in 2018, as percentages of GDP | 113 | 1.3 |
The “other factors” in Table 3, above, include lower funding for discretionary programs,[23] and higher revenues,[24] than we projected in 2010, which are more than offset by higher spending on Social Security and other mandatory programs, slightly lower GDP, and an expansion of debt as a result of the student loan program being converted from a loan guarantee to a direct loan program. (That conversion requires more federal borrowing. While the extra borrowing is fully offset by the acquisition of financial assets by the government, the debt limit and the fiscal gap ignore those assets.) And in the case of the fiscal gap, changing the starting date from 2010 to 2018 also affects the calculation.
The “other factors” in Table 4, below, include changes in the cost of other mandatory programs, changes in other means of financing, and in the case of the fiscal gap, changing the starting date from 2016 to 2018.
Table 4 suggests that the long-term cost of last year’s increase in the limits on annual appropriations is far smaller than the cost of the 2017 tax bill. Both are temporary, and so play a much smaller role over 30 years than in the short term. But even if the increases in appropriations continue indefinitely and the various temporary tax provisions become permanent, the tax provisions will cost almost twice as much as the appropriations increases, as Table 1 shows.
| TABLE 4 | ||
|---|---|---|
| Change in CBPP’s Projections Since 2016 | ||
| Debt ratio | Fiscal Gap | |
| 2048 debt ratio and fiscal gap estimated in 2016, as percentages of GDP | 107 | 1.1 |
| Factors that reduce (-) or increase (+) debt ratio and fiscal gap: | ||
| Lower revenues | +17 | +0.5 |
| Lower GDP | +7 | +0.2 |
| Higher defense, non-defense, and emergency funding | +2 | +0.1 |
| Lower interest rates | -11 | -0.3 |
| Slower growth of Social Security and major health programs | -9 | -0.3 |
| All other factors, net | 0 | +0.0 |
| Total, increase in debt ratio and fiscal gap | +6 | +0.2 |
| 2048 Debt ratio and fiscal gap estimated in 2018, as percentages of GDP | 113 | 1.3 |
Appendix 3: Comparing Our 30-Year Projections With Those by Alan Auerbach, William Gale, and Aaron Krupkin
In their most recent long-term budget outlook, Alan Auerbach, William Gale, and Aaron Krupkin (AGK) estimate a fiscal gap through 2048 of 4.2 percent of GDP, with debt reaching 200 percent of GDP in that year.[25] As noted, our fiscal gap equals 1.3 percent of GDP through 2048, with debt reaching 113 percent of GDP in that year. Table 5 quantifies the ways in which AGK’s estimate differs from ours.
| TABLE 5 | ||
|---|---|---|
| How the Auerbach-Gale-Krupkin Projections Differ from CBPP’s | ||
| Debt ratio | Fiscal Gap | |
| CBPP: 2048 debt ratio and fiscal gap, as percentages of GDP | 113 | 1.3 |
| AGK assumptions/estimates that reduce (-) or increase (+) debt ratio and fiscal gap: | ||
| Lower revenues | +36 | +1.3 |
| Assumed extension of expiring tax provisions | +26 | +0.9 |
| Assumed further tax cuts to offset real bracket creep after 2028 | +10 | +0.4 |
| Higher defense, non-defense, and emergency funding | +36 | +1.3 |
| Assumed continuation of 2018-2019 funding levels, increasing the caps in place for 2020 and 2021 | +18 | +0.7 |
| Assumed growth of funding with GDP after 2028 | +18 | +0.6 |
| Higher costs of Medicare, Medicaid, CHIP, and ACA subsidies | +6 | +0.2 |
| Lower costs of Social Security | -1 | -* |
| Higher costs of other mandatory programs | +8 | +0.3 |
| Assumed extension of expiring tax provisions, re refundable tax credits | +1 | +* |
| Assumed growth with GDP after 2028 | +6 | +0.2 |
| Higher interest rates | +12 | +0.1 |
| Higher GDP | -5 | -0.1 |
| Technical factors | -4 | -0.2 |
| Total, increase in debt ratio and fiscal gap | +88 | +2.9 |
| AGK: 2048 debt ratio and fiscal gap, as percentages of GDP | 200 | 4.2 |
The key difference between our two long-term outlooks is that CBPP projects what is often called “current law,” which assumes that most scheduled changes in law will in fact occur regardless of policymakers’ proclivity to extend expiring tax breaks or override funding limits. AGK, in contrast, projects what is often called “current policy,” which generally assumes that current policy will remain in force irrespective of any future changes required by law. Four-fifths of the difference between our and AGK’s estimates of the 2048 debt ratio, and nine-tenths of the difference between our and AGK’s estimates of the 30-year fiscal gap, come because AGK assume that future policymakers will act to extend current tax and appropriations policy. In short, the differences between our two projections come very largely from asking — and answering — two different questions.[26]
Consider tax policy. Most of the provisions of the 2017 tax law are scheduled to expire at the end of 2025. Our projections reflect those scheduled expirations, while AGK’s projections assume that these provisions continue indefinitely beyond 2025.[27] In addition, AGK projects revenues to grow with GDP after 2028, while we project that revenues will grow slightly faster than GDP due to bracket creep (the natural increase in tax revenue as real economic growth pushes a greater share of income into higher tax brackets). The AGK projections thus assume that policymakers will enact additional tax cuts sufficient to offset real bracket creep.
Likewise, consider discretionary appropriations. The 2018 Bipartisan Budget Act provided substantial relief in 2018 and 2019 from the very tight caps and “sequestration” cuts imposed by the 2011 Budget Control Act, but the caps and sequestration limits are scheduled to return for 2020 and 2021, deeply cutting defense and non-defense discretionary funding in those years. Our projections assume that the cuts occur as scheduled, reducing funding for these programs in those years, with the reduced 2021 funding levels then growing with inflation through 2028. We also assume these expenditures will grow with inflation and population after 2028.[28] AGK’s projections assume that policymakers instead extend the higher 2019 appropriations levels, with defense growing with inflation through 2028 and non-defense programs growing with inflation and population through 2028. In addition, AGK projects both defense and non-defense discretionary spending to grow with GDP after 2028.
As Table 5 shows, adopting AGK’s current-policy approach just to tax and appropriations policies would increase our 2048 debt ratio of 113 percent of GDP, and our 30-year fiscal gap of 1.3 percent of GDP, as follows:
- Expiring tax provisions (including the refundable portion of the Child Tax Credit, which counts as an expenditure in the federal budget): AGK’s approach increases the debt ratio by 27 percentage points and the fiscal gap by 1.0 percent of GDP.
- Tax cuts to offset real bracket creep after 2028: AGK’s approach increases the debt ratio by 10 percentage points and the fiscal gap by 0.4 percent of GDP.
- Appropriations caps: AGK’s approach increases the debt ratio by 18 percentage points and the fiscal gap by 0.7 percent of GDP.
- Appropriations after 2028: AGK’s approach increases the debt ratio by 18 percentage points and the fiscal gap by 0.6 percent of GDP.
AGK notes that its approach of keeping revenues and discretionary expenditures constant as percentages of GDP after 2028 “implicitly assumes that policy makers will make a series of (small) tax cuts and discretionary spending increases over time.”
AGK also extends that approach to mandatory programs outside of Social Security and health care, which under current law will shrink modestly as a percent of GDP over time as the economy grows. (The AGK approach implicitly assumes that policymakers will modestly expand these programs, as well.) Relative to our projections, AGK’s constant-percent-of-GDP-after-2028 approach to revenues, discretionary programs, and mandatory programs other than Social Security and health care adds 34 percentage points to the 2048 debt ratio and 1.2 percent of GDP to the fiscal gap.
Appendix 4: A Primer on Discounting, Present Values, and Fiscal Gaps
As noted in this analysis, the fiscal gap measures the change in non-interest spending or revenues needed to keep the ratio of debt to GDP the same in some specified future year as it is today. This is often called “stabilizing” the debt ratio. As CBO explains, “The fiscal gap is conceptually similar to the actuarial balances that are commonly reported for the trust funds for Part A of Medicare and Social Security. ... All three measures [the actuarial balances of the two trust funds and the fiscal gap] quantify a long-term shortfall or surplus in present-value terms — that is, as a single number that describes a flow of future revenues or outlays in terms of an equivalent lump sum received or spent today — and all three can be expressed as a percentage of GDP.”[29]
A dollar today is worth more than a dollar in the future. Present values (PVs) put future dollar amounts in present terms by discounting them by the Treasury interest rate, compounding over time. For example, if the Treasury interest rate is assumed to be 4.0 percent each year through 2048, then $104 next year is equivalent to $100 this year. Similarly, $324 in 2048 is equivalent to $100 this year. Because PV calculations use the Treasury interest rate as the discount rate, they automatically account for the fact that even a one-time revenue increase or program expenditure cut in the coming fiscal year will by itself reduce projected debt, and thus will also reduce projected interest on the debt, in both that year and all subsequent years. Moreover, because the reductions in projected debt and interest will continue, they will compound over time. This fact has three consequences.
- Because interest savings are automatically built into fiscal gap and PV calculations, the needed change in spending or revenues to close the gap excludes interest payments. “Changes in spending” is thus a synonym for “program cuts” — that is, cuts to government programs, such as Social Security, health care, transportation, defense, veterans’ benefits, law enforcement, and so on. Program cuts are also called reductions in “primary” spending; to raise revenues and cut primary spending is called “reducing the primary deficit.”
- A fiscal gap, like any PV, is a total over many years, in this case 30 years (through 2048). As a result, the dollar values of even a small fiscal gap will seem huge. That is why we and other analysts present fiscal gaps as percentages of GDP. Technically, the PV of the actuarial imbalance in the federal budget over the coming 30 years (the dollar fiscal gap) is divided by the PV of GDP over that period. We estimate the PV of GDP over that period at $687 trillion.
- The fiscal gap is commonly defined as the primary savings needed every year over a given period to stabilize the debt ratio over that period. This simple definition may mislead readers into thinking that the primary savings we estimate, 1.3 percent of GDP — or $266 billion in 2019 alone — must be fully effective in 2019 or else the calculated 30-year fiscal gap would be higher. Not so. Only the discounted 30-year total matters, not the year-by-year path. Figure 5, for example, shows two paths of year-by-year primary savings, each of which has the same PV measured as a percentage of GDP. Either path would eliminate the 30-year fiscal gap. Of course, since the 30-year total is what matters, securing fewer savings now requires securing more savings later, as Figure 5 shows. But that is not a higher total — not a larger fiscal gap.

End Notes
[1] Richard Kogan et al., Long-Term Budget Outlook Has Improved Significantly Since 2010 But Remains Challenging, Center on Budget and Policy Priorities, August 18, 2016, https://www.cbpp.org/research/federal-budget/long-term-budget-outlook-has-improved-significantly-since-2010-but-remains. In this analysis, when referring to our 2016 report we use figures that correct a small error in the projection of Medicare costs. (See Appendix 2.)
[2] For more information, see Congressional Budget Office, The 2018 Long-Term Budget Outlook, June 26, 2018, Table 4, p. 23, https://www.cbo.gov/publication/53919.
[3] Paul N. Van de Water, 2017 Tax Law Heightens Need for More Revenues, Center on Budget and Policy Priorities, November 15, 2018, https://www.cbpp.org/research/federal-tax/2017-tax-law-heightens-need-for-more-revenues.
[4] See “Why Does Raising the Retirement Age Reduce Benefits?” in Kathy A. Ruffing and Paul N. Van de Water, Social Security Benefits Are Modest, Center on Budget and Policy Priorities, updated August 7, 2017, https://www.cbpp.org/cms/?fa=view&id=3368.
[5] CBO’s projections, which we use for this subset of mandatory expenditures, show their costs shrinking from 2.68 percent of GDP in 2018 to 2.37 percent by 2028. Two-thirds of this 0.31 percentage-point decrease comes from three mandatory programs: SNAP (formerly food stamps), the refundable portion of the Earned Income Tax Credit, and the refundable portion of the Child Tax Credit. Those three programs had declined relative to GDP even more rapidly from 2010 through 2018, as the economy recovered from the Great Recession. Their continued shrinkage as a percent of GDP during more normal economic times is caused in part by the fact that their eligibility thresholds grow with inflation while per-person GDP grows faster than inflation. (The increase in the Child Tax Credit enacted in the 2017 tax law has no effect on the 2018 and 2028 figures above because its small cost — 0.05 percent of GDP — does not appear until fiscal year 2019 and disappears in 2027, after the expiration of that provision of the 2017 tax law.) Also see Robert Greenstein, Richard Kogan, and Roderick Taylor, Program Spending Outside Social Security and Medicare Historically Low as a Percent of GDP and Projected to Fall Further, Center on Budget and Policy Priorities, updated June 26, 2018, https://www.cbpp.org/research/program-spending-outside-social-security-and-medicare-already-low-in-historical-terms-is.
[6] Of course, as our nation becomes wealthier, it might choose to spend increasing constant-dollar amounts per person on infrastructure, research, education, and other such programs. But such a choice — which could keep this category of the budget from falling as a percent of GDP — is not consistent with the historical pattern. And in the case of benefit programs, it would require enacting increases in benefit amounts or expansions in eligibility, whereas our projections reflect spending based on current law. See Appendix 2 of Richard Kogan, Kathy Ruffing, and Paul N. Van de Water, Long-Term Budget Outlook Remains Challenging, But Recent Legislation Has Made It More Manageable, Center on Budget and Policy Priorities, June 27, 2013, https://www.cbpp.org/research/long-term-budget-outlook-remains-challenging-but-recent-legislation-has-made-it-more.
[7] Kathy Ruffing, Kris Cox, and James Horney, The Right Target: Stabilize the Federal Debt, Center on Budget and Policy Priorities, January 12, 2010, https://www.cbpp.org/research/the-right-target-stabilize-the-federal-debt.
[8] CBO, The 2013 Long-Term Budget Outlook, p. 10, https://www.cbo.gov/publication/44521.
[9] The Disability Insurance trust fund is expected to be depleted in 2032, the much larger Old-Age and Survivors Insurance fund (and the two funds combined) in 2034.
[10] Social Security and Medicare Boards of Trustees, Status of the Social Security and Medicare Programs, A Summary of the 2018 Annual Reports, June 5, 2018, https://www.ssa.gov/OACT/TRSUM/index.html.
[11] CBO. See data underlying Figure 11 in https://www.cbo.gov/system/files?file=2018-07/51119-2018-06-ltbo.xlsx, which backs up CBO’s June 2018 report, The 2018 Long-Term Budget Outlook.
[12] Chuck Marr and Brendan Duke, New House Republican Tax Proposal Fails Fiscal Responsibility Test, While Favoring the Wealthiest, Center on Budget and Policy Priorities, updated September 13, 2018, https://www.cbpp.org/research/federal-tax/new-house-republican-tax-proposal-fails-fiscal-responsibility-test-while
[13] The three health taxes are the tax on health insurance providers, the medical device tax, and the tax on certain high-cost health insurance plans (the so-called Cadillac tax).
[14] As noted previously, under current projections, defense and non-defense discretionary spending is on track to fall to historically low levels as percentages of GDP in 2021 and 2020, respectively, with data stretching back to 1962. If the recent temporary increases in discretionary appropriations instead continue indefinitely, those programs would still fall to historical lows, but not quite as rapidly: defense would hit a historical low, measured as a share of GDP, in 2030, while non-defense discretionary would hit a historical low in 2024.
[15] In addition to the “Tax 2.0” bill, the budget plan that the House Budget Committee Republicans reported in July (but which the House never voted on) calls for significant defense increases relative to the current-law defense caps that come back into force in 2020. That plan does not call for equivalent increases in non-defense discretionary programs; to the contrary, it would cut that area well below the austere sequestration levels scheduled for 2020 under current law.
[16] Congressional Budget Office, The Budget and Economic Outlook: 2018 to 2028, April 9, 2018, https://www.cbo.gov/publication/53651. On May 4, 2018, CBO reposted the file of spending projections by budget account with corrections to budget authority and outlays for certain accounts, and we work from the CBO figures as corrected.
[17] 2028 is a year with 13 such “monthly” payments and therefore an artificially high spending level. We also remove these timing anomalies from CBO’s estimates for the current year (2018) and we do not project them to recur after 2028.
[18] See CBO, The 2018 Long-Term Budget Outlook, op. cit., and Social Security Administration, The 2018 OASDI Trustees Report, https://www.ssa.gov/OACT/TR/2018/index.html.
[19] Paul N. Van de Water and Chye-Ching Huang, Budget and Tax Plans Should Not Rely on “Dynamic Scoring,” Center on Budget and Policy Priorities, updated November 17, 2014, https://www.cbpp.org/research/budget-and-tax-plans-should-not-rely-on-dynamic-scoring.
[20] CBO, The 2015 Long-Term Budget Outlook, p. 96, https://www.cbo.gov/publication/50250. Also see Richard Kogan et al., Difference Between Economic Growth Rates and Treasury Interest Rates Significantly Affects Long-Term Budget Outlook, Center on Budget and Policy Priorities, February 27, 2015, Appendix 2, “Why Long-Run Projections Need Not Be Dynamic,” https://www.cbpp.org/research/federal-budget/difference-between-economic-growth-rates-and-treasury-interest-rates.
[21] See https://www.cbpp.org/sites/default/files/atoms/files/11-15-18bud-data.xlsx.
[22] Our methodology for disaggregating the change in the debt ratio from a prior estimate to a newer estimate is explained in detail in the Appendix to Kogan et al., Long-Term Budget Outlook Has Improved Significantly Since 2010 But Remains Challenging.
[23] Outlays for discretionary programs from 2011 through 2017 — for both defense and non-defense programs — have been lower than we and CBO projected in 2010 because of the funding cuts and caps imposed by legislation enacted in 2011, including the “sequestration” cuts. The recent bipartisan agreement to increase discretionary funding in 2018 and 2019 largely, but not entirely, restores discretionary outlays in those two years to the 2010 levels, after adjusting for inflation. But the scheduled re-imposition of caps and sequestration in 2020, which our projections here assume, would deepen the discretionary cuts that have been experienced since 2010.
[24] The revenue levels that we project through 2048 are, on net, higher than those we projected in 2010. For the 15 years from 2010 to 2025, revenues already have been — or are projected to continue to be — lower than we assumed in 2010, in part because the recession was deeper than CBO had assumed and in part because of the tax cuts enacted at the end of 2017. But from 2026 on, revenues are projected to be higher than we projected in 2010, in part because many of the tax cuts enacted last year are scheduled to expire at the end of 2025. Other reasons why revenues are higher than we had projected in 2010 include: 1) the 2017 tax law contained a permanent provision somewhat slowing the indexing of the tax code for inflation, which will result in slightly faster real bracket creep; 2) the 2013 American Taxpayer Relief Act, which largely made the 2001 Bush tax cuts permanent (as our 2010 projection had assumed), scaled them back modestly; and 3) the Affordable Care Act, enacted after our 2010 report was issued, contained various revenue-raising provisions.
[25] Alan J. Auerbach, William G. Gale, and Aaron Krupkin, The Federal Budget Outlook: We Are Not Winning, Tax Notes, July 30, 2018, p. 622. That report also includes an analysis of the sensitivity of its results to different assumptions. Alan J. Auerbach is the Robert D. Burch professor of economics and law, director of the Burch Center for Tax Policy and Public Finance, and chair of the Economics Department at the University of California, Berkeley. He is also a research associate at the National Bureau of Economic Research. William G. Gale is the Arjay and Frances Miller chair in federal economic policy and a senior fellow in the economic studies program at the Brookings Institution. He is also co-director of the Urban-Brookings Tax Policy Center. Aaron Krupkin is a senior research analyst at the Brookings Institution and the Tax Policy Center.
[26] In addition, both AGK’s current policy projections and our current law projection involve some judgment calls, such as what current law and current policy mean with respect to discretionary appropriations after 2021, when the statutory funding caps expire. In addition, both projections assume that the Social Security and Medicare HI trust funds will pay benefits from unlimited general fund transfers after existing assets and dedicated revenues run short. As discussed previously, to the extent that policymakers stave off trust fund insolvency by raising dedicated revenues or reducing benefits, our projected debt ratios and fiscal gaps would be smaller.
[27] In addition, our projections reflect the scheduled phase-out of the “expensing” of certain business investments and the expiration of other “normal tax extenders.” It also reflects three health taxes enacted in the ACA that have been postponed but are scheduled to become effective in future years: the tax on health insurance providers, the medical device tax, and the tax on certain high-cost health insurance plans (the so-called Cadillac tax). AGK’s projection, in contrast, reflects those laws as they operate today.
[28] There is no obviously ideal method of projecting appropriations in years when there are no caps. However, we believe our approach of assuming constant real per-person funding after 2028 better fits the historical record than assuming a constant percent of GDP after 2028.
[29] CBO, The 2013 Long-term Budget Outlook, p. 10, https://www.cbo.gov/publication/44521.
More from the Authors

Areas of Expertise