Census Data Show Poverty and Inequality Remained High in 2012 and Median Income Was Stagnant, But Fewer Americans Were Uninsured
Figures Also Show SNAP’s Strong Antipoverty Impact
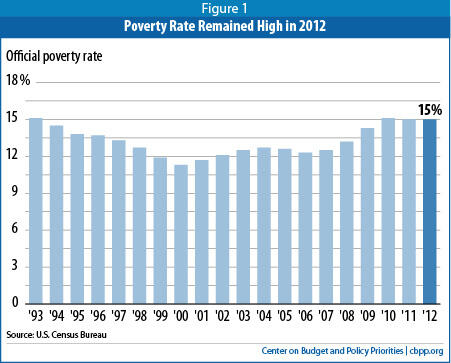
The economic recovery has yet to produce significant gains for Americans in the bottom and middle of the economic scale, Census Bureau data released this week show. The poverty rate remained unchanged at a high 15.0 percent in 2012 and median household income remained unchanged at $51,017, some $4,600 below its 2007 level. Income inequality remained at record high levels by a number of measures.
Since the end of the robust recovery of the 1990s, the economy has failed to produce real gains for low- and moderate-income families. In 11 of the last 12 years, poverty has worsened or failed to improve and even before the Great Recession, median income lagged behind its 1999 level.
The findings came just a few days before the House of Representatives approved a bill to push 3.8 million people off SNAP (the Supplemental Nutrition Assistance Program, formerly known as food stamps) in 2014 and reduce benefits for many others, cutting the program by $39 billion over ten years. If enacted, this bill would make poverty and hardship more severe.
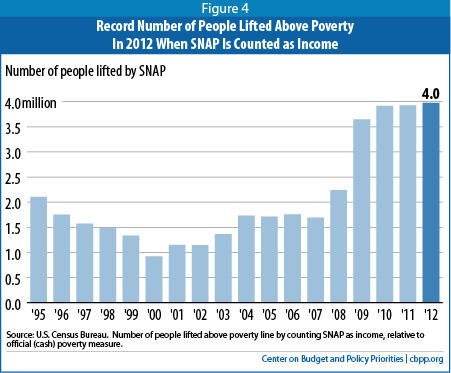
Census also released data showing that when SNAP benefits are counted as income in measuring poverty, as most analysts favor, they lifted 4.0 million people out of poverty in 2012. SNAP also reduces the severity of poverty for a much larger number of people. These facts highlight SNAP’s role in fighting poverty and hunger as Congress debates sharp cuts to the program.
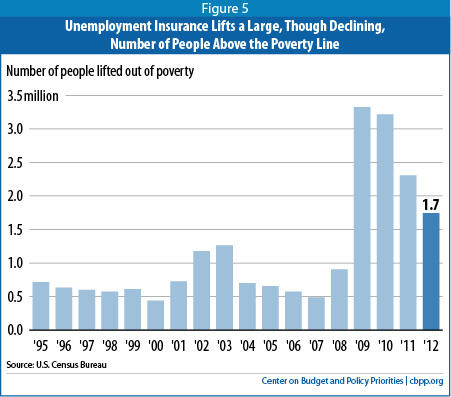
The Census data also show that unemployment insurance (UI) benefits, which do count as income in measuring poverty, kept 1.7 million people (workers and their family members) above the poverty line in 2012. This was 600,000 fewer than in 2011 and 1.5 million fewer than in 2010, as fewer jobless Americans qualified for UI benefits.
Analysis of the new Census data shows that if UI benefits had been as effective at reducing poverty among unemployed workers and their families in 2012 as in 2010, the overall poverty rate would have fallen over the past two years, rather than failing to improve. The number of people whom UI keeps out of poverty may drop even more in 2014; most federal unemployment benefits are authorized only through the end of 2013, and it is questionable whether Congress will agree to extend them, even in scaled-back form.
Taken together, the new Census income, poverty, and health insurance figures highlight the economic challenges that low-income Americans continue to face and underscore the important role that public policies can play in reducing poverty and hardship — or in making them worse.
Continued High Poverty, Recession-Era Median Income, and Record Inequality
The percentage of Americans living in poverty stood at 15.0 percent in 2012, unchanged from 2011, the Census Bureau reported. The year 2012 marked the third full year of the economic recovery, which officially began in June 2009. The poverty rate has either risen or failed to improve significantly in every year since 2000, with the exception of 2006.
Such persistently high poverty after a recession is not unique to the current downturn. In each of the previous four business cycles, poverty has not started to fall for at least two years into the recovery. The poverty rate improved significantly in the first full year after the mid-1970s recession but not until the second year after the back-to-back recessions of the early 1980s, the third year after the 1990s recession, and the fifth year after the 2001 recession.
Trends for middle-income households were also disappointing. Median household income — the income of the household in the exact middle of the income distribution — was $51,017 in 2012, statistically unchanged from 2011 after adjusting for inflation. Between 2009 and 2012, median income fell 4.3 percent, suggesting that middle-income households have lost ground during the economic recovery since 2009. Median income in 2012 was still 8.3 percent below its 2007 (pre-recession) level and 9.0 percent below its 1999 level.
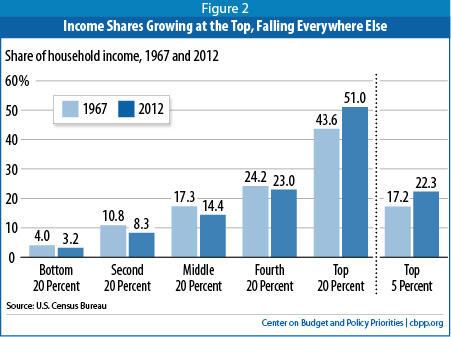
Further, income inequality is at a record high by several measures. The shares of national income going to the bottom fifth and bottom three-fifths of households in 2012 both tied for the lowest on record at 3.2 percent and 25.9 percent, respectively, with data back to 1967. (See Figure 2.) The share going to the top fifth was virtually unchanged from last year’s record high. A key Census summary measure of household income inequality (known as the “Gini coefficient”) also tied its record high, with data back to 1967.
Preliminary tax-return data analyzed by economist Emmanuel Saez include information on both capital gains income and the full pay levels for people at the top of the ladder. Using this fuller income accounting, Saez finds that average incomes in 2012 rose by 19.6 percent — or more than $200,000 — for the top 1 percent of households but by just 1.0 percent among the other 99 percent of households. The gains for the extremely wealthy — the top 0.1 percent — were even larger, with their average income rising $1.4 million. In fact, the increase in the average income among the top 0.1 percent was many times larger than most middle-income families’ total income in 2012. Saez also finds that the share of income going to the top 10 percent of households rose to its highest level on record in 2012, with data available back to 1917.[1]
Modest Improvement in Health Insurance Coverage
The share of Americans who are uninsured declined modestly from 15.7 percent in 2011 to 15.4 percent in 2012, the Census data show. This marks the second consecutive year of decline from 2010’s high of 16.3 percent. The number of uninsured Americans remained unchanged in 2012 at 48 million.
The primary contributors to this reduction, according to the Census data, were coverage gains among children, expanded private coverage among the non-elderly, and increased enrollment in Medicare as the population ages. Health reform will result in greater progress in reducing the ranks of the uninsured once its major coverage expansions take effect in 2014.
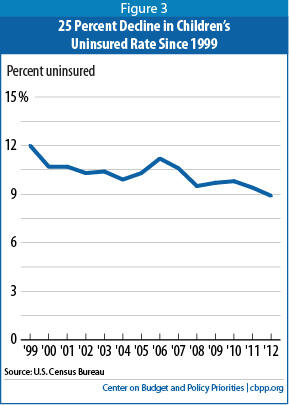
Among children, the share who were uninsured fell from 9.4 percent in 2011 to 8.9 percent in 2012 — a historic low — due to gains in private coverage. Medicaid and Children’s Health Insurance Program (CHIP) enrollment among children remained steady, likely in part because of a health reform requirement that states maintain their eligibility rules and procedures for the two programs. The 2012 uninsured rate among children was more than one-quarter below the level in 1999, the first year for which comparable Census data were collected. (See Figure 3). The improvement since 1999 reflects increased enrollment in Medicaid and CHIP, which more than offset declines in private coverage among children.
The gains in coverage among the population as a whole in 2012 reflected in part a significant increase in the number and percentage of Americans with public health insurance — principally Medicare. More people enrolled in Medicare as the population aged. This likely contributed to the drop in the uninsured rate because some previously uninsured, near-elderly people became eligible for Medicare when they turned 65.
Much larger reductions in the share and number of people who were uninsured are expected in 2014, when health reform’s major coverage expansions take effect. The Congressional Budget Office (CBO) estimates that 25 million people who otherwise would be uninsured will eventually gain coverage due to health reform. These coverage gains will ultimately be still larger if most or all states eventually adopt health reform’s Medicaid expansion for low-income non-elderly adults, for which the federal government will pick up nearly all of the cost.
At present, however, only about half the states and the District of the Columbia plan to expand Medicaid in 2014. Many of the states that currently don’t plan to expand are in the South, the region with the nation’s highest uninsured rate according to the Census data — 18.6 percent.[2]
Food Assistance and Other Programs’ Strong Anti-Poverty Effects
The Census figures show the extent to which various federal programs, such as SNAP, enabled many families to remain above the poverty line or to meet basic needs in 2012. Although the official poverty measure does not count SNAP as income, the Census data show that if SNAP is counted, as many analysts favor (and as most of the government’s alternative poverty measures do), it lifted 4.0 million people above the poverty line last year. This is about the same number as in 2011 (3.9 million) and is up from 1.7 million in 2007.[3] (See Figure 4.) The figure includes 1.7 million children, more than 300,000 seniors, and 2.0 million adults aged 18 to 64.
Some point to SNAP’s growth since the recession hit to justify the House cuts. However, SNAP caseloads and spending are expected to fall in coming years as the economy and labor market improve. CBO projects that by 2019, SNAP spending will fall back to 1995 levels as a share of gross domestic product (GDP).[4] The new Census data suggest that large numbers of people continue to need assistance from programs like SNAP and the Earned Income Tax Credit (EITC) to meet their needs during the weak economic recovery.
Moreover, safety net programs that don’tcount in the official poverty figures have substantially eased the financial hardship caused by the recession. Earlier data show that the poverty rate rose only half as much from 2007 to 2011 after accounting for four benefits not counted under the official poverty measure — SNAP, rent subsidies, the EITC, and the refundable Child Tax Credit.[5]
Weakening of Unemployment Insurance Holds Back Progress on Poverty
To be sure, the decline in UI benefits reflects in part a positive development — declining unemployment. But it also reflects a decline in the share of unemployed workers who receive UI benefits. While the average monthly number of unemployed people fell by 1.2 million in 2012 (to 12.5 million), according to the Labor Department, the average weekly number of UI beneficiaries dropped more, by 1.7 million (to 6.1 million), leaving a growing number of jobless workers without UI. For the second year in a row, the number of workers with UI for every 100 unemployed workers fell, from 67 in 2010 to 57 in 2011 and 48 in 2012.
Indeed, while the number of jobless workers has fallen since 2010, the number of jobless workers who receive no state or federal UI benefits has risen — and is higher now than at the bottom of the recession.[6]
Comparisons of Official Poverty Figures Back to 1960s Are Not Sound
Some policymakers and other commentators have compared the official poverty rate in the 1960s to the poverty rate today and concluded that little progress has been made. That comparison yields distorted results, however, because the official poverty measure captures relatively little of the poverty relief that today’s safety net provides, especially to low-income non-elderly households.
If we adjust the poverty and income data to count the major non-cash benefits (other than health insurance programs) established or substantially expanded since the 1960s (SNAP, rent subsidies, the EITC, and more recently, the refundable Child Tax Credit), we get a fuller picture of how the lowest-income Americans’ economic circumstances have changed over the past half- century. Under this expanded measure, poverty trends since the 1960s are clearly positive, as a recent Center analysis finds:a
- Under the expanded poverty measure, the poverty rate dropped by eight percentage points between 1964 (the year the War on Poverty was declared) and 2011, from an estimated 18.9 percent to 10.9 percent. That’s twice as large as the decline in the official poverty rate over this period, which fell from 19.0 percent to 15.0 percent.
- By the expanded measure, poverty dropped from 12.0 percent in 1969, the lowest rate in the 1960s, to 9.7 percent in 2007, the last year before the recession. (Both 1969 and 2007 were peak years of the business cycle so are comparable from the standpoint of the economy.)
Moreover, the increase in poverty in the Great Recession was only half as great under the expanded poverty measure as under the official measure, reflecting the impact of non-cash benefits and tax credits. From 2007 to 2011, the poverty rate rose 1.2 percentage points under the expanded measure (to 10.9 percent) but by 2.5 percentage points under the official measure (to 15.0 percent).
This expanded measure has its own flaws for evaluating the number of Americans who are poor. It does not account for differences in the cost of living in different geographic areas or the impact of work expenses (such as child care) or out-of-pocket medical expenses on a family’s ability to afford food, clothing, and shelter. The federal government’s Supplemental Poverty Measure addresses these and other issues, but data for it are not available back to the 1960s.
a The analysis examines the effects of non-cash benefits and tax credits on poverty using available Census data since 1979 and using estimates based on budget data in earlier years. Because the refundable tax credits did not yet exist in the 1960s and the food stamp and housing assistance programs were very small, counting these programs as income makes little difference to poverty rates for years in the 1960s (no more than 0.1 percentage point in 1964 and 1969). See Sherman, “Official Poverty Measure Masks Gains Made Over Last 50 Years.”
Analysis of the new Census data shows that if UI benefits had been as effective at reducing poverty among unemployed workers and their families in 2012 as in 2010, the overall poverty rate would have fallen significantly over the past two years, rather than failing to improve.[7]
The share of unemployed workers receiving UI fell for several reasons. First, the length and depth of the protracted jobs slump has left many workers unable to find work before their UI benefits run out. Second, several states have cut the number of weeks of regular, state-funded UI benefits.
A third reason is that in 2012, Congress provided fewer weeks of federal UI benefits, which go to long-term unemployed workers. Lawmakers reduced the number of weeks of federal UI benefits provided through one UI program (Emergency Unemployment Compensation) and chose not to take steps they had taken in the past to continue access to another federal UI program.[8]
Additional Findings on Poverty and Income
A large number and percentage of workers were poor in 2012, as more poor individuals found part-time or part-year work:
- 11.0 million individuals worked some or all of the year but were poor in 2012, the highest number on record, with data going back to 1966.
- Their poverty rate (7.3 percent), although statistically unchanged from 2011, was tied for the highest level since 1993.
- In 2012, 40.3 percent of adults aged 18 to 64 who were poor worked for all or part of the year, up slightly from 39.0 percent in 2011.
In other Census findings, the poverty rate remained especially high for African Americans (27.2 percent), Latinos (25.6 percent), and children (21.8 percent). Roughly one in three African-American children (36.7 percent) and Latino children (33.8 percent) were poor in 2012.
Also, the percentage of people below half of the poverty line (below $11,746 for a family of four) remained at 6.6 percent in 2012. The percentage of children below half of the poverty line stood at 9.7 percent, statistically unchanged from the year before.
| Appendix Key Changes in Poverty, Income, and Health Insurance in 2012 | ||
| 2012 | Change from 2011 to 2012 | |
| Number of Poor People | 46.5 million | - 0.2 million |
| Poverty Rate | 15.0% | 0.0 pts |
| Poverty Rate for Children | 21.8% | - 0.1 pts |
| Real Median Household Income | $51,017 | - $83 |
| Real Median Income of Non-Elderly Households | $57,353 | + $551 |
| Real Household Income for Top 20% | $181,905 | + $166 |
| Real Household Income for Bottom 20% | $11,490 | +$16 |
| Number of Americans Without Health Insurance | 48.0 million | - 663,000 |
| Percentage of Americans Without Health Insurance | 15.4% | - 0.3 pts* |
| * Denotes statistically significant change Source: U.S. Census Bureau | ||
End Notes
[1] Saez notes that some of the surge in top incomes in 2012 could reflect tax avoidance behavior, including actions by individuals seeking to shift reported income from 2013 to 2012 to avoid higher tax rates in 2013, but he concludes that this can be only a partial explanation of the big increase in income in 2012 at the top of the income scale. Emmanuel Saez, “Striking it Richer: The Evolution of Top Incomes in the United States (Updated with 2012 preliminary estimates),” September 3, 2013, http://elsa.berkeley.edu/~saez/.
[2] For a more detailed analysis of the 2012 health insurance data, see Matt Broaddus and Edwin Park, “Share of Americans Without Health Coverage Edged Down Again in 2012,” Center on Budget and Policy Priorities, September 19, 2013, https://www.cbpp.org/cms/index.cfm?fa=view&id=4020.
[3] These figures may differ for technical reasons from poverty-reduction estimates based on the federal government’s new Supplemental Poverty Measure (SPM). Census generally prefers to use poverty-reduction estimates based on the SPM when they are available, but 2012 SPM data are not due out until later this year.
[4] Center on Budget and Policy Priorities, “Policy Basics: Introduction to the Supplemental Nutrition Assistance Program (SNAP),” updated March 28, 2013, https://www.cbpp.org/cms/index.cfm?fa=view&id=2226.
[5] Arloc Sherman, “Official Poverty Measure Masks Gains Made Over the Last 50 Years,” Center on Budget and Policy Priorities, September 13, 2013, https://www.cbpp.org/cms/index.cfm?fa=view&id=4015.
[6] Chad Stone, Jared Bernstein, Arloc Sherman, and Dottie Rosenbaum, “SNAP Enrollment Remains High Because the Job Market Remains Weak,” Center on Budget and Policy Priorities, revised July 30, 2013, https://www.cbpp.org/cms/index.cfm?fa=view&id=3996.
[7] Between 2010 and 2012, the number of unemployed people declined by 15.6 percent. This means that, if UI’s poverty effect per unemployed worker had remained what it was in 2010, the number of people kept out of poverty by UI also would have declined 15.6 percent, to 2.7 million in 2012. Instead, it declined all the way to 1.7 million. This decline in UI protection per jobless worker added 0.3 percentage points to the poverty rate in 2012. Put differently, the 2012 poverty rate would have been 14.7 percent, rather than 15.0 percent, if UI’s poverty protection per unemployed worker had remained what it was in 2010. Relative to 2010’s poverty rate of 15.1 percent, this hypothetical 14.7 percent poverty rate for 2012 would have been a statistically significant improvement.
[8] Notably, Congress failed to extend a “look-back” provision of the Extended Benefits program, which resulted in the virtual elimination over the course of 2012 of the UI benefits that this program provided. For additional background on weeks of benefits available through state and federal UI programs, see Center on Budget and Policy Priorities, “Policy Basics: How Many Weeks of Unemployment Compensation Are Available?” at https://www.cbpp.org/sites/default/files/atoms/files/PolicyBasics_UI_Weeks.pdf.
More from the Authors

Areas of Expertise

Areas of Expertise