Official Poverty Measure Masks Gains Made Over Last 50 Years
With the Census Bureau due to release updated figures about poverty in America on September 17, some policymakers and commentators surely will compare today’s poverty rate to those of 1960s and conclude that the last half-century of federal efforts to alleviate poverty have largely failed — that, as some critics put it glibly, “the government declared war on poverty, and poverty won.” But that’s simply not valid or accurate. Comparing today’s official poverty rate with those of the 1960s yields highly distorted results because the official poverty measure captures so little of the poverty relief that today’s safety net now provides.
A poverty measure that, as most analysts recommend, accounts for (rather than ignores) major non-cash benefits that the official poverty measure leaves out — namely, SNAP (the Supplemental Nutrition Assistance Program, formerly called food stamps), rent subsidies, and tax credits for working families — would find that poverty in the United States today is considerably lower than it was throughout the 1960s, despite today’s weaker economy.
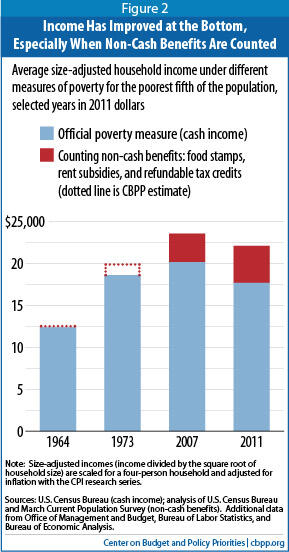
Similarly, an analysis of average incomes among the poorest one-fifth of Americans that counts non-cash benefits and tax credits also shows important progress. Average household income for the bottom fifth of Americans (counting those benefits and tax credits, adjusted for inflation and changes in household size) was more than 75 percent higher in 2011 than in 1964, the year that President Johnson announced the War on Poverty. Both earnings and government assistance contributed to the increase.
Income growth has been less dramatic among middle- and lower-income Americans since 1973 than in the years before that. But, among the bottom fifth of the population, it’s still notable. For this group, incomes grew 19 percent between 1973 and 2007 — years that are comparable because both were peaks of a business cycle. For this group, income growth slowed after the 1960s for several reasons, including widening income inequality, slower wage growth, loss of cash welfare assistance for poor families with children, and declines in marriage.
Despite these improvements, however, poverty remains high, especially for an advanced western nation.
An Apples-to-Apples Poverty Comparison
Since the 1960s, official poverty status has been calculated by comparing a family’s pre-tax cash income with a poverty line that has remained essentially unchanged in inflation-adjusted terms since it was first established. In the 1960s, this basic comparison of cash income to the poverty threshold was a reasonable proxy for whether a family could meet basic needs such as food, clothing, and shelter. Today, analysts across the political spectrum agree that this measure has become outdated, making comparisons over 50 years very misleading.
One of the most obvious flaws of the official poverty measure is that it only considers cash income and doesn’t count non-cash benefits, such as SNAP and rent subsidies, both of which help poor families far more today than they did in the 1960s. Nor does it count tax-based benefits for low-income working families, like the Earned Income Tax Credit (EITC), which did not exist until 1975, or the low-income component of the Child Tax Credit, which was essentially created in 2001. Congress and presidents of both parties have since expanded these tax credits.
At the same time, one of the main sources of means-tested income that the official poverty measure does include — cash welfare assistance for families with children — has fallen substantially since the late 1960s.[1] Thus, the official measure includes a key benefit with a diminishing anti-poverty role while failing to include tens of billions of dollars a year in non-cash benefits that were added over the same period.
If we adjust the poverty and income data to count the newer, non-cash benefits (SNAP, rent subsidies, the EITC, and the refundable Child Tax Credit) — as analysts from across the political spectrum recommend — we get a fuller picture of how the lowest-income Americans’ economic circumstances have changed since the 1960s.[2]
The Census Bureau provides the data needed for this adjustment back to 1979. For earlier years, we can approximate the adjustment using budget data.[3]
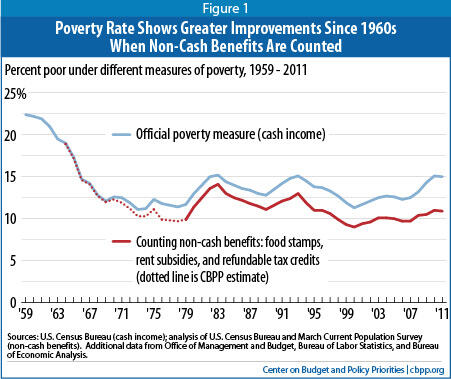
This expanded poverty measure reveals the strong anti-poverty effects of non-cash benefits. By 2011, SNAP lifted 3.9 million people above the poverty line. Rent subsidies lifted another 1.5 million out of poverty. The EITC and refundable Child Tax Credit moved an additional 7.2 million people above the poverty line. All of these benefits combined lifted 12.6 million people above the official poverty line and lowered the measured poverty rate for 2011 from 15.0 percent to 10.9 percent.
Under this expanded measure, poverty trends since the 1960s are more clearly positive than they appear to be under the official poverty rate that misses non-cash benefits and tax credits:
- The poverty rate under the expanded measure dropped 8 percentage points between 1964 and 2011, from an estimated 18.9 percent to 10.9 percent — or twice as much as the official poverty rate declined during the same period (from 19.0 percent to 15.0 percent). (See Figure 1.)
- By the expanded measure, even the poverty rate for 2011 — a year of very high unemployment — was below the estimated figure of 12.0 percent in 1969, which was the lowest rate in the 1960s. The unemployment rate in 2011 was nearly three times as high as in 1969.
- A comparison of 1969 and 2007, which are both years when the economy was at the peak of a business cycle and thus provide a good comparison of long-term trends, shows that the poverty rate declined from an estimated 12.0 percent in 1969 to 9.7 percent in 2007.
- While the official poverty rate hit its lowest point on record in 1973 at 11.1 percent, the lowest rate by this expanded measure was 9.0 percent in 2000.
During the economic downturn of 2001 and subsequent weak recovery of the 2000s, poverty trended up slightly by both measures. The expanded measure reached 9.7 in 2007, the year before the Great Recession, reflecting in large part that decade’s unequally shared economic growth.
The Great Recession drove poverty higher, but only by half as much under the expanded measure as under the official measure, reflecting the strong role of non-cash benefits and tax credits in preventing a much larger surge in hardship. In 2011, as the economic recovery struggled to take hold, poverty was up 1.2 percentage points from 2007 under the expanded poverty measure (to 10.9 percent), compared with an increase of 2.5 percentage points under the official measure (to 15.0 percent).
The Supplemental Poverty Measure: A More Modern Approach
Work and family structure have changed fundamentally over the past five decades, and notions of what is a “basic need” have evolved. The official poverty measure was not designed to keep pace with such changes. It was designed in part using spending data from the 1950s, when, for example, many people lacked telephone service; today, having a telephone (or a computer and Internet service) is often a requirement for obtaining a job. The official poverty measure was also created before the rise of dual-earner and single-parent families made paid child care such a common necessity for employment and before the growing number of unmarried couples (many, although not all, of whom share resources and expenses) raised questions about the appropriate family unit for a poverty measure.
Such changes illustrate why any poverty comparison over long periods, such as a half century, is likely to be imperfect: too much has changed.
As a result, while simply adjusting the official poverty measure to count non-cash benefits and tax credits, as we have done above, provides a much more consistent comparison over time than does the official poverty measure, it is not an ideal way to measure poverty.
The federal government’s new Supplemental Poverty Measure (SPM) goes a long way toward addressing these issues. It includes non-cash benefits and tax credits when measuring family resources, including some benefits not included in our expanded measure such as school lunch subsidies and the Special Supplemental Nutrition Program for Women, Infants, and Children (WIC). In addition, it subtracts out income and payroll taxes paid, necessary work expenses, out-of-pocket medical expenses, and child support payments — expenses that reduce the disposable income available to buy food, clothing, shelter and utilities.
The SPM also grapples with the fundamental changes in work and family structure and evolving notions of what is a “basic need.” It adopts a modestly updated poverty threshold based on a minimum of what most American families currently spend on core necessities (food, clothing, shelter, and utilities). The SPM’s definition of income reflects resources available to purchase those necessities (subtracting, for example, income spend for necessary child care, because they aren’t available for basic needs). A family whose net resources are less than those needs is considered poor. The SPM also goes beyond the traditional Census family unit (persons related by birth, marriage, or adoption) by treating unmarried couples living together as a combined family unit, implicitly assuming that the couple shares resources and financial responsibility for any children.
The SPM thus provides a more modern and comprehensive way to measure poverty, one that we, like many analysts, generally prefer. Unfortunately, the SPM is not available back to the 1960s and 1970s. Its most recent data showed that, in 2011, overall government cash and non-cash means-tested and social insurance programs and tax credits cut poverty nearly in half, lifting 40 million Americans who would otherwise be poor above the poverty line.[4] Government programs lowered the SPM poverty rate in 2011 from 29.0 percent before counting benefits and taxes to 16.1 percent after countingbenefits and taxes.[5]
Despite this reduction in poverty, the poverty rate is higher under the SPM than under the simpler adjusted measures we cite above because the SPM, as noted, subtracts taxes, work expenses, and out-of-pocket health care costs from income and uses a more up-to-date poverty line.
Taken together, the SPM data and our simpler apples-to-apples poverty comparison suggest that poverty is less widespread and severe than it was in the 1960s, but is still quite substantial. Poverty remains higher here than in most other western industrial nations.
Image
 Income Trends of the Poorest Fifth of Americans
A poverty rate measures the share of the population below a certain income threshold. Another way to gauge progress is to measure the change over time in the average incomes of those at the bottom of the income distribution. We examine household incomes, again including SNAP, housing assistance, and refundable tax credits, and using budget data to help estimate non-cash benefits in the years prior to those available in the Census data.[6] Average family size shrunk during the last half-century so we adjust our figures for household size.[7] We adjust income trends for inflation using a recently revised price index.[8]
Measured this way, income among the bottom fifth of American households is more than 75 percent greater than in 1964 (after adjusting for inflation), though it’s grown only about 11 percent since 1973. Both earnings and government assistance contributed to the income growth between 1964 and 2011. The bottom fifth of households represents a broader group than poor families, including some people whose incomes are low but modestly above the poverty line.
Since 1973, income growth for the bottom fifth has been less dramatic but still notable — 19 percent between 1973 and 2007, years that are particularly comparable because both were peaks of a business cycle. Income growth slowed after the 1960s for several reasons, including widening income inequality, loss of cash welfare assistance for poor families with children, and declines in marriage. Income of the bottom fifth of households fell during the Great Recession, though increased non-cash benefits buffered the loss. (See Figure 2.) (Unemployment benefits, which are included as cash income, also helped buffer the loss.)
Food Stamps:
Responsible for Dramatic Improvements in Child Nutrition and Other Positive Effects
In the mid and late 1960s, before the food stamp (SNAP) program was consistently available to poor households throughout the nation, two teams of medical researchers conducted field investigations of poor individuals’ nutritional status and found rates of childhood malnutrition and related diseases in some poor areas of our country akin to those in some third-world countries. One physician said, “In child after child we saw evidence of vitamin and mineral deficiencies…in boys and girls in every county we visited, obvious evidence of severe malnutrition, with injury to the body’s tissues — its muscles, bones, and skin as well as an associated psychological state of fatigue, listlessness, and exhaustion.”a
The findings spurred a bipartisan consensus led by President Nixon to establish national eligibility and benefit standards for food stamps. In the late 1970s, after the national standards had taken effect, medical teams returned to many of the same poor areas they had studied in the late 1960s and found dramatic improvement among poor families and especially among poor children. While poverty remained, severe child malnutrition and related health conditions had become rare. The researchers wrote, “In the Mississippi delta, in the coal fields of Appalachia and in coastal South Carolina — where visitors ten years ago could quickly see large numbers of stunted, apathetic children with swollen stomachs and the dull eyes and poorly healing wounds characteristic of malnutrition — such children are not to be seen in such numbers. Even in areas which did not command national attention ten years ago, many poor people now have food.…”b
The researchers credited food stamps as the single largest factor for this striking progress, concluding that “no program does more to lengthen and strengthen the lives of our people than the Food Stamp program.” While many people still struggled to afford food and some suffered from under-nourishment, the researchers noted, severe, obvious malnutrition was no longer easy to find.
Decades later, another team of researchers traced the program’s long-term effects on children. They traced the effect of being born with early access to food stamps, as the program expanded in stages across the country, finding that “access to food stamps in utero and in early childhood leads to significant reductions in metabolic syndrome conditions (obesity, high blood pressure, heart disease, and diabetes) in adulthood,” as well as greater likelihood of finishing high school, and, for women, increases in “economic self-sufficiency” as indicated by a combination of more education, earnings, and income and less welfare participation.
a U.S. Senate, Committee on Labor and Public Welfare, No. 467, to accompany S. 2138, Authorizing the Secretary of Health, Education, and Welfare, and the Secretary of Agriculture to Provide Food and Medical Services on an Emergency Basis to Prevent Human Suffering or Loss of Life, August 1967.
b “Hunger in America: The Federal Response,” Field Foundation, 1979.
c Hilary W. Hoynes, Diane Whitmore Schanzenbach, Douglas Almond, “Long Run Impacts of Childhood Access to the Safety Net,” National Bureau of Economic Research Working Paper No. 18535, November 2012, http://www.nber.org/papers/w18535.
Widening Inequality Dampens the Success of Anti-Poverty Efforts
Incomes and the poverty rate improved in the last 50 years for several reasons. The share of the population that finished high school and went to (and finished) college rose; more women participated in the labor force; the average size of families fell as parents had fewer children; some racial gaps narrowed; and some families, especially working-poor families and families modestly above the poverty line,[9] received more government support, especially non-cash benefits and tax credits.
At the same time, other forces pushed downward on incomes and upward on poverty. These included the decline in wages of less-educated men, increased incarceration, a larger number of single-parent families, and, in recent decades, a weakened safety net for many without jobs.
For these and various other reasons, income inequality widened after the early 1970s, and economic growth was shared much less evenly. Beginning in the 1970s, income growth for households in the middle and lower parts of the distribution slowed sharply, while incomes at the top continued to grow robustly. By 2007, the concentration of income at the very top of the distribution had reached levels last seen more than 80 years ago, while hourly wages for production and non-supervisory workers stagnated, growing less than 1 percent after inflation between 1973 and 2007.[10] The share of jobs paying below-poverty wages — hourly wages so low that a full-time, year-round worker cannot keep a four-person family above the official poverty line — was more than one in four (26 percent) in 2007, little better than it was in 1973 (30 percent).[11]
Safety net programs — although effective over the past 50 years — continue to face the strong headwind of persistently low wages for many workers and rising inequality. Although we have made significant progress in fighting poverty over the last 50 years, it has not been enough. There is more work to do.
| Appendix Number of People Lifted Above Poverty Line When the Following Benefits Are Counted As Income, Relative to Official Poverty Measure | |||||
| Year | SNAP | Rent Subsidies | EITC | Other Tax Credits | All Combined |
| 1979 | 1,977 | 782 | 818 | 0 | 3,857 |
| 1980 | 1,848 | 875 | 681 | 0 | 3,694 |
| 1982 | 1,447 | 891 | 488 | 0 | 3,311 |
| 1983 | 1,276 | 909 | 402 | 0 | 2,922 |
| 1984 | 1,266 | 1,085 | 444 | 0 | 3,279 |
| 1985 | 1,169 | 1,192 | 445 | 0 | 3,429 |
| 1986 | 1,030 | 1,233 | 413 | 0 | 3,153 |
| 1987 | 1,395 | 1,289 | 829 | 0 | 3,840 |
| 1988 | 1,030 | 1,215 | 1,007 | 0 | 3,804 |
| 1989 | 1,317 | 1,038 | 1,216 | 0 | 4,129 |
| 1990 | 1,395 | 1,435 | 1,213 | 0 | 4,677 |
| 1991 | 1,754 | 1,419 | 1,687 | 0 | 5,425 |
| 1992 | 1,874 | 1,158 | 1,746 | 0 | 5,336 |
| 1993 | 2,030 | 1,249 | 1,608 | 0 | 5,493 |
| 1994 | 2,174 | 1,247 | 2,763 | 0 | 6,808 |
| 1995 | 2,106 | 1,245 | 3,542 | 0 | 7,403 |
| 1996 | 1,754 | 1,169 | 3,834 | 0 | 7,347 |
| 1997 | 1,576 | 1,241 | 3,890 | 0 | 7,153 |
| 1998 | 1,484 | 1,317 | 4,449 | 0 | 7,642 |
| 1999 | 1,311 | 1,162 | 3,778 | 0 | 6,845 |
| 2000 | 924 | 1,190 | 3,570 | 0 | 6,342 |
| 2001 | 1,152 | 1,275 | 3,627 | 58 | 6,412 |
| 2002 | 1,145 | 1,199 | 4,034 | 5 | 7,044 |
| 2003 | 1,365 | 1,263 | 3,799 | 15 | 6,832 |
| 2004 | 1,733 | 1,107 | 3,716 | 1,097 | 7,708 |
| 2005 | 1,698 | 1,202 | 4,006 | 929 | 7,733 |
| 2006 | 1,759 | 1,101 | 4,139 | 1,145 | 7,815 |
| 2007 | 1,686 | 1,105 | 4,335 | 1,096 | 8,301 |
| 2008 | 2,202 | 1,130 | 3,934 | 996 | 8,565 |
| 2009 | 3,574 | 1,242 | 5,326 | 2,950 | 12,274 |
| 2010 | 3,863 | 1,226 | 5,443 | 3,073 | 12,622 |
| 2011 | 3,881 | 1,203 | 5,687 | 2,324 | 12,563 |
| Notes: “Other tax credits” are the low-income (refundable) portions of the Child Tax Credit, which effectively began in 2001, and, for 2009 and 2010, the temporary Making Work Pay tax credit. Figures for individual benefits may not sum to total because program effects interact. The rent subsidies estimate for 1979 shown above, 782,000, differs slightly from the housing effect described in footnote 3 because the latter accounts for these interacting program effects. Source: CBPP analysis of the March Current Population Survey. | |||||
End Notes
[1] Most states’ cash welfare programs for non-elderly, non-disabled childless adults, which were generally small, were also cut steeply or eliminated.
[2] We also include the refundable share of the temporary Making Work Pay Tax Credit in 2009 and 2010, the years for which that credit was in effect.
[3] Specifically, for 1979, the first year with non-cash data from Census, we calculate the effect on the poverty rate of counting food stamps, housing assistance, and the EITC, respectively. For each earlier year, we multiply each of these effects by the change in the inflation-adjusted per-capita benefit spending for each program based on budget data. For example, we calculate that including food stamps as income would lower the official poverty rate by 1 percentage point in 1979, and that food stamp spending per member of the U.S. population was about one-hundredth as large in 1964 as it was in 1979, after inflation. So this analysis assumes that counting food stamps in 1964 would have been lowered the poverty rate in 1964 by about one one-hundredth of 1 percentage point. Rent subsidies reduced the poverty rate by 0.3 percentage points in 1979, and federal spending on these programs was about 11 percent as large in 1964 as in 1979 in inflation-adjusted per-capita terms; so the analysis assumes housing assistance reduced the poverty rate in 1964 by 11 percent of 0.3 percent, or 0.033 percentage points. Refundable tax credits did not exist in 1964, so they are assumed to have had no effect.
[4] CBPP analysis of the Census Bureau’s 2012 Current Population Survey and SPM public use files. These figures count the following programs: Social Security, unemployment insurance, workers compensation, Temporary Assistance for Needy Families, Supplemental Security Income, SNAP, housing assistance, energy assistance, WIC, the EITC, the Child Tax Credit, free and reduced-price school lunch, Pell Grants, and veterans’ benefits. The poverty reduction estimates are net of the effect of federal and state income and payroll taxes, which reduce disposable income.
Because the SPM is more comprehensive, it yields different estimates of programs’ effects on poverty than those shown earlier in this analysis. For example, using the SPM, SNAP benefits kept 4.7 million people above the poverty line in 2011 and the EITC and Child Tax Credit kept 9.4 million people out of poverty
[5] Arloc Sherman, Danilo Trisi, and Sharon Parrott, “Various Supports for Low-Income Families Reduce Poverty and Have Long-Term Positive Effects On Families and Children,” Center on Budget and Policy Priorities, July 30, 2013, https://www.cbpp.org/sites/default/files/atoms/files/7-30-13pov.pdf.
[6] Non-cash benefits are estimated as follows. In 1979, the earliest year for which non-cash and tax estimates are available in the Census data, counting food stamps as income added an average of $1,072 to size-adjusted household income for the bottom fifth of Americans; to approximate their effect on income in 1964, we multiply this figure by 1.1 percent, which is the ratio of total SNAP benefit payments in 1964 to such payments in 1979 on an inflation-adjusted per-capita basis according to budget and population data from the Bureau of Economic Analysis, with a result of $12 in 1964 (in 2012 CPI-U-RS dollars). Similarly, housing assistance added $1,076 to income in 1979; we multiply this by 11.8 percent, which was the ratio of housing benefits in 1964 to such benefits in 1979 on a per-capita inflation-adjusted basis, which adds $126. The two major tax credits (the EITC and Child Tax Credit) did not exist in 1964. So in total we estimate that major non-cash benefits added $12 plus $126, or $138, to average incomes of the bottom fifth in 1964.
[7] Like the Congressional Budget Office, we adjust household incomes for household size by dividing by the square root of the number of people in the household. The incomes presented here are equivalent to those for a four-person household.
[8] Like the Census Bureau, we adjust income figures for inflation using the Bureau of Labor Statistics Consumer Price Index for All Urban Consumers Research Series (CPI-U-RS), which approximates what inflation would have been in each year since 1977 if measured consistently using current inflation-adjustment methods. Because this series does not exist before 1977, we use annual rates of inflation from an earlier BLS research series (the CPI-U-X1) for 1967-1977 and from the standard CPI-U for earlier years.
[9] For additional discussion of who gained and lost from changes in the safety net since 1984, see Yonatan Ben-Shalom, Robert A. Moffitt, and John Karl Scholz, “An Assessment of the Effectiveness of Anti-Poverty Programs in the United States,” Prepared for the 2012 Oxford Handbook of the Economics of Poverty, Chapter 22. A version of this study is available at: http://www.irp.wisc.edu/publications/dps/pdfs/dp139211.pdf.
[10] Hourly wages are from the Bureau of Labor Statistics and are adjusted by the same inflator described in footnote 8 above.
[11] Economic Policy Institute, State of Working America 12th Edition, chart data for Figure 4E, “Share of workers earning poverty-level wages, by gender, 1973–2011,” http://stateofworkingamerica.org.
More from the Authors
