Share of Americans Without Health Coverage Edged Down Again in 2012
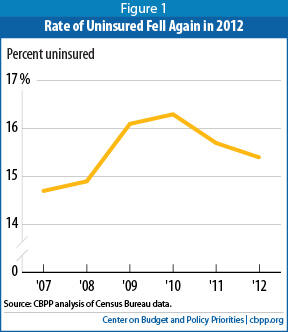
The Census Bureau announced Tuesday that the percentage of Americans without health insurance coverage declined in 2012 for the second consecutive year. (See Figure 1.) The number of uninsured Americans remained unchanged in 2012.
The Census data indicate that coverage gains among children, expanded private coverage among the non-elderly, and increased enrollment in Medicare as the population ages were the primary contributors to this reduction. Health reform will make greater progress in reducing the ranks of the uninsured in coming years as its major coverage expansion provisions take effect.
The share of children who were uninsured fell from 9.4 percent in 2011 to 8.9 percent in 2012 — a historic low — due primarily to gains in private coverage. Enrollment in Medicaid and the Children’s Health Insurance Program (CHIP) among children remained steady, likely in part because of a health reform requirement that states maintain their eligibility rules and procedures for Medicaid and CHIP. The 8.9 percent uninsurance rate among children is more than a quarter below the 1999 level, which is the first year for which comparable Census data were collected.
In addition, the share of non-elderly people with private coverage rose between 2011 and 2012. The first such increase since 2000, this likely reflects the improving economy, with more people working full time and thus more likely to have access to job-based coverage.
Much larger reductions in the share and number of uninsured Americans are expected in 2014, when health reform’s major coverage expansions take effect. The Congressional Budget Office (CBO) estimates that 25 million people who otherwise would be uninsured will eventually gain coverage as a result of health reform. (The coverage gains will ultimately be larger than that if most or all states eventually adopt health reform’s Medicaid expansion for low-income non-elderly adults, for which the federal government will pick up nearly all of the cost.)
Health reform opponents may seek to delay or repeal key elements of the Affordable Care Act as part of legislation to avert a government shutdown or a default on the nation’s debt. Such actions would undermine the expected progress in reducing the ranks of the uninsured. For example, CBO reported recently that a one-year delay in the requirement that individuals have health insurance or pay a penalty starting in 2014 would result in 11 million Americans who would otherwise have coverage remaining uninsured in 2014, as well as cause health insurance premiums in the individual health insurance market to be higher than they will otherwise be.
The new Census figures show:
- The share of Americans without health insurance fell from 15.7 percent in 2011 to 15.4 percent in 2012. The number of uninsured Americans remained unchanged at 48 million in 2012.[1]
- The share of all Americans with Medicaid or CHIP coverage held steady at 16.4 percent in 2012.
- The share of people with private coverage remained stable at 63.9 percent for the third straight year, following ten consecutive years of declines. Among the non-elderly, however, the share with private coverage increased, from 64.8 percent in 2011 to 65.2 percent in 2012.
- The share of the near-elderly (aged 55 to 64) without health insurance coverage declined from 14.6 percent in 2011 to 14.0 percent in 2012, driven by gains in both private individual market coverage and in Medicaid.
- The share of the population enrolled in Medicare increased in 2012 as the baby boomers continued to age, pushing up the share of the population aged 65 and over. There were nearly 240,000 fewer uninsured Americans than if the age distribution of the population had stayed the same.
- Insurance coverage among Hispanics improved, as the share lacking coverage fell from 30.1 percent in 2011 to 29.1 percent in 2012. Asians experienced notable coverage gains as well, with the percentage without coverage declining from 16.8 percent in 2011 to 15.1 percent in 2012.
Uninsured Rate Falls Again But Remains Above Pre-Recession Level
Coverage levels, however, still remain below the levels before the recession. Some 3.9 million more Americans were uninsured in 2012 than in 2007, and the percentage of people who are uninsured was 0.7 percentage points higher.
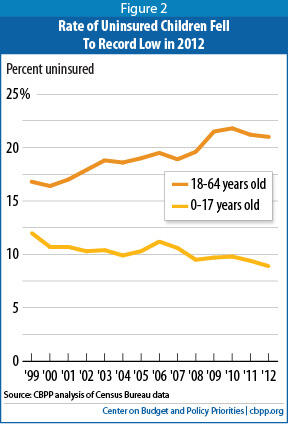
Share of Children Without Health Coverage Falls to Historic Low
Children’s coverage improved in 2012, with the share of children who lack insurance dropping to a historic low of 8.9 percent. (See Figure 2.) This was due to increased private coverage among children, which rose from 59.4 percent in 2011 to 60.1 percent in 2012, while the share of children enrolled in Medicaid and CHIP remained unchanged at 35.9 percent. Health reform helped Medicaid and CHIP hold steady by requiring states to maintain their Medicaid and CHIP eligibility levels and not make it more difficult to enroll (for children, through the end of fiscal year 2019; for adults, until 2014).
The percentage of children who are uninsured has fallen by one-fourth since 1999 due to the extension of Medicaid and CHIP to more children, despite erosion in private insurance coverage over this period.[2]
Private Coverage Increased Among the Non-Elderly
For the first time since 2000, the share of those under 65 with private health insurance coverage increased, from 64.8 percent in 2011 to 65.2 percent in 2012. Prior to this modest improvement, private insurance coverage among the non-elderly had declined in nine of 11 years since reaching a high of 75.0 percent in 2000. Some of this coverage gain is explained by the fact that the share of those aged 18 to 64 who were working increased 0.7 percentage points in 2012, equivalent to more than 1.6 million additional workers. Most of the employment growth was among full-time workers, who are most likely to have access to health coverage offered through their employers.
Notably, the share of the non-elderly with employer-based coverage remained steady at 58.4 percent, despite recent claims that health reform is encouraging employers in significant numbers to drop coverage for their workers.
Public Program Coverage, Primarily Medicare, Grew as Population Aged
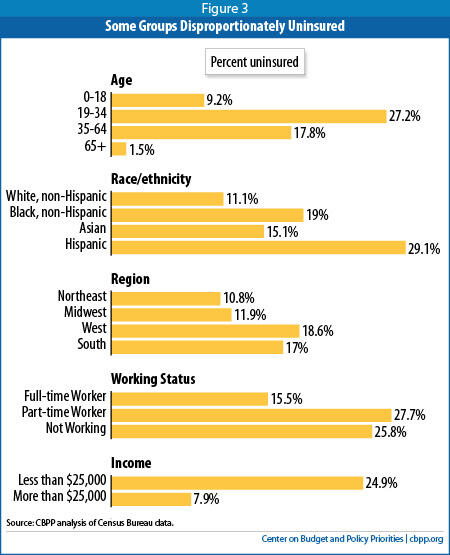
Certain Groups Remain Disproportionately Uninsured
Certain groups of Americans continue to be uninsured at particularly high rates, the Census data show (see Figure 3):
- 26- to 34-year-olds. 27.2 percent were uninsured in 2012. Implementation of the ACA’s young adult provision, which took effect in September 2010 and allows adult children to remain on their parents’ private health insurance plans until age 26, has reduced the share of adults aged 19 to 25 without health coverage by 4.2 percentage points since 2009 (when 31.4 percent of young adults were uninsured). In contrast, the share of 26- to 34-year-olds without coverage has remained flat and now equals that of 19- to 25-year-olds.
- Hispanics. In 2012, 29.1 percent of Hispanics were uninsured, compared to 19.0 percent of African Americans, 11.1 percent of whites, and 14.7 percent of Asian Americans. This is despite Hispanics experiencing substantial coverage gains in 2012.
- Residents of the South and West. 18.6 percent of those living in the South and 17.0 percent of those living in the West were uninsured in 2012, well above the comparable figures for the Northeast (10.8 percent) and Midwest (11.9 percent). The share of uninsured in the West, however, did show improvement, declining by 1 percentage point between 2011 and 2012. The uninsured rate in the South remained unchanged.
- Unemployed or underemployed. 25.8 percent of those who were unemployed for at least one week during 2012, and 27.7 percent of those who worked less than full time, were uninsured, compared to 15.5 percent of those who had a full-time job throughout the year.
- Those in low-income households. The uninsured rate among people in households with incomes below $25,000 stood at 24.9 percent, more than three times the rate among people in households with income of $75,000 or more (7.9 percent).
Health Reform’s Medicaid Expansion Will Reduce Number of Uninsured
Under health reform, states can expand Medicaid coverage starting in 2014 to nearly all individuals up to 133 percent of the poverty line and thus make substantial progress in covering many uninsured low-income adults.
At present, only about half of the states and the District of the Columbia plan to expand Medicaid in 2014, even though the federal government will pick up nearly all the cost. Many of the states that do not plan to expand at this time are in the South, which as noted is the region with the nation’s highest uninsured rate, according to the Census data. These include some of the states with the highest uninsured rates in the nation, like Texas, where 26.7 percent of the non-elderly population was uninsured in 2012; Louisiana, where the uninsured rate was 22.4 percent among the non-elderly; and Florida, where the uninsured rate stood at 24.6 percent.[5] Nationally, 17.8 percent of non-elderly people were uninsured in 2012.
CBO has estimated if all states instituted the Medicaid expansion, 17 million low-income people would eventually gain Medicaid coverage, the overwhelming majority of whom would otherwise be uninsured. If many states continue to turn down the expansion, however, health reform will make less progress in covering low-income people — especially working-poor parents and other low-income working adults — who are now uninsured.
Delaying or Repealing Health Reform Would Undermine Expected Progress in Reducing Ranks of Uninsured
CBO expects that health reform will eventually reduce the number of people who would otherwise be uninsured by 25 million, and reduce the share of non-elderly individuals without health insurance by 9 percentage points. Repealing, defunding, or delaying the ACA or its key coverage provisions, as some policymakers are demanding, would sharply cut back or entirely eliminate these expected large coverage gains.
For example, CBO reported recently that a proposal to delay for one year the ACA’s requirement for individuals to have coverage or pay a penalty, which House leaders may try to attach to legislation to prevent a default on the nation’s debt, would raise the number of uninsured Americans by about 11 million in 2014 relative to current law. That would reduce health reform’s expected coverage gains by nearly 85 percent in that year. Delaying the individual mandate would also raise premiums for health insurance in the individual market in 2014 and could severely disrupt the new health insurance exchanges just as the open enrollment season is about to begin.[6]
Conclusion
The percentage of Americans without health insurance coverage declined in 2012 for the second consecutive year, primarily as a result of coverage gains among children, greater private coverage for the non-elderly, and increased Medicare enrollment as the population aged.
Much larger reductions in the share and number of uninsured are expected in 2014, when health reform’s major coverage expansions take effect. CBO estimates that 25 million people who otherwise would be uninsured will eventually gain coverage as a result of health reform. And this progress will be substantially greater if all states adopt the Medicaid expansion for low-income adults. Policymakers should reject any effort to delay, defund or repeal health reform, which would eliminate or sharply reduce the progress that will otherwise be made in coming years in significantly shrinking the ranks of the uninsured.
End Notes
[1] Unless otherwise indicated, all figures in this report are taken from the main Census Bureau report issued on September 17, 2013 or the series of tables the Census Bureau released along with the report. Carmen DeNavas-Walt et al., “Income, Poverty and Health Insurance Coverage in the United States: 2012,” U.S. Census Bureau, September 17, 2013, http://www.census.gov/prod/2013pubs/p60-245.pdf.
[2] The Census Bureau began collecting health insurance coverage data in 1987. Since then, it has made several changes to the way it collects data, the questions it asks, and the sample design of the Current Population Survey. Thus, a comparable series of data is available only back to 1999. The decline in the uninsured rate among children would be even greater (though the magnitude cannot be known) were we able to compare the 2012 estimates to data for 1997, the year before CHIP implementation began.
[3] The baby boom generation is generally thought of as people born between 1946 and 1964.
[4] Based on Center on Budget and Policy Priorities analysis using the 2012 Current Population Survey data.
[5] All state-level estimates and comparisons of state-level estimates to national estimates reflect two-year averages of the 2011 and 2012 data so as to achieve adequate state sample sizes.
[6] Edwin Park, “Delaying the Individual Mandate Would Result in Millions More Uninsured and Higher Premiums,” Center on Budget and Policy Priorities, September 12, 2013. https://www.cbpp.org/cms/index.cfm?fa=view&id=4012.
More from the Authors
Areas of Expertise