BEYOND THE NUMBERS
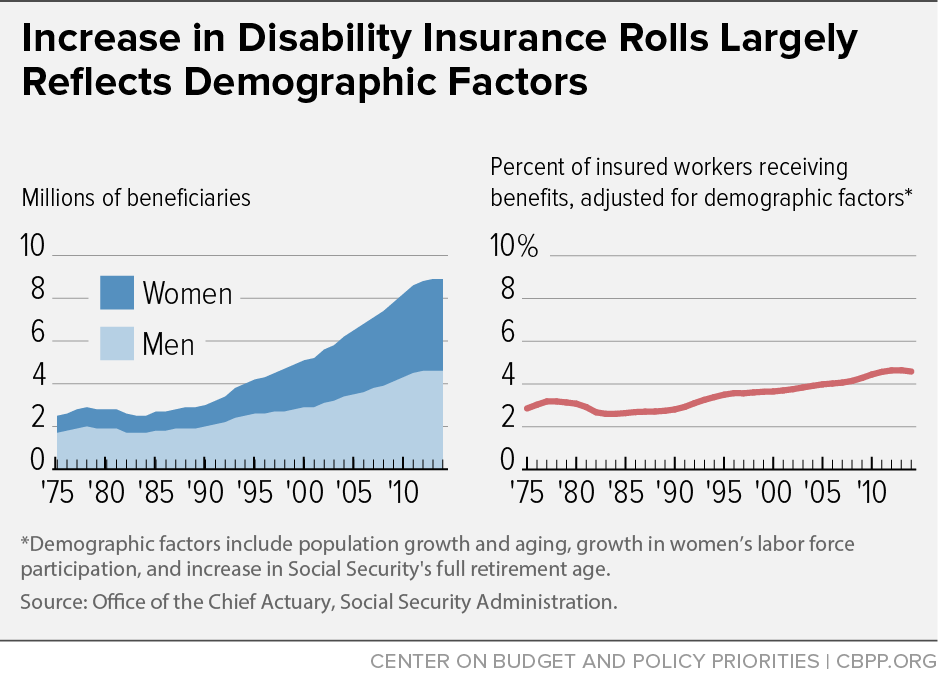
As policymakers consider how to replenish the fund that pays for Social Security Disability Insurance (DI), they should understand why the rolls have grown. Nearly 9 million disabled workers received DI at the end of 2014, roughly three times the 1980 figure of 2.9 million. Five demographic factors explain fully two-thirds of that growth.
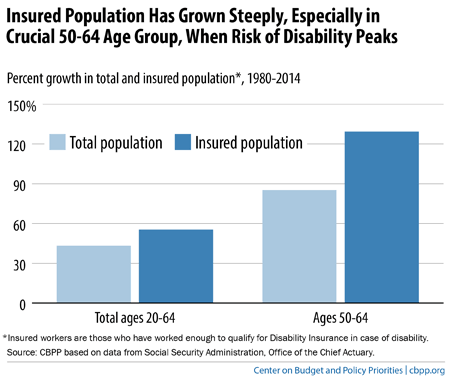
- Population growth. The working-age population (conventionally defined as people aged 20 through 64) rose by nearly 45 percent since 1980. That increase alone would have generated an extra 1.25 million DI beneficiaries in 2014, compared with 1980.
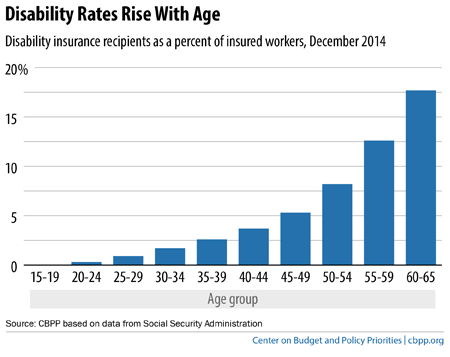
- Population aging. The risk of disability rises steeply with age; people are twice as likely to receive DI at age 50 than at age 40, and twice as likely at age 60 than at age 50. The baby-boom generation — the large cohort born between 1946 and 1964 — aged into those high-risk years over the past few decades. That added another 940,000 DI beneficiaries in 2014, compared with 1980.
- Rise in Social Security’s retirement age. When disabled workers reach Social Security’s full retirement age, they begin receiving Social Security retirement benefits rather than DI. The rise in the full retirement age from 65 to 66 in the early 2000s delayed the conversion of disabled workers to retired workers. In December 2014, nearly 470,000 people between ages 65 and 66 collected DI benefits; under the former rules, they would’ve received retirement benefits instead.
- Growth in women’s labor force participation. Besides having a severe impairment, DI applicants must have a steady work history — and until women joined the work force in huge numbers, relatively few of them qualified. The rise in women’s labor force participation explains why the number of insured workers grew much faster than the overall population, especially among older workers. It’s responsible for another 900,000 beneficiaries in 2014, compared with 1980.
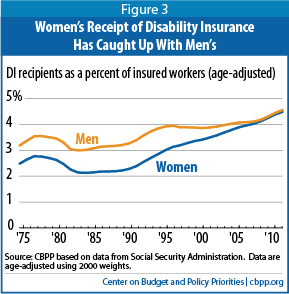
- Increase in women’s rate of receipt. Until the mid-1990s, even women who had worked enough to qualify for DI in the event of disability were only about three-fourths as likely as their male counterparts to receive DI benefits. Now they’re equally likely to do so. This development — sometimes dubbed “women’s catchup” — is probably related to women’s growing importance as breadwinners rather than secondary earners, and it added another 660,000 beneficiaries in 2014, compared with 1980.
(For more about these factors — and why some scholars, including economists David Autor and Mark Duggan and researchers at the Federal Reserve Bank of San Francisco, report a smaller demographic contribution — see our earlier paper here.)
In sum, these five demographic factors alone would have generated over 4.1 million more DI beneficiaries in 2014 — causing their number to rise from 1980’s 2.9 million to 7 million. That leaves fewer than 2 million beneficiaries tied to other factors.
The Social Security actuaries express the number of people receiving DI using a rate that adjusts for four of these five factors (though not for “women’s catchup”). Over the 1980-2014 period, that rate rose from 3.1 percent of the working-age population to 4.6 percent. That’s certainly a significant increase, but not nearly as dramatic as some have painted (see graph).
We’ll be back soon with many of the reasons for the rest of DI’s growth.
