Testimony of Michael Mitchell, Policy Analyst, Before the Senate Committee on Health, Education, Labor and Pensions
Thank you for the invitation to testify today. I am pleased to be able to speak to you about college affordability, state support for higher education, and how rising costs have affected students across the country. I am Michael Mitchell, Policy Analyst at the Center on Budget and Policy Priorities. We are a Washington, D.C.-based policy institute that conducts research and analysis on budget, tax, and economic policy, policies related to poverty, and a number of social programs at both the federal and state levels. The Center has no government contracts and accepts no government funds.
My testimony today will focus on four key points: 1) States have made dramatic cuts to higher education funding since the onset of the Great Recession; 2) we’ve seen rapid growth in tuition costs at public four-year institutions over the same time period; 3) higher costs have hurt students and families, especially those with low or moderate incomes and students of color; and 4) while states reduced higher education funding, the federal Pell Grant program continued to provide important support to low-income students. I conclude with recommendations for federal and state policymakers that would enable more students, particularly low-income students, to access and graduate from college.
I. States Have Made Dramatic Cuts to Higher Education Since 2008
State and local tax revenue is a major source of funding for public colleges and universities. Unlike private institutions, which may rely upon gifts and large endowments to help fund instruction, public two- and four-year colleges typically rely heavily on state and local appropriations. In 2014, state and local dollars constituted 53 percent of public institutions’ education revenue — the funds used directly for teaching and instruction.[1]
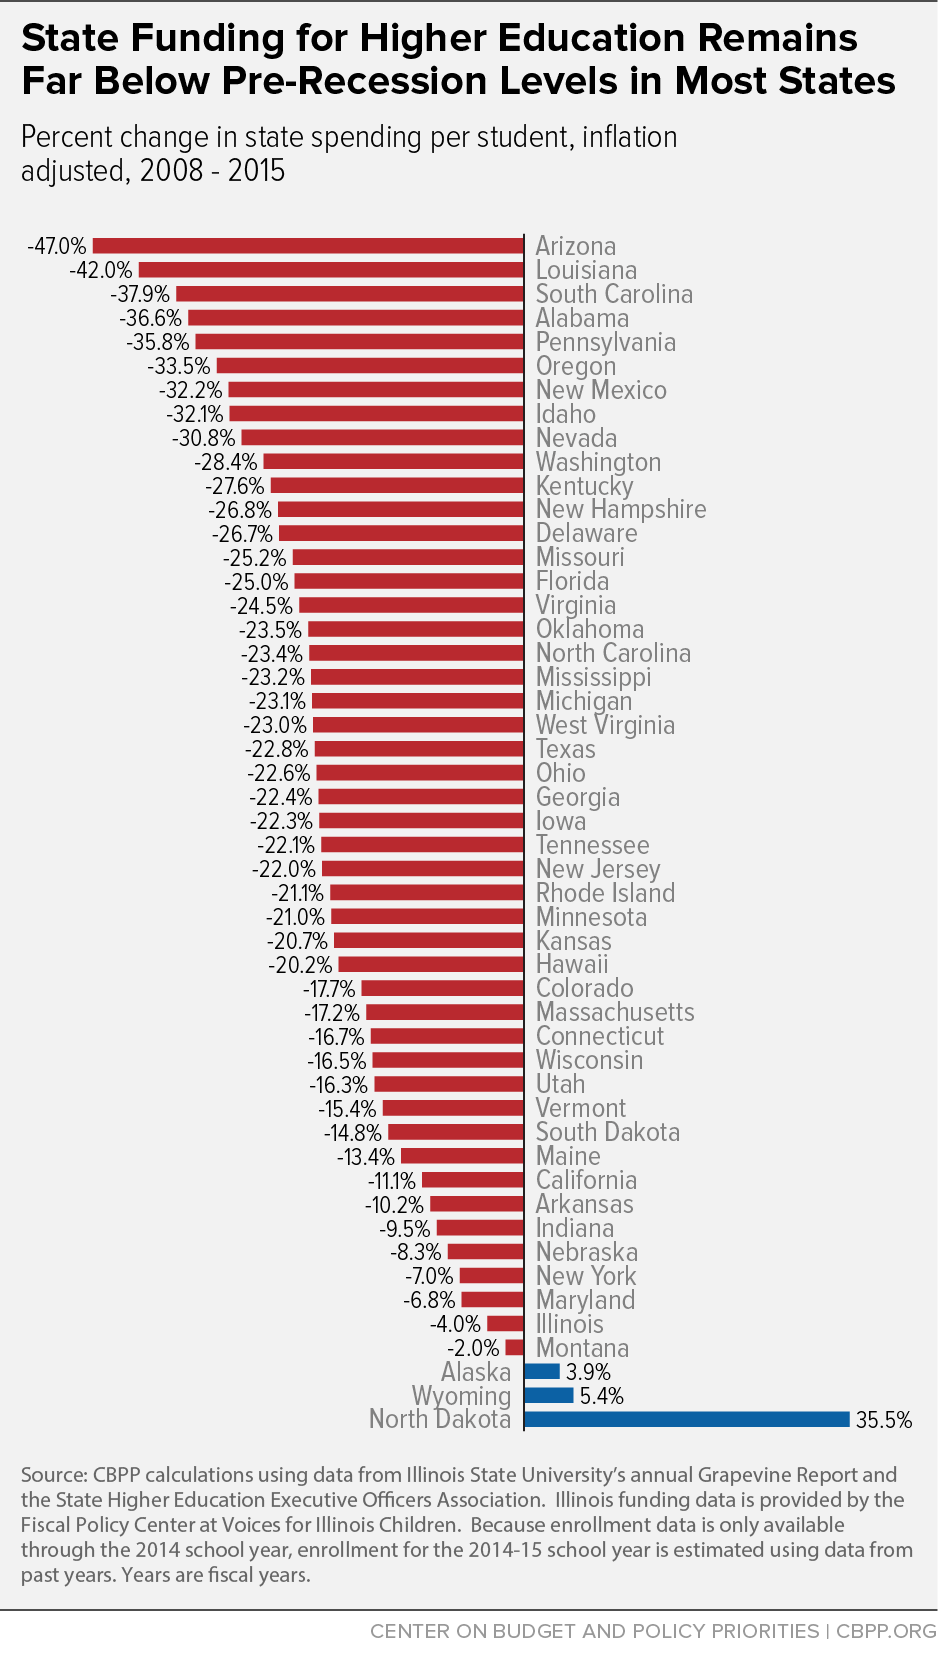
While states have begun to restore funding, appropriations are well below what they were in 2008 — 20 percent per student lower — even as state revenues have returned to pre-recession levels. Compared with the 2007-08 school year, when the recession hit, adjusted for inflation:
- State spending on higher education nationwide is down an average of $1,805, or 20.3 percent, per student.
- Every state except Alaska, North Dakota, and Wyoming has cut per-student funding.
- 31 states have cut per-student funding by more than 20 percent.
- Six states have cut per-student funding by more than one-third.
- Per-student funding in Arizona and Louisiana is down by more than 40 percent.[2] (See Figure 1.)
Over the past year, states have moved to restore some of that lost funding. (See Figure 2.) Thirty-seven states are investing more per student in the 2014-15 school year than they did in 2013-14. Adjusted for inflation:
- Nationally, spending is up an average of $268, or 4 percent, per student.
- The funding increases vary from $16 per student in Louisiana to $1,090 in Connecticut.
- 18 states increased per-student funding by more than 5 percent.
- Four states ― California, Colorado, New Hampshire, and Utah — increased funding by more than 10 percent.
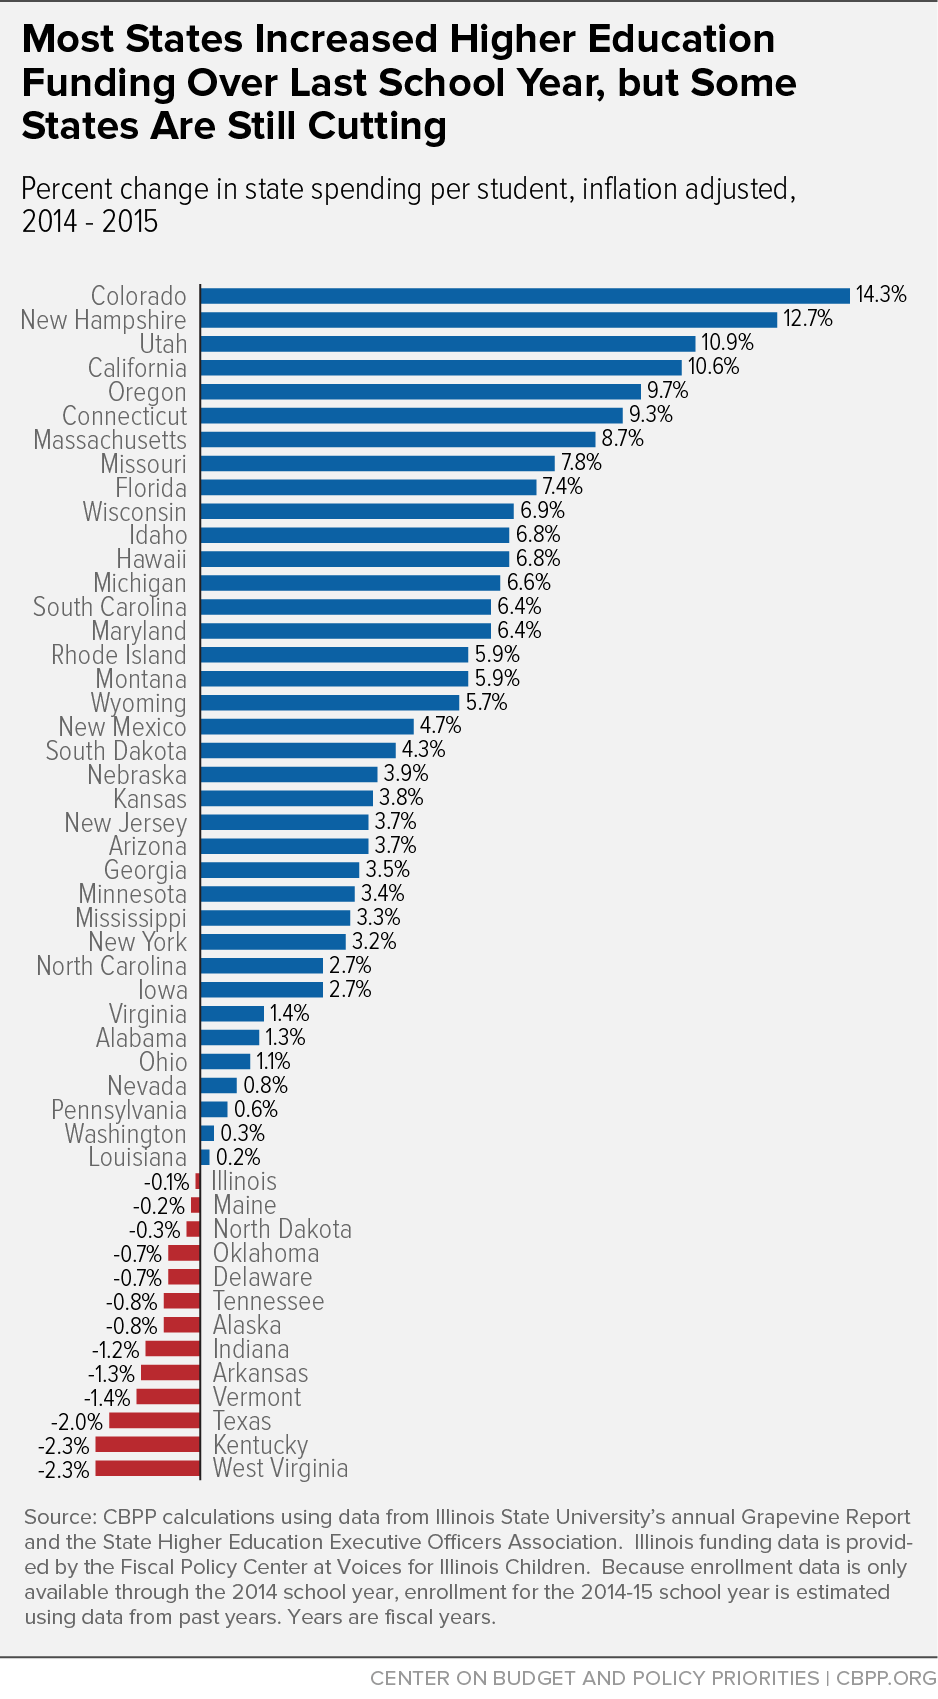
Still, in 13 states, per-student funding fell over the last year — declining, on average, by more than $50 per student. Adjusted for inflation:
- Funding cuts vary from $6 per student in Illinois to $179 in Kentucky.
- Five states — Alaska, Arkansas, Kentucky, Texas, and West Virginia — cut funding by more than $100 per student over the past year.
- Three states — Kentucky, Oklahoma, and West Virginia — have cut per-student higher education funding for the last two consecutive years.
Why Did States Cut Higher Education Funding?
The cuts resulted from state responses to the deep recession and a slow recovery.
-
While federal aid prevented even deeper cuts, state tax revenues fell very sharply and are only now returning to pre-recession levels. The recession of 2007-09 hit state revenues hard, and the slow recovery continues to affect them. High unemployment and a slow recovery in housing values left people with less income and less purchasing power. As a result, states took in less income and sales tax revenue, their main sources of revenue for funding education and other services. By the fourth quarter of 2014, total state tax revenues were only 2 percent greater than they were at the onset of the recession after adjusting for inflation.[3]
States relied heavily on federal assistance to stave off even deeper cuts to higher education in the early years of the economic downturn. The American Recovery and Reinvestment Act provided states with roughly $140 billion to fund existing state spending — including funds intended to support higher education. Unfortunately, this additional federal fiscal support dried up after only a few years, despite the fact that states continued to face sizeable budget gaps.[4] Partially because of this, the most dramatic cuts to higher education occurred in fiscal year 2012, years after the recession’s start.[5]
-
Limited revenues must support more students. Public higher education institutions are educating more students, raising costs. In part due to the “baby boom echo” causing a surge in the 18- to 24-year-old population, enrollment in public higher education was up by nearly 900,000 full-time-equivalent students, or 8.6 percent, between the beginning of the recession and the 2013-14 academic year (the latest year for which there are actual data).[6]
The recession also played a large role in swelling enrollment numbers, particularly at community colleges, reflecting high school graduates choosing college over dim employment prospects and older workers entering classrooms in order to retool and gain new skills.[7]
Other areas of state budgets also are under pressure. For example, an estimated 485,000 more K-12 students are enrolled in the current school year than in 2008.[8] Long-term growth in state prison populations — with state facilities now housing nearly 1.36 million inmates — also continues to put pressure on state spending.[9]
- Many states chose sizable budget cuts over a balanced mix of spending reductions and targeted revenue increases. States relied disproportionately on damaging cuts to close the large budget shortfalls they faced over the course of the recession. Between fiscal years 2008 and 2012, states closed 45 percent of their budget gaps through spending cuts but only 16 percent through taxes and fees (they used federal aid, reserves, and various other measures to close the remainder of their shortfalls). States could have lessened the need for deep cuts to higher education funding if they had been more willing to raise additional revenue.
II. Tuition Costs Have Grown Rapidly As State Support Has Declined
Tuition costs in most states have climbed higher than they were before the recession. Since the 2007-08 school year, average annual published tuition has risen by $2,068 nationally, or 29 percent, above the rate of inflation.[10] Steep tuition increases have been widespread, and average tuition at public four-year institutions, adjusted for inflation, has increased by:
- more than 60 percent in six states;
- more than 40 percent in ten states; and
- more than 20 percent in 33 states. (See Figure 3.)
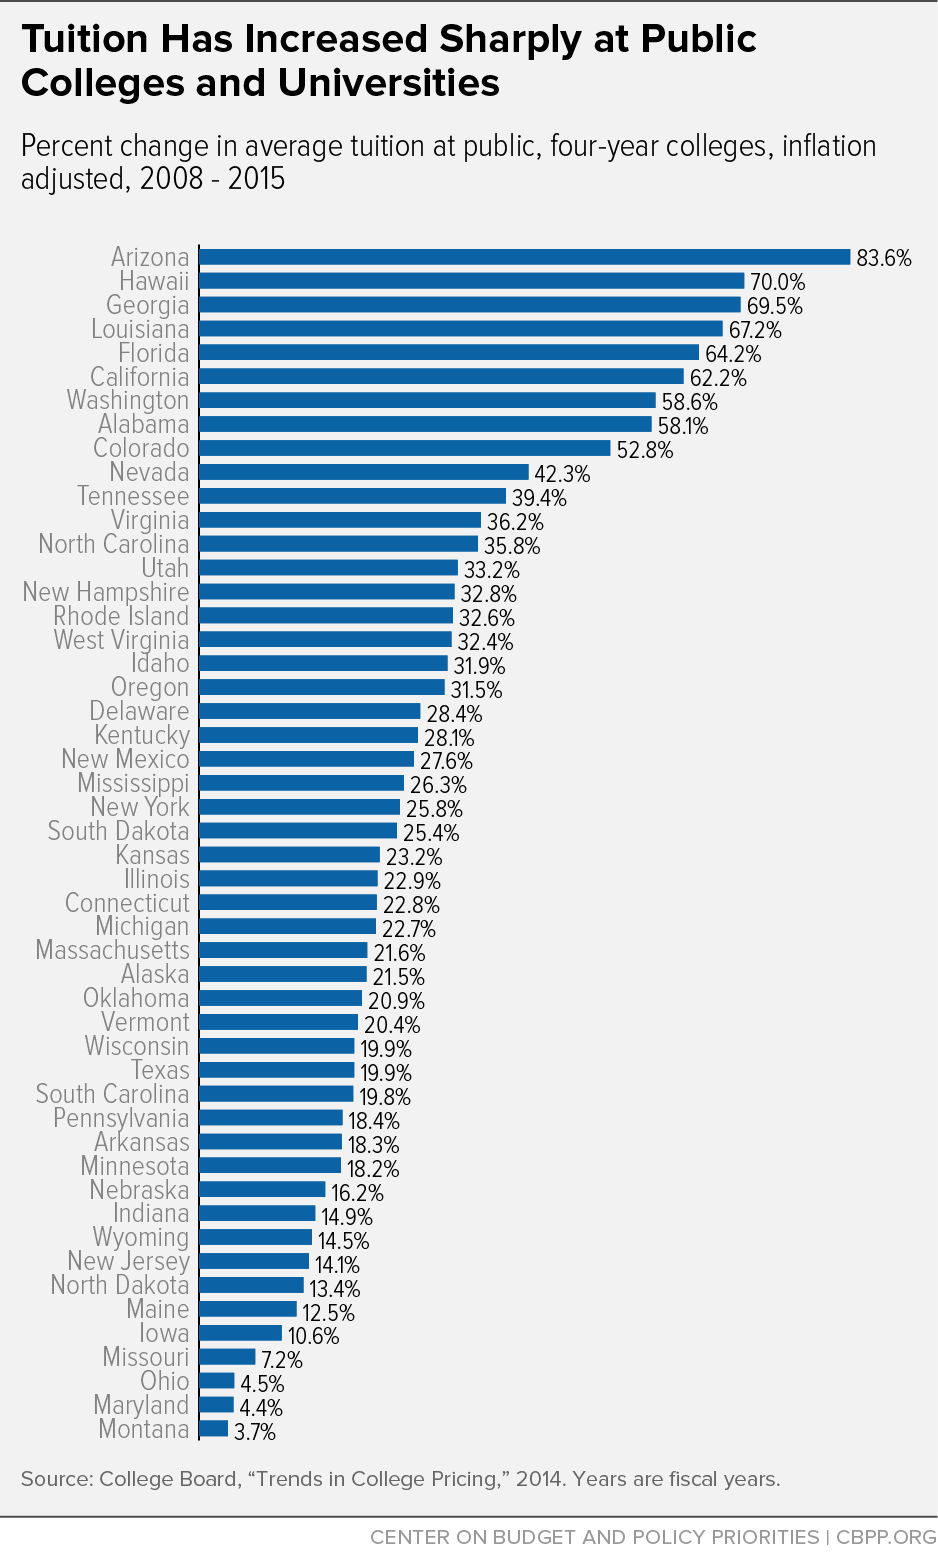
In Arizona, the state with the greatest tuition increases since the start of the recession, tuition has risen 83.6 percent, or $4,734 per student, after adjusting for inflation. Average tuition at a four-year Arizona public university is now $10,398 a year.[11]
As states have begun to reinvest in public higher education, tuition hikes in 2014-15 have been much smaller than in preceding years.[12] Published tuition — the “sticker price” — at public four-year institutions increased in 34 states over the past year, but only modestly. Average tuition increased $107, or 1.2 percent, above inflation.[13] Between last year and this year, after adjusting for inflation:
- Louisiana increased average tuition across its four-year institutions more than any other state, hiking it by nearly 9 percent, or roughly $600.
- Four states — Louisiana, Hawaii, West Virginia, and Tennessee — raised average tuition by more than 4 percent.
- In 16 states, tuition fell modestly, with declines ranging from $6 in Ohio to $182 in New Hampshire.[14]
III. Cost Shift Harms Students and Families, Especially Those with Low Incomes
During and immediately following recessions, state and local funding for higher education has tended to plummet, while tuition has tended to spike. During periods of economic growth, funding has tended to recover somewhat while tuition has stabilized at a higher level as a share of total higher educational funding.[15] (See Figure 4.)
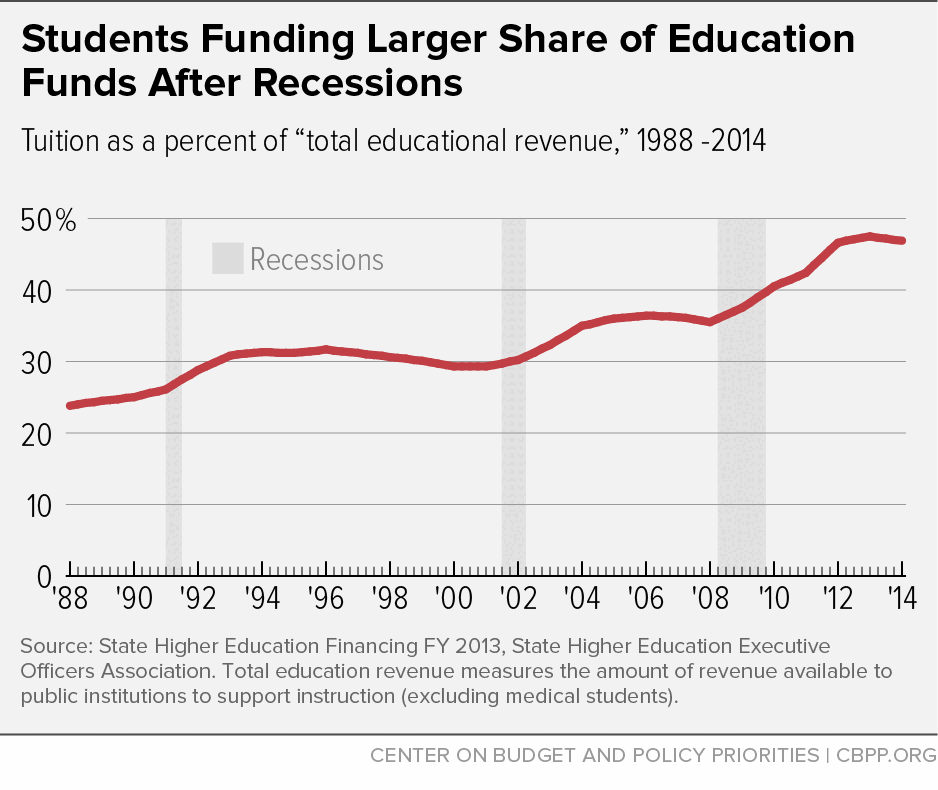
This trend has meant that over time, students have assumed much greater responsibility for paying for public higher education. In 1988, public colleges and universities received 3.2 times as much in revenue from state and local governments as they did from students. They now receive about 1.1 times as much from states and localities as from students.
Nearly every state has shifted costs to students over the last 25 years — with the most drastic shifts occurring since the onset of the Great Recession. In 1988, average tuition costs were greater than per-student state expenditures in only two states, New Hampshire and Vermont. By 2008, that number had grown to ten states. Today, tuition revenue is greater than state and local government funding for higher education in half of the states, with seven — Colorado, Delaware, Michigan, New Hampshire, Pennsylvania, Rhode Island, and Vermont— requiring students and families to shoulder the lion’s share of higher education costs by a ratio of at least 2-to-1.[16]
The Effects of Shifting Costs on Students, Families, and the Economy
The cost shift from states to students has happened over a period when absorbing additional expenses has been difficult for many families because their incomes have been stagnant or declining. In the 1970s and early- to mid-1980s, tuition and incomes both grew modestly faster than inflation, but by the late 1980s, tuition began to rise much faster than incomes.
Rapidly rising tuition at a time of weak income growth has damaging consequences for families, students, and the national economy.
- Tuition costs are deterring some students from enrolling in college. While the recession encouraged many students to enroll in higher education, the large tuition increases of the past few years may have prevented further enrollment gains. Rapidly rising tuition makes it less likely that students will attend college. Research has consistently found that college price increases result in declining enrollment.[17] While many universities and the federal government provide financial aid to help students bear the cost, research suggests that a high sticker price can dissuade students from enrolling even if the net price, including aid, doesn’t rise.
-
Tuition increases are likely deterring low-income students, in particular, from enrolling. Research further suggests that college cost increases have the biggest impact on students from low-income families. For example, a 1995 study by Harvard University researcher Thomas Kane concluded that states that had the largest tuition increases during the 1980s and early 1990s “saw the greatest widening of the gaps in enrollment between high- and low-income youth.”[18] These damaging effects may be exacerbated by the relative lack of knowledge among low-income families about the admissions and financial aid process. Low-income students tend to overestimate the true cost of higher education more than students from wealthier households, in part because they are less aware of financial aid for which they are eligible.[19]
These effects are particularly concerning because gaps in college enrollment between higher- and lower-income youth are already pronounced. In 2012 just over half of recent high school graduates from families in the bottom income quintile enrolled in some form of postsecondary education, as opposed to 82 percent of students from the highest income quintile.[20] Significant enrollment gaps based on income exist even among prospective students with similar academic records and test scores.[21] Rapidly rising costs at public colleges and universities may widen these gaps further.
-
Tuition increases may be pushing lower-income students toward less-selective institutions, reducing their future earnings. Perhaps just as important as a student’s decision to enroll in higher education is the choice of which college to attend. A 2013 study by the Brookings Institution revealed that a large proportion of high-achieving, low-income students fail to apply to any selective colleges or universities.[22] Even here, research indicates financial constraints and concerns about cost push lower-income students to narrow their list of potential schools and ultimately enroll in less-selective institutions.[23] In a different 2013 study, economists Eleanor Dillon and Jeffrey Smith found evidence that some high-achieving, low-income students are more likely to “undermatch” in their college choice in part due to financial constraints.[24]
Where a student decides to go to college has broad economic implications, especially for disadvantaged students and students of color. A 2011 study by Stanford University and Mathematica Policy Research found students who had parents with less education, as well as African American and Latino students, experienced higher postgraduate earnings by attending more elite colleges relative to similar students who attended less-selective universities.[25]
IV. Federal Financial Aid Helps Low-Income Students Afford Higher Tuition Costs, but Debt Is Still Growing
Federal financial aid has played a critical role in partially offsetting higher costs for students and families. Pell Grants are the signature form of federal grant support, and help more than 8 million students afford college. Research shows that Pell Grants and other need-based aid help students attend and graduate from college. Students qualifying for Pell Grants are more likely than other students to face significant hurdles to completing college, such as single parenthood and lack of financial support from their own parents. Controlling for these risk factors, a Department of Education study found that Pell Grant recipients who graduate do so faster than other students.[26] Further, research on need-based grant aid more generally has shown that such aid increases college enrollment among low- and moderate-income students.[27]
As noted, college costs — even at two-year and four-year state institutions — have risen sharply. Congress increased the maximum value of Pell Grants and modestly increased eligibility between 2007 and 2010, though it later pared back some of these expansions. It also indexed the maximum Pell Grant to inflation from 2013 to 2017, though college costs have been increasing faster than inflation, a trend that is projected to continue. The increase in Pell Grants has partially offset reduced state support and the erosion of Pells’ value as a share of total college costs over time. Still, Pell Grants now cover only about 30 percent of the cost of attendance at public four-year colleges, the lowest share since 1974.[28]
While federal financial aid has helped lessen the impact of tuition and fee increases on low-income students, the overall average cost of attending college has risen for these students. As a result, the net cost of attendance at four-year public institutions for low-income students increased 12 percent from 2008 to 2012, after adjusting for inflation. For low-income students attending public community colleges, the increase over the same time period was 4 percent.[29]
Low-Income Students Still Face High Levels of Debt
Because grants rarely cover the full cost of college attendance, most students — and low-income students in particular — borrow money. In 2012, 79 percent of low-income students — from families in the bottom income quartile — graduating with a bachelor’s degree had student loans (compared with 55 percent of graduating students from higher-income families).[30] Nearly nine of ten Pell Grant recipients who graduate from four-year colleges have student loans, and their average debt is nearly $5,000 larger than their higher-income peers.[31]
Debt levels have risen since the start of the recession for college and university students collectively. By the fourth quarter of 2014, students held $1.16 trillion in student debt — eclipsing both car loans and credit card debt.[32] Further, the overall share of students graduating with debt has increased since the start of the recession. Between the 2007-08 and 2012-13 school years, the share of students graduating from a public four-year institution with debt increased from 55 to 59 percent. At the same time, between the 2007-08 and 2012-13 school years, the average amount of debt incurred by the average bachelor’s degree recipient with loans at a public four-year institution grew from $22,000 to $25,600 (in 2013 dollars), an inflation-adjusted increase of $3,600, or roughly 16 percent. By contrast, the average level of debt incurred had risen only about 3.7 percent in the eight years prior to the recession.[33] In short, at public four-year institutions, a greater share of students are taking on larger amounts of debt.
V. Conclusion
States have cut higher education funding deeply since the start of the recession. These cuts were in part the result of a revenue collapse caused by the economic downturn, but they also resulted from misguided policy choices. State policymakers relied heavily on spending cuts to make up for lost revenues. They could have lessened the need for higher education funding cuts if they had used a more balanced mix of spending cuts and revenue increases to balance their budgets.
The impact of the funding cuts has been dramatic. Public colleges have both steeply increased tuition and pared back spending, often in ways that may compromise the quality of education and jeopardize student outcomes. Students are paying more through increased tuition and by taking on greater levels of debt.
Strengthening state investment in higher education will require state policymakers to make the right tax and budget choices over the coming years. A slow economic recovery and the need to reinvest in other services that also have been cut deeply mean that many states will need to raise revenue to rebuild their higher education systems. At the very least, states must avoid shortsighted tax cuts, which would make it much harder for them to invest in higher education, strengthen the skills of their workforce, and compete for — or even create — the jobs of the future.
At the federal level, to enable low-income students to access and succeed in higher education, policymakers should ensure adequate support for the Pell Grant program and targeted refundable tax credits. My colleagues at the Center who specialize in federal budget and tax policy have identified specific policy recommendations that federal lawmakers could pursue to help students access higher education:
- Protect and maintain the current assistance level of the Pell Grant program by continuing to index the maximum grant to inflation after 2017. As the costs of college have increased over time, the value of the Pell Grant has fallen; the maximum grant now covers roughly 30 percent of the average cost of a four-year public college, the lowest share in 40 years.[34] The maximum Pell Grant is currently indexed to inflation through 2017, after which the grant’s value will erode further as it is frozen and loses some of its real value each year.
- Reach a bipartisan agreement that undoes and replaces sequestration to relieve the pressure on non-defense discretionary funding. Under current law, this funding will continue to fall as a share of the economy, which will put further pressure on the discretionary portion of Pell Grant funding, as well as other student aid and education programs. While discretionary spending was not responsible for our long-term deficit/debt problems, the share of spending (as a percent of our economy) on non-defense discretionary programs is headed to the lowest levels ever since 1962 as a result of the 2011 Budget Control Act and other appropriations cuts.[35]
- Make permanent the American Opportunity Tax Credit (AOTC) and key provisions of the Child Tax Credit (CTC) and Earned Income Tax Credit (EITC) that are set to expire at the end of 2017. The AOTC, which is refundable up to $1,000, reaches millions of low-income students who did not benefit from its predecessor, the Hope Credit (which is not refundable and to which the AOTC will revert if no action is taken). In addition, research suggests that income from the working family tax credits (EITC and CTC) may boost college enrollment and completion, both because of the skill gains made from better K-12 educational attainment, and by making college more affordable in the spring before enrollment (through increased tax refunds).[36]
A large and growing share of future jobs will require college-educated workers. Sufficient funding for higher education to keep tuition affordable and quality high at public colleges and universities, and to provide financial aid to those students who need it most, would help the nation develop the skilled and diverse workforce that is critical to our economic future.
End Notes
[1] State Higher Education Executive Officers Association, April 2015.
[2] CBPP calculation using the “Grapevine” higher education appropriations data from Illinois State University, enrollment and combined state and local funding data from the State Higher Education Executive Officers Association, and the Consumer Price Index, published by the Bureau of Labor Statistics. Since enrollment data are only available through the 2012-13 school year, enrollment for the 2013-14 school year is estimated using data from past years.
[3] CBPP analysis of Census quarterly state and local tax revenue, http://www.census.gov/govs/qtax/.
[4] Nicholas Johnson, Phil Oliff, and Erica Williams, “An Update on State Budget Cuts,” Center on Budget and Policy Priorities, February 9, 2011, https://www.cbpp.org/research/an-update-on-state-budget-cuts.
[5] CBPP calculation using the “Grapevine” higher education appropriations data from Illinois State University, enrollment and combined state and local funding data from the State Higher Education Executive Officers Association, and the Consumer Price Index, published by the Bureau of Labor Statistics.
[6] State Higher Education Executive Officers Association, April 2015. Note: while full-time-equivalent enrollment at public two- and four-year institutions is up since fiscal year 2008, between fiscal years 2012 and 2013 it fell by approximately 150,000 enrollees — a 1.3 percent decline.
[7] See, for example, “National Postsecondary Enrollment Trends: Before, During and After the Great Recession,” National Student Clearinghouse Research Center, July 2011, p. 6, http://pas.indiana.edu/pdf/National%20Postsecondary%20Enrollment%20Trends.pdf. A survey conducted by the American Association of Community Colleges indicated that increases in Fall 2009 enrollment at community colleges were, in part, due to workforce training opportunities; see Christopher M. Mullin, “Community College Enrollment Surge: An Analysis of Estimated Fall 2009 Headcount Enrollments at Community Colleges,” AACC, December 2009, http://files.eric.ed.gov/fulltext/ED511056.pdf.
[8] National Center for Education Statistics, Enrollment in public elementary and secondary schools, by level and grade: Selected years, fall 1980 through fall 2023, Table 203.10, http://nces.ed.gov/programs/digest/d13/tables/dt13_203.10.asp?current=yes.
[9] CBPP analysis of data from U.S. Department of Justice, Bureau of Justice Statistics.
[10] CBPP analysis using the College Board’s “Trends in College Pricing 2014,” http://trends.collegeboard.org/college-pricing/figures-tables/tuition-fees-room-board-time. Note: in non-inflation-adjusted terms, average tuition is up $2,948 over this time period.
[11] Ibid.
[12] Costs reported above include both published tuition and fees. Average tuition and fee prices are weighted by full-time enrollment.
[13] This paper uses CPI-U-RS inflation adjustments to measure real changes in costs. Over the past year the CPI-U-RS increased by 1.47 percent. We use the CPI-U-RS for the calendar year that begins the fiscal/academic year.
[14] CBPP calculation using the College Board’s “Trends in College Pricing 2013,” http://trends.collegeboard.org/college-pricing. See appendix for fiscal year 2013-14 change in average tuition at public four-year colleges.
[15] State Higher Education Executive Officers Association, “State Higher Education Finance: FY2013,” 2014, p. 22, Figure 4, http://www.sheeo.org/sites/default/files/publications/SHEF_FY13_04252014.pdf.
[16] State Higher Education Executive Officers Association, April 2015; government funding includes dollars from both state and local funding sources.
[17] See, for example, Steven W. Hemelt and Dave E. Marcotte, “The Impact of Tuition Increases on Enrollment at Public Colleges and Universities,” Educational Evaluation and Policy Analysis, September 2011; Donald E. Heller, “Student Price Response in Higher Education: An Update to Leslie and Brinkman,” The Journal of Higher Education, Volume 68, Number 6 (November-December 1997), pp. 624-659.
[18] Thomas J. Kane, “Rising Public College Tuition and College Entry: How Well Do Public Subsidies Promote Access to College?” National Bureau of Economic Research, 1995, http://www.nber.org/papers/w5164.pdf?new_window=1.
[19] Eric P. Bettinger et al., “The Role of Simplification and Information in College Decisions: Results from the H&R Block FAFSA Experiment,” National Bureau of Economic Research, 2009, http://www.nber.org/papers/w15361.pdf.
[20] College Board, “Education Pays: 2013,” http://trends.collegeboard.org/sites/default/files/education-pays-2013-full-report-022714.pdf.
[21] In a 2008 piece, Georgetown University scholar Anthony Carnavale pointed out that “among the most highly qualified students (the top testing 25 percent), the kids from the top socioeconomic group go to four-year colleges at almost twice the rate of equally qualified kids from the bottom socioeconomic quartile.” Anthony P. Carnavale, “A Real Analysis of Real Education,” Liberal Education, Fall 2008, p. 57.
[22] Christopher Avery and Caroline M. Hoxby, “The Missing ‘One Offs’: The Hidden Supply of High-Achieving, Low-Income Students,” National Bureau for Economic Research, Working Paper 18586, 2012, http://www.brookings.edu/~/media/projects/bpea/spring-2013/2013a_hoxby.pdf.
[23]Patrick T. Terenzini, Alberto F. Cabrera, and Elena M. Bernal, “Swimming Against the Tide,” College Board, 2001, http://www.collegeboard.com/research/pdf/rdreport200_3918.pdf.
[24] Eleanor W. Dillon and Jeffrey A. Smith, “The Determinants of Mismatch Between Students and Colleges,” National Bureau of Economic Research, August 2013, http://www.nber.org/papers/w19286. Additionally, other studies have found that undermatching is more likely to occur for students of color. In 2009 Bowen, Chingos, and McPherson found that undermatching was more prevalent for black students — especially black women — relative to comparable white students.
[25] Stacey Dale and Alan Krueger, “Estimating the Return to College Selectivity Over the Career Using Administrative Earning Data,” Mathematica Policy Research and Princeton University, February 2011, http://www.mathematica-mpr.com/publications/PDFs/education/returntocollege.pdf.
[26] Christina Chang Wei, Laura Horn, and Thomas Weko, “A Profile of Successful Pell Grant Recipients: Time to Bachelor’s Degree and Early Graduate School Enrollment,” National Center for Education Statistics, July 2009, http://nces.ed.gov/pubs2009/2009156.pdf.
[27] See Susan Dynarski and Judith Scott-Clayton, “Financial Aid Policy: Lessons from Research,” The Future of Children, Spring 2013, http://futureofchildren.org/futureofchildren/publications/docs/23_01_04.pdf.
[28] Brandon DeBot, “House Budget Would Reduce College Access by Cutting Pell Grants,” Center on Budget and Policy Priorities, March 25, 2015, https://www.cbpp.org/blog/house-budget-would-reduce-college-access-by-cutting-pell-grants.
[29] College Board, “Cumulative Debt of 2011-12 Bachelor’s Degree Recipients by Dependency Status and Family Income,” October 2014, http://trends.collegeboard.org/college-pricing/figures-tables/net-prices-income-over-time-public-sector.
[30] College Board, “Trends in Student Aid, 2014: Median Debt Levels of 2007-08 Bachelor’s Degree Recipients by Income Level,” October 2014, Figure 2010_9, http://trends.collegeboard.org/sites/default/files/2014-trends-student-aid-final-web.pdf. Low-income dependent students are defined as students from families earning less than $30,000 annually, while high-income students come from families earning more than $106,000.
[31] The Institute for College Access and Success, “Pell Grants Help Keep College Affordable for Millions of Americans,” March 13, 2015, http://ticas.org/sites/default/files/pub_files/overall_pell_one-pager.pdf.
[32] Federal Reserve Bank of New York, “Quarterly Report on Household Debt and Credit,” February 2015, http://www.newyorkfed.org/householdcredit/2014-q4/data/pdf/HHDC_2014Q4.pdf.
[33] College Board “Trends in Student Aid,” Figure 13A, http://trends.collegeboard.org/student-aid/figures-tables/average-cumulative-debt-bachelors-recipients-public-four-year-time.
[34] Brandon DeBot, “House Budget Would Reduce College Access by Cutting Pell Grants,” Center on Budget and Policy Priorities, March 25, 2015, https://www.cbpp.org/blog/house-budget-would-reduce-college-access-by-cutting-pell-grants.
[35] David Reich “Sequestration and Its Impact on Non-Defense Appropriations,” Center on Budget and Policy Priorities, February 19, 2015, https://www.cbpp.org/research/sequestration-and-its-impact-on-non-defense-appropriations.
[36] Chuck Marr, Chye-Ching Huang, Arloc Sherman, and Brandon DeBot, “EITC and Child Tax Credit Promote Work, Reduce Poverty, and Support Children’s Development, Research Finds,” Center on Budget and Policy Priorities, April 3, 2015, https://www.cbpp.org/research/eitc-and-child-tax-credit-promote-work-reduce-poverty-and-support-childrens-development?fa=view&id=3793.
More from the Authors