What to Look for in Next Week’s Census Figures on Poverty, Income, and Health Insurance
On September 12, the Census Bureau will release its official statistics on poverty, income, and health insurance coverage in 2017. Four points are worth noting in advance of the release.
1. Progress on Health Coverage Likely Ended and May Have Partly Reversed
Census will issue national and state estimates of health insurance coverage for 2017, based on its Current Population Survey (CPS) and American Community Survey (ACS). The 2017 figures will likely mark a break from recent trends, which showed historic coverage gains after the Affordable Care Act’s (ACA) major coverage expansions took full effect in 2014.
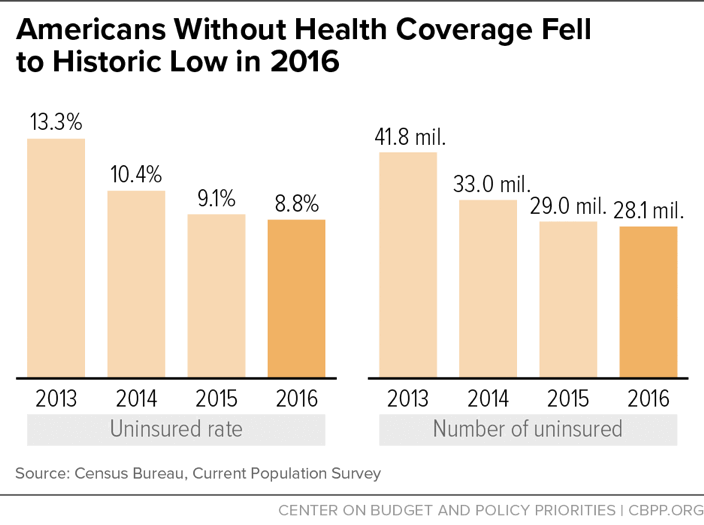
The share of Americans without health insurance dropped from 13.3 percent in 2013 to 8.8 percent in 2016, falling in every year and for virtually every racial, ethnic, gender, education, and income group that the Census data cover.[1] (See Figure 1.) Some 13.7 million fewer Americans were uninsured in 2016 than 2013.[2] Although technical changes in the CPS survey questions hamper comparisons with years before 2013, CPS and other survey data also show substantial declines in uninsurance from 2010 to 2013 as earlier ACA provisions took hold. [3]
Health coverage gains were greatest in the 31 states (including the District of Columbia) that extended Medicaid to more low-income adults by January 2016 under the ACA’s Medicaid expansion. If the uninsured rate had fallen in non-expansion states as much since 2013 as it did in expansion states, 4 million fewer Americans would have been uninsured in 2016.[4]
The Census data released on September 12, 2018 are expected to show an end to — and possibly a reversal of — these positive coverage trends, with the uninsured rate remaining steady or rising slightly in 2017 from its historic low of 8.8 percent in 2016. [5] Data from the smaller, previously released National Health Interview Survey (NHIS), which typically aligns with the Census data, show that the overall uninsured rate remained statistically unchanged in 2017.[6]
Certain groups of Americans are the most likely to have lost coverage in 2017. The NHIS data show coverage losses in 2017 among non-elderly adults, people in low- and middle-income families, Latinos, and residents of non-expansion states. Roughly 55 percent of the uninsured are eligible for health insurance coverage with financial assistance either under current Medicaid rules or subsidized ACA marketplace coverage, the Kaiser Family Foundation and Urban Institute estimate.[7]
A reversal of progress on health coverage in 2017 would likely reflect, at least in part, the initial impact of the Administration’s efforts to place obstacles in the way of ACA implementation. These efforts include the cancellation of most federal outreach efforts toward the pivotal end of the open enrollment period for 2017 marketplace coverage, public confusion caused by year-long congressional and Administration attempts to repeal the ACA, and rising concerns among lawfully present immigrants who are eligible for Medicaid or coverage through the marketplaces but may be deterred from enrolling due to the climate of fear that Administration positions on immigration have fostered.[8] If the Administration had offered continued support for ACA outreach and enrollment rather than undermining it, we might have expected further coverage gains, given the large numbers of uninsured people who are eligible for subsidized coverage. It’s important to note, however, that enrollment in Medicaid and the ACA marketplaces remained relatively strong in 2017 despite the Administration’s efforts.
2. Improvements in Poverty and Income May Have Slowed
The U.S. economy continued expanding in 2017, so poverty likely declined again last year and median household income likely rose. Total employment rose by 2.3 million jobs in 2017, close to 2016’s 2.5 million increase, according to U.S. Department of Labor data.
Improvements in poverty and income may have slowed in 2017, however, due in part to weaker growth in real earnings. Average inflation-adjusted weekly earnings rose less in 2017 (0.5 percent) than in the two previous years (0.8 percent and 1.9 percent in in 2016 and 2015, respectively), held back by rising inflation, according to the Labor Department. Median hourly wages rose just 0.2 percent in 2017 after rising 3.1 percent the year before, according to Economic Policy Institute data.[9]
3. Official Poverty Data Don’t Capture Long-Term Poverty Trends
The official poverty measure is a revealing indicator of the state of the private economy for less-fortunate adults and their families. But because it counts only cash incomes and omits the impact of key government income-assistance programs, the official poverty rate doesn’t accurately portray the overall financial well-being of low-income Americans or how that has changed over longer periods of time.
Some policymakers and pundits may be tempted to use the new poverty data to argue that federal anti-poverty programs have failed, contending that the official poverty rate has changed relatively little since the 1960s apart from fluctuations due to the business cycle. But comparing poverty rates between the 1960s and today using the official poverty measure yields a misleading picture of financial well-being and analysts across the political spectrum avoid doing so wherever possible. The official measure doesn’t count major non-cash and tax-based assistance, which now accounts for the bulk of means-tested benefits — such as SNAP (formerly food stamps), the Earned Income Tax Credit (EITC), the refundable Child Tax Credit, and rental subsidies.
Fortunately, the Census Bureau issues a second poverty measure, the Supplemental Poverty Measure (or SPM), which does count these benefits. (It also makes other improvements in poverty measurement, such as netting out income and payroll taxes and work expenses.) Census will release SPM data for 2017 on September 12, as well as data on the “official” poverty measure. Last year’s SPM data showed that economic security programs lifted 36 million people above the poverty line in 2016.[10]
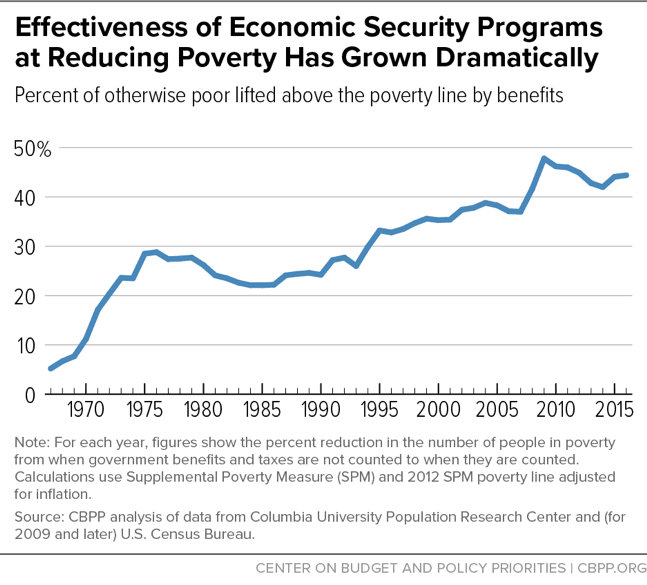
The Census Bureau’s SPM tables start in 2009, so they can’t by themselves answer longer-term questions such as how much the poverty rate has changed since the 1960s or whether it has returned to its level before the Great Recession. But a set of historical SPM estimates that Columbia University researchers have produced, known as the “anchored SPM,” show poverty trends and the impact of anti-poverty efforts over the long term.[11] These data show that economic security programs lifted just 5 percent of otherwise-poor individuals above the poverty line in 1967, but by 2016 this figure had climbed to 44 percent, according to CBPP's update of the Columbia figures.[12] In other words, the safety net of government economic security programs was more than eight times more effective at reducing poverty in 2016 as in 1967. (See Figure 2.)
This SPM series also shows that the poverty rate has declined substantially over the past five decades — by two-fifths between 1967 and 2016 — largely as a result of the strengthening of government economic security programs.
We will analyze the Census Bureau’s 2017 SPM data in the days after September 12 to provide anchored SPM trends and more complete estimates of government programs’ effects, both now and over time.
4. SPM Data Will Show Impact of Anti-Poverty Programs That the Administration and House Republicans Would Cut
The SPM tables that Census releases on September 12 will show how many fewer people were poor in 2016 if one counts various forms of government assistance, including refundable tax credits for working families (the EITC and Child Tax Credit), SNAP, and rental assistance — none of which the official poverty measure counts. The tables will also show how many people are lifted above the poverty line by programs that provide benefits in cash and that the official poverty measure does count, such as Supplemental Security Income (SSI) for the elderly and disabled poor, Temporary Assistance for Needy Families (TANF) for very low-income families with children, Social Security, and unemployment insurance.
Both the President’s 2019 budget[13] and the budget plan that the House Budget Committee adopted on a party-line vote on June 21[14] call for deep cuts in an array of low-income assistance programs including SNAP, SSI, TANF, and Medicaid. Policymakers are unlikely to enact these particular cuts this year, though the Trump and House budgets reflect where the President and some congressional leaders would take the country in the years ahead if they have the opportunity to do so.
More from the Authors

Areas of Expertise