SNAP Works for America’s Children
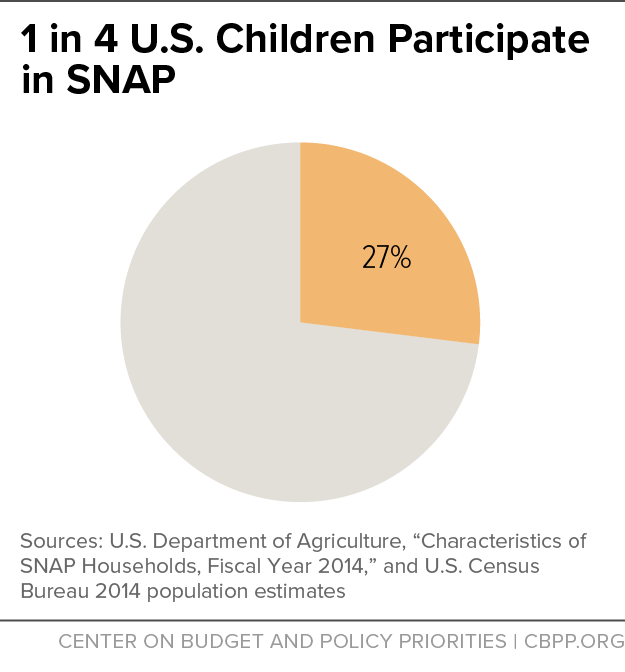
While SNAP provides only a modest benefit, it forms a critical foundation for the health and well-being of America’s children.The Supplemental Nutrition Assistance Program (SNAP) delivers more nutrition assistance to low-income children than any other federal program, making it the nation’s largest child nutrition program. In 2016, SNAP will help about 20 million children each month — about one in four U.S. children — while providing about $30 billion in nutrition benefits for children over the course of the year.[2] (See Figure 1.) While SNAP provides only a modest benefit — just $1.35 on average per person per meal for households with children — it forms a critical foundation for the health and well-being of America’s children, lifting millions of families and their children out of poverty and improving food security. Research shows that its support can have surprisingly important long-lasting effects.
- SNAP lifts millions of households out of poverty. SNAP kept about 10.3 million people out of poverty in 2012, including about 4.9 million children. SNAP lifted 2.1 million children out of deep poverty (defined as 50 percent of the poverty line), more than any other government assistance program.
- SNAP helps families put food on the table. Food insecurity — limited access to enough food for an active, healthy life — among children falls by roughly a third after their families receive SNAP benefits for six months. Giving families additional benefits during summer months when their children do not have access to free or reduced-price school meals also reduces the prevalence of very low food security among children — when some have to cut the size of meals, skip meals, or even go entire days without food — by about a third. SNAP’s benefits are concentrated among those with the greatest need.
- SNAP helps improve child health. Mothers exposed to SNAP (then called food stamps) during pregnancy as the program gradually expanded nationwide in the 1960s and early 1970s gave birth to fewer low birth-weight babies. Some evidence suggests that children receiving SNAP are less likely than low-income non-participants to be in fair or poor health or underweight, and their families are less likely to trade off paying for health care and paying for other basic needs, like food, housing, heating, and electricity.
- Children who receive SNAP do better in school. Access to an adequate, healthy diet during early childhood is essential to developing the skills crucial for school success, including memory, emotional stability, and social skills. SNAP participation can lead to improvements in reading and mathematics skills among elementary children, especially young girls, and increase the chances of graduating from high school.
- Early access to SNAP can improve long-term health and economic outcomes. Adults who had access to SNAP as young children reported better health and had lower rates of “metabolic syndrome” (a combined measure of the incidence of obesity, high blood pressure, heart disease, and diabetes), and women who had access to food stamps as young children reported improved economic self-sufficiency (as measured by a combination of employment, income, poverty status, high school graduation, and program participation).
Key Features of SNAP Are Critical to Its Success
Despite its modest benefit levels, SNAP forms a critical foundation for children’s health and well-being thanks to several important features. As a national program administered by states, it has:
- A funding structure that enables a quick and automatic response to changing economic conditions. SNAP benefits are an entitlement, which means that anyone who qualifies under the program’s rules can receive benefits. This funding structure enables SNAP to respond quickly and effectively to support low-income families and communities during times of economic downturn and increased need. Enrollment expands when the economy weakens and contracts when the economy recovers. And SNAP can respond immediately to help families bridge temporary periods of unemployment and weather a family crisis, such as separation or divorce.
- Uniform eligibility rules that make benefits available to children in almost all families with little income and few resources. Unlike many other benefit programs, which are restricted to particular categories of low-income individuals (such as senior citizens, people with disabilities, families with children, veterans, or people who recently became unemployed), SNAP is broadly available to almost all households, including those with children, that have low incomes. SNAP eligibility rules and benefit levels are, for the most part, set at the federal level and uniform across the nation, with state flexibility where it can enhance the program’s effectiveness. This ensures that poor families with similar incomes receive similar nutrition resources regardless of where they live.
- A benefit structure that targets assistance to families with the fewest resources available for food. SNAP expects families receiving benefits to spend 30 percent of their net income (that is, available income after deductions for certain necessary expenses) on food. Families with no net income receive the maximum benefit; all other households receive a reduced benefit, reflecting the household’s expected contribution. As a result, families with little or no income receive larger benefits than those with higher incomes, and program benefits are concentrated among those with the greatest need. This targeting of assistance also means that benefits tend to be higher in areas of the country where wages and public assistance benefits are lower, making SNAP especially important in southern states and rural areas, where wages generally are lower.
- Rigorous requirements to ensure a high degree of program integrity. SNAP has extensive requirements that households applying for or seeking to continue benefits prove their eligibility. It also has sophisticated computer matches to detect unreported earnings, robust measures to ensure the accurate assessment of household eligibility, a Quality Control (QC) system that is the most rigorous of any public benefit program, and a variety of administrative and criminal enforcement mechanisms.
- A sharp focus on providing food assistance. SNAP benefits are limited to the purchase of food at supermarkets, grocery stores, farmers’ markets, and other authorized retailers for use at home. SNAP’s administrative funding also supports nutrition education and obesity prevention programs that use evidence-based activities to promote healthy food choices within a limited budget and state employment and training efforts.
The Importance of SNAP for Children
Poor children lag behind non-poor children on a wide range of indicators of physical, mental, academic, and economic well-being.[3] Poor children are more likely to have health, behavioral, learning, and emotional problems. This is especially true of poor children whose families experience deep poverty, those who are poor during early childhood, and those who are poor for a long time. Poor children are also more likely to be food insecure, and food insecurity in households with children is associated with inadequate intake of several important nutrients, deficits in cognitive development, behavioral problems, and poor health during childhood.[4]
There is growing awareness among researchers that the consequences of adversity — poverty, abuse or neglect, parental substance abuse or mental illness, and exposure to violence — during the early years of life can extend well beyond childhood and affect physical, mental, and economic well-being as adults. Harvard University’s Center on the Developing Child recently noted that “early childhood is a time of great promise and rapid change, when the architecture of the developing brain is most open to the influence of relationships and experiences. Yet, at the same time, significant disadvantages in the life circumstances of young children can undermine their development [and] limit their future economic and social mobility[.]”[5]
It is in this context that SNAP is so important for America’s low-income children. No other nutrition or income support program reaches as many at-risk children or contributes as much to the overall resources of very low-income households with children.[6] And despite the relatively low value of its food benefit, SNAP helps lift millions of families with children out of poverty, reduces the depth and severity of poverty for millions more, alleviates food insecurity, and contributes to children’s healthy development and long-term prospects.
SNAP Serves Millions of Low-Income Children
SNAP serves a broad and diverse cross-section of America’s low-income families and children. Families with children are more likely to earn a paycheck than to receive government cash assistance while participating in SNAP, and they show a strong connection to the labor force. And although SNAP benefits are modest, they account for a significant portion of the total resources available to low-income families.[7]
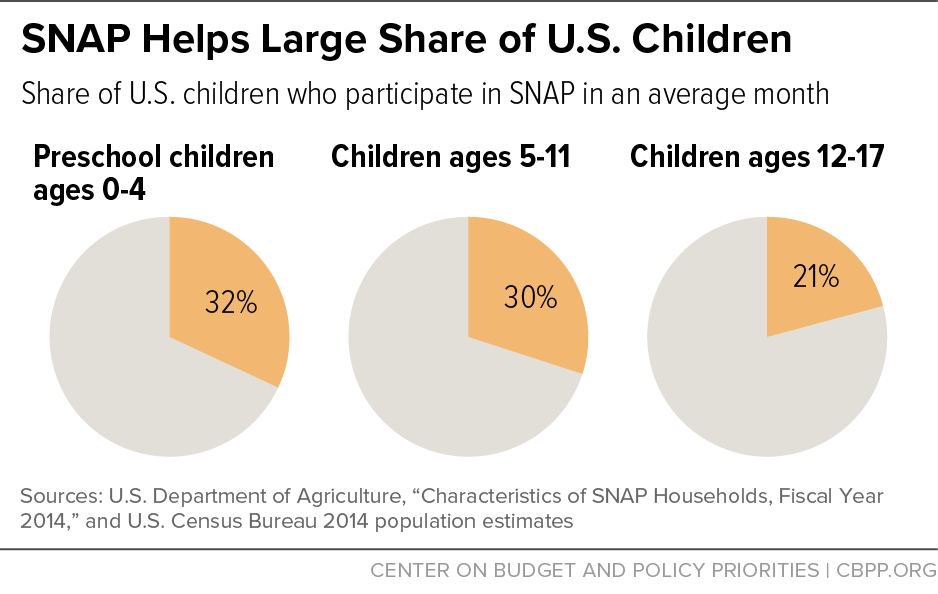
- SNAP reaches millions of children who need food assistance. Many of America’s children face the dual risks of poverty and food insecurity. One in five children live in poverty, and one in six live in families that have trouble putting enough food on the table.[8] (See box, “Defining Food Insecurity Among Children,” below.) Of particular concern, young children are more likely to live in poor and food-insecure families than older children. In a typical month, SNAP currently serves about 20 million children — roughly one out of every four children in the United States and one out of three pre-school children (see Figure 2). Virtually all children eligible for SNAP benefits receive them, although citizen children living with non-citizen adults are less likely to participate (83 percent in fiscal year 2014) than other eligible children.[9]
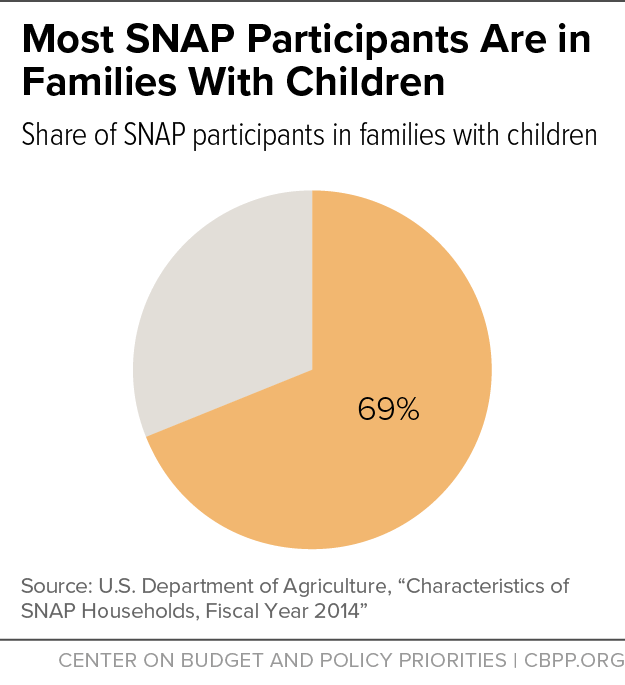
- SNAP predominately serves families with children. While SNAP is one of the few means-tested government benefit programs available to almost all households with low incomes, most participants are part of families with children. Over two-thirds of all SNAP participants live in families with children (see Figure 3); nearly half of all SNAP households include at least one child, and they receive two-thirds of all benefits issued. Nearly half of the SNAP families with children include at least one pre-school child (0-4 years old), and more than three-quarters include a school-age child (5-17 years old). See the Appendix for state-level tables on SNAP households with children.
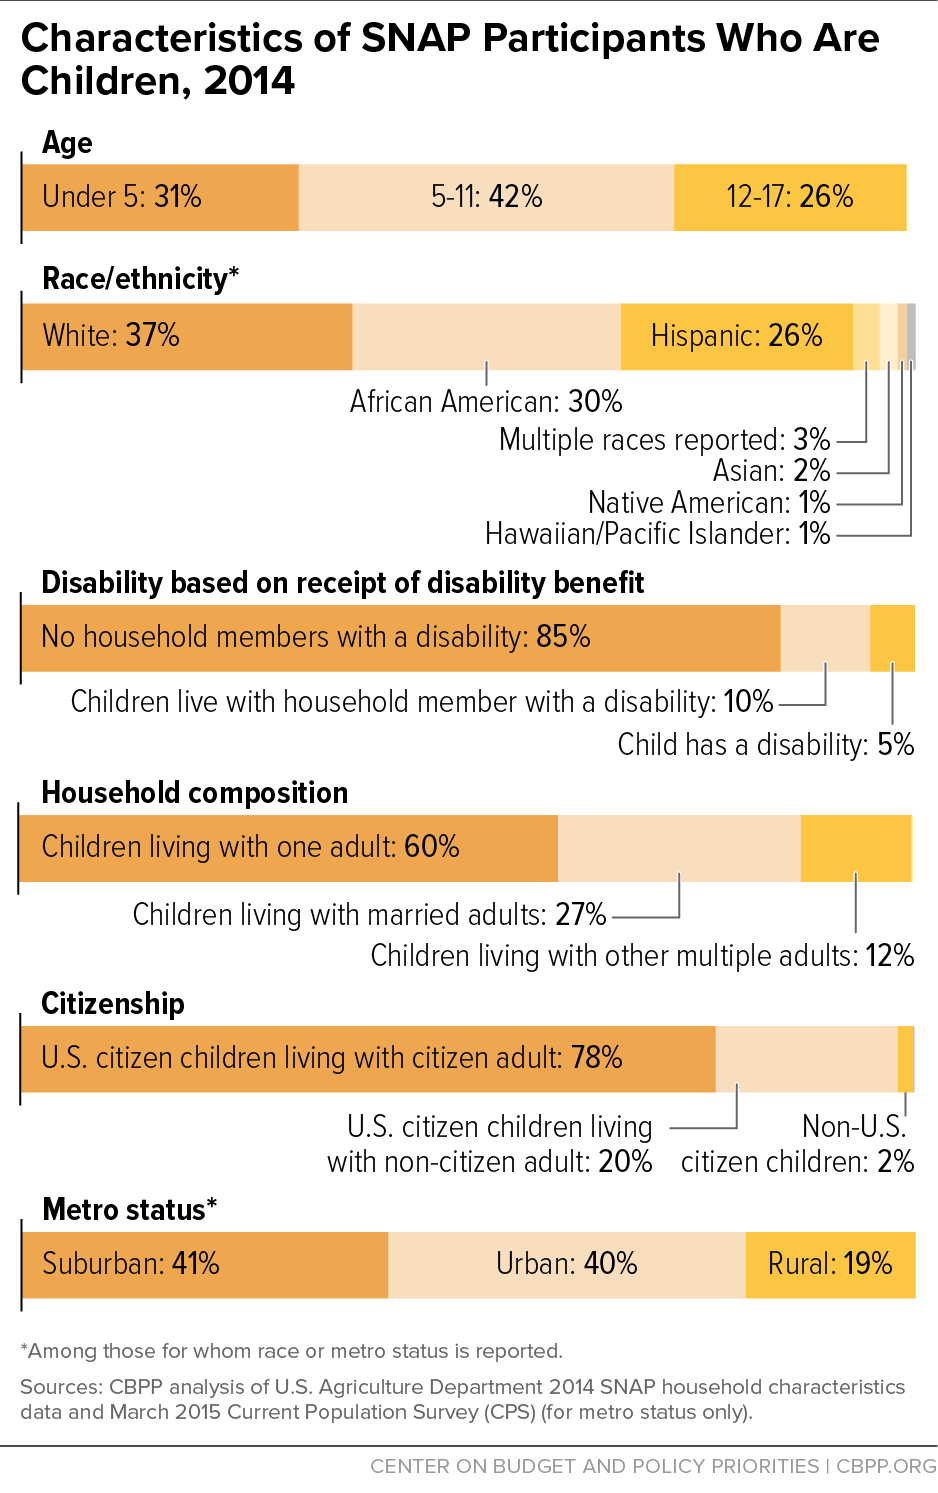
- SNAP children are diverse. Nearly a third of the children are younger than 5 years old, two-fifths are 5 to 11 years old, and a quarter are 12 to 17 years old. Among the children who report their race and ethnicity, a little more than a third are white, nearly a third are African American, and a quarter are Hispanic. Virtually all participating children are U.S. citizens; 20 percent live in a household with at least one non-citizen.[10] About 40 percent live in urban areas, 41 percent in suburban areas, and 19 percent in rural areas. About three in five children receiving SNAP live with a single adult. (See Figure 4 and Appendix Table 4.)
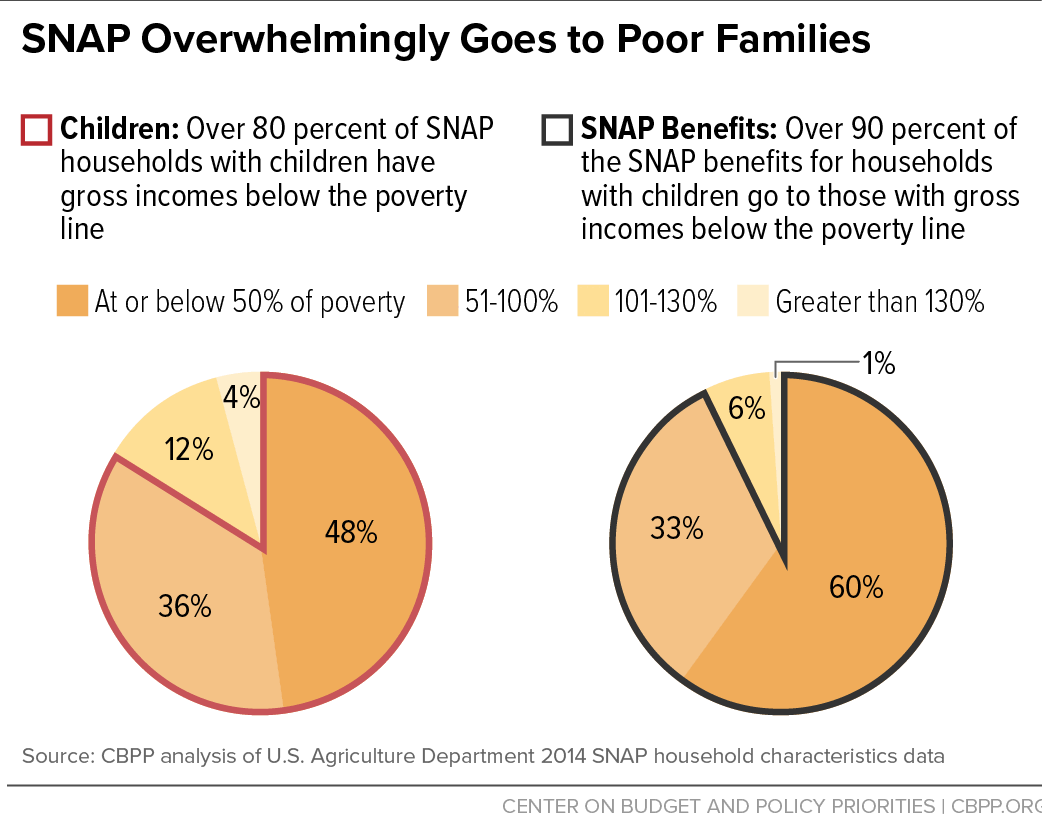
Figure 4 - SNAP families with children have little income and few resources. Over 80 percent of SNAP households with children have gross incomes below the poverty line ($20,100 for a family of three in 2016) while they are receiving SNAP. Nearly half of SNAP households with children have incomes below half of the poverty line, and about one in seven have no other income while participating. (See Figure 5.) Although SNAP benefits average only about $1.35 per person per meal for families with children, they account for more than a quarter of the total resources (cash income and SNAP benefits) available to low-income families with children in months when they are participating in SNAP.[11]
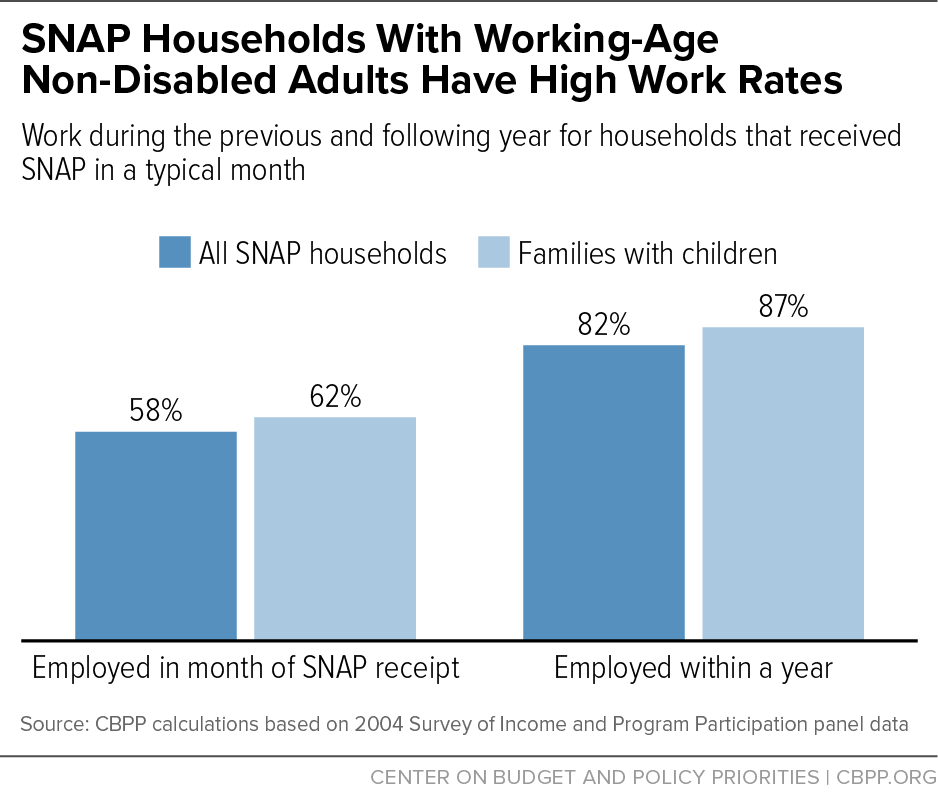
Figure 5 - The overwhelming majority of SNAP recipients in families with children who can work do work. Over half of all families with children where there is a non-elderly, non-disabled adult in the household have at least one working member while they participate in SNAP. Even more striking, almost 90 percent work in the year before or after participating, demonstrating strong labor force participation.[12] (See Figure 6.) Most SNAP households that work have substantial full-time work. The number of SNAP families with children and earnings while participating in SNAP has risen for more than a decade, and tripled from 1.7 million in 2000 to 5.1 million in 2014.
Figure 6 - Few SNAP families with children receive cash assistance. Only one in seven households with children (15 percent) receive cash assistance (Temporary Assistance for Needy Families or General Assistance) while participating in SNAP, primarily because a small share of families eligible for TANF cash assistance participate.[13] Prior to the 1996 welfare law, almost two-thirds of SNAP families with children received such cash assistance.
- SNAP helps families with disabled members. Five percent of SNAP children have a severe disability (that is, they receive a disability benefit, usually Supplemental Security Income), and another 10 percent live with a household member who receives disability benefits.[14]
- SNAP offers temporary assistance to many families and longer-term relief when needed. Half of all families with children leave SNAP within the first year of entering. Children living with more than one adult tend to leave the program more quickly than those living with one adult. While half of the children living with married parents leave within 12 months, it takes 20 months for half of children living with a single parent to leave the program, probably because of the additional challenges single parents face in finding and keeping a well-paying job, especially in terms of arranging for safe and reliable child care.[15]
SNAP Reduces Childhood Poverty
Poverty has many adverse consequences for children’s well-being, including increased food insecurity, poor health, and reduced earnings potential. Deep poverty or extended periods of poverty during childhood are especially detrimental, increasing children’s chances of cognitive and behavioral problems and leading to adverse outcomes when they reach adulthood.
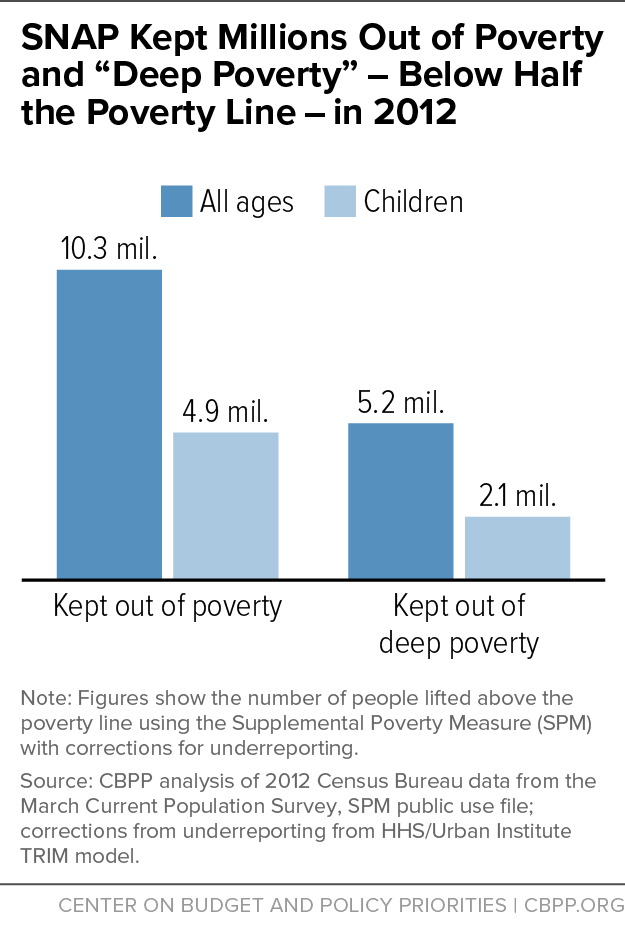
- SNAP lifts millions of households out of poverty. SNAP kept about 10.3 million people out of poverty in 2012, including about 4.9 million children, according to a CBPP analysis that uses the Supplemental Poverty Measure — which counts SNAP as income — and corrects for households’ underreporting of benefits. This analysis also found that SNAP lifted 2.1 million children out of deep poverty (defined as 50 percent of the poverty line) in 2012, more than any other government assistance program.[16] (See Figure 7.)
- SNAP also reduces the depth and severity of child poverty — measures of its success in targeting greater amounts of benefits to those in greatest need.[17] SNAP benefits reduced the child poverty rate by 6 percent, the depth of child poverty by 16 percent, and its severity by 22 percent in the average year from 2000 to 2011, researchers at USDA’s Economic Research Service have found.[18] The benefit increases included in the 2009 Recovery Act substantially increased SNAP’s anti-poverty effectiveness: in 2009, when that increase was in place, SNAP reduced the depth of child poverty by 21 percent and the severity of child poverty by 28 percent.[19]
-
Figure 7
SNAP is a powerful antidote to extreme poverty. The number of extremely poor families — those living on less than $2 per person a day — more than doubled between 1996 and 2011 and the number of extremely poor children doubled. However, counting SNAP benefits as income cuts the number of extremely poor households in 2011 by nearly half (from 1.6 million to 857,000) and, when combined with supports like housing assistance and refundable tax credits, cuts the number of extremely poor children by more than half (from 3.6 million to 1.2 million).[20] - SNAP responds to increased poverty during economic downturns. There’s evidence that children who fall into poverty during a recession fare worse on many outcomes — poverty status, earnings, educational achievement, and health — than their peers who avoid poverty, and that these differences persist in adulthood. In addition, economic hardship appears to have a profound impact on children, especially boys, in terms of greater risk of emotional and behavioral problems. [21] SNAP’s ability to quickly respond when unemployment and poverty rise may mitigate such long-term effects.
SNAP Reduces Food Insecurity Among Children
The development, health, and well‐being of children depend on access to a safe and secure source of food. Thus, it should be a matter of grave concern that 13 million children lived in families that had trouble putting enough food on the table at some time during 2015, even after accounting for SNAP and other food assistance programs.[22] While adults often protect the children in their households from the severest forms of food insecurity, in 2015 half a million children lived in families in which one or more children simply did not get enough to eat — having to cut the size of meals, skip meals, or even go whole days without food at some time during the year. Children without enough food face a host of adverse health and developmental outcomes including poorer overall health; cognitive, emotional, and behavioral problems; and lower academic performance.[23]
The causes of food insecurity among children are complicated and not fully understood. Income is clearly important, as the risk of food insecurity among children falls as their family income rises. But income alone is not enough to explain why some children in poor households are food insecure and others are not. Recent research has begun to highlight the importance of numerous factors other than income, including maternal health, residential instability, and family structure.[24]
Nevertheless, SNAP serves a vital role in improving the health and well-being of low-income children by helping their families afford adequate, nutritious food. Because SNAP enables low-income households to spend more on food than their limited budgets would otherwise allow, it helps raise the likelihood that they have enough to eat. Recent research demonstrates that SNAP participation leads to substantial reductions in food insecurity.
-
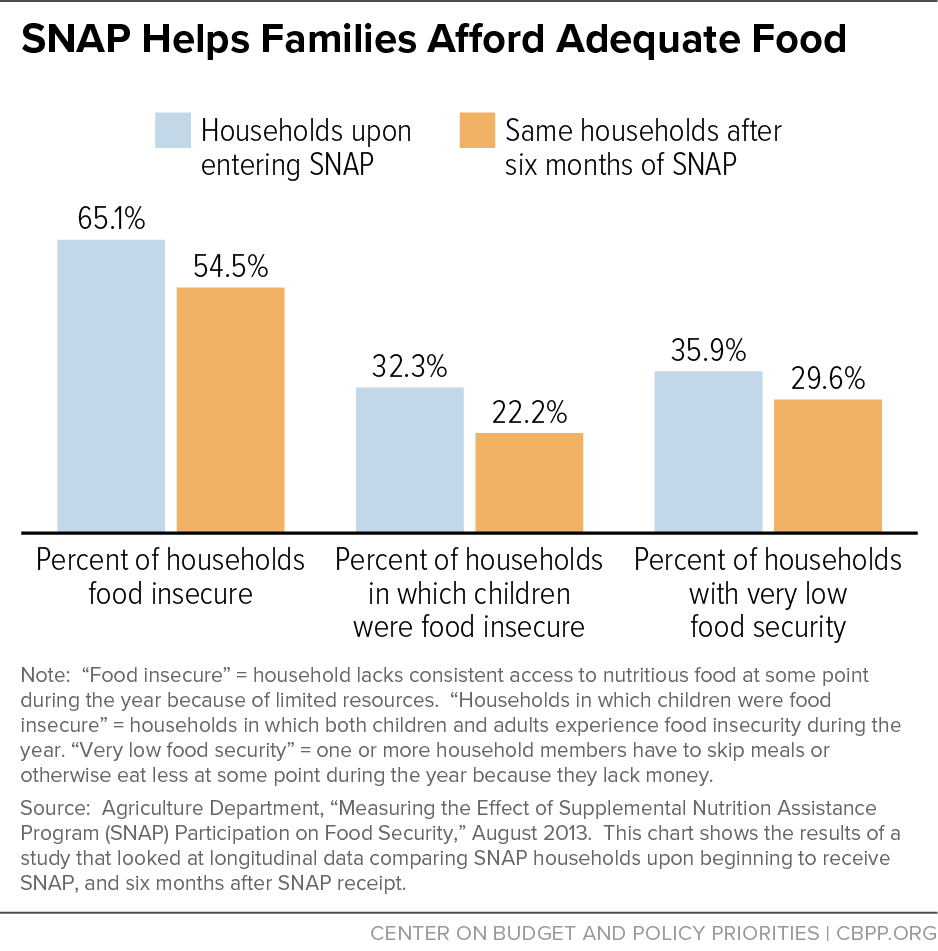
SNAP helps families put food on the table. The largest and most rigorous examination of the relationship between SNAP participation and food security found that food insecurity among children fell by roughly a third after their families received SNAP benefits for six months. (See Figure 8.) These findings are consistent with a longitudinal study that shows that participation in SNAP for at least four months reduces the probability of child food insecurity by about half, compared to the month before participation, when food insecurity levels are highest.[25]
Figure 8 Increasing SNAP benefits helps families afford adequate food. USDA recently completed a large-scale experiment to test the effects of providing families additional benefits during summer months when their children do not have access to free or reduced-price school meals using the existing SNAP electronic benefit transfer systems, with striking results: the additional benefits reduced the prevalence of very low food security among children by about one-third.[26]
Cutting SNAP benefits puts more children at risk of food insecurity. Food insecurity among children increased after the higher SNAP benefits made as part of the Recovery Act ended. Families with young children interviewed in health care settings (such as emergency rooms) were 17 percent more likely to be food insecure after the Recovery Act increase was eliminated compared to similar families during the period when the increase was in effect.[27]
Defining Food Insecurity Among Children
The U.S. Department of Agriculture (USDA) provides annual estimates of the extent of food insecurity — the lack of consistent access to adequate food — in the United States using U.S. Census Bureau data. USDA’s assessment of food security is based on the responses to a series of 18 questions about conditions and behaviors that typically occur in households when they have difficulty meeting their food needs (such as being unable to afford balanced meals, cutting the size of meals because there was too little money for food, or being hungry because there was too little money for food); eight of these questions inquire specifically about food-related conditions among children.
Households that report three or more indicators of food insecurity in response to any of the 18 questions are classified as food insecure. In many of these households, only adults are food insecure. Parents often find ways to maintain normal meal patterns for their children, even when the parents themselves are food insecure. Households that report two or more food-insecure conditions among children are classified as having food insecurity among children. In some households, food insecurity among children is so severe that caregivers report that children were hungry, skipped a meal, or did not eat for a whole day because there was not enough money for food. USDA describes these households as having very low food security among children. Households with very low food security among children all reported multiple indicators of reduced food intake.
USDA’s most recent statistics show that 12.7 percent of all American households (15.8 million households) were food insecure at times during 2015. Children were food insecure at times during the year in 7.8 percent of the households with children (3.0 million households), the lowest recorded percentage since 1998. Children experienced instances of very low food security in 0.7 percent of households with children (274,000 households) in 2015, reflecting the largest one-year improvement (from 1.1 percent in 2014) ever recorded.
Source: Alisha Coleman-Jensen, et al., “Household Food Security in the United States in 2015,” Economic Research Service, USDA, September 2016.
SNAP Improves Child Health
Adequate nutrition during infancy and early childhood is essential to the children’s growth, health, and development. The rapidly increasing size and function of the brain during the developmental window from birth to preschool demands consistently high levels of nutrition. Deficits in the growth of brain and body following nutritional deprivation or other hardships during this sensitive period, when the foundations of future health and cognitive development are largely determined, are difficult to remediate later in life. Children raised in households without enough affordable, nutritious food are more likely to suffer poor health, have inadequate intake of vitamins and minerals important for their health, face deficits in cognitive development, and exhibit behavioral and emotional problems.
SNAP increases the amount families spend on food. It also frees up resources that families can use to meet their health and other needs. In addition, SNAP’s nutrition education program (SNAP-Ed) supports nutrition education and obesity prevention programs that use evidence-based activities to promote healthy food choices within a limited budget.
- SNAP enables families to spend more on food. A substantial body of research concurs that participation in SNAP increases food spending. Relatively few studies have looked at how this increased spending affects children’s diets. The available evidence suggests that the diets of low-income children who participate and those who don’t are similar, but are somewhat less nutritious than those in higher-income families.[28] The diets of many children regardless of income, however, are far from meeting national dietary recommendations. Although not limited to families with children, recent research suggests that increasing SNAP benefits by $30 per person (per month) could increase food spending by about $19 and enable participants to purchase foods that are more nutritious and to spend more time on food shopping and preparation.[29] Providing additional resources for food also frees up income that families can use to pay rent, cover the cost of utilities, and purchase other necessities like personal care products, basic household supplies, and clothes.
- SNAP participation can improve birth outcomes. Researchers comparing the long-term outcomes of individuals in different areas of the country when SNAP (then food stamps) gradually expanded nationwide in the 1960s and early 1970s found that mothers exposed to SNAP during pregnancy gave birth to fewer low birth-weight babies. Prenatal exposure to SNAP may also have reduced infant mortality (though these results were not always statistically significant). Improvements were largest for the smallest babies, reducing the incidence of low birth weight among participants by 7 percent for whites and between 5 percent and 11 percent for blacks.[30]
- SNAP participation is associated with improvements in child health. Researchers at Children’s HealthWatch[31] have shown that children receiving SNAP are less likely than low-income non-participants to be in fair or poor health or underweight, and their families are less likely to make tradeoffs between paying for health care and paying for other basic needs, like food, housing, heating, and electricity.[32] Children who lose some or all of their SNAP benefits are more likely to have poor health, be food insecure, forgo medical care, or make health care tradeoffs than families who consistently receive SNAP benefits.[33] A recent study of immigrant children finds evidence that an additional year of SNAP eligibility in early life is associated with improvements in health outcomes — health status (as reported by the child’s parent), overnight hospitalizations, and number of doctor’s visits — between ages 6 and 16, providing evidence that participating in the program as a young child can impact later-life health as soon as school age.[34]
- SNAP participation may reduce childhood obesity. The potential effect of SNAP participation on obesity is ambiguous. Families could use the additional benefits provided by SNAP to simply increase the amount of food that they buy and eat, which could lead to increases in weight. Or they could use the additional benefits to make healthier food choices, which could lead to reductions in weight. [35] The research in this area is equally ambiguous, with many studies finding no evidence of a link between SNAP and obesity, some suggesting that SNAP participation might reduce the risk of childhood obesity, and others suggesting that it might increase those risks.[36] One study estimated upper and lower boundaries on the range of potential impacts of SNAP and concluded that SNAP appears to lead to at least modest health improvements — reducing poor general health by 3.1 percentage points, obesity by 5.3 percentage points, and anemia by 1.6 percentage points — and could dramatically improve the health of children in the United States.[37]
Children Who Receive SNAP Do Better In School
Access to an adequate, healthy diet during early childhood is essential to developing the skills crucial for school success including memory, emotional stability, and social skills. Food insecurity in those early years may have harmful effects long after the period of hardship is over: teens who had experienced food insecurity in infancy are more likely to score lower on achievement tests, repeat a grade, and fail to graduate from high school, for example.[38] Research suggests that SNAP participation can lead to improvements in reading and mathematics skills among elementary children, especially young girls, and increase the chances of graduating from high school by as much as 18 percentage points.[39]
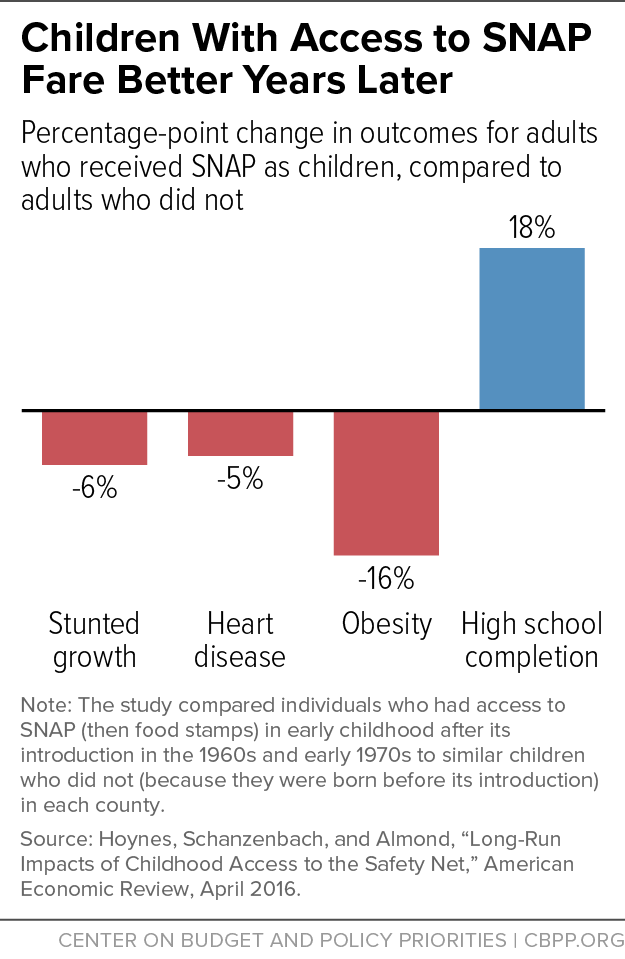
Early Access to SNAP Can Improve Long-Term Health and Economic Outcomes
Poor nutrition during childhood may harm health and earnings decades later by altering physical development and affecting the ability to learn. Researchers comparing the long-term outcomes of individuals in different areas of the country when SNAP expanded nationwide in the 1960s and early 1970s found that disadvantaged children who had access to food stamps in early childhood and whose mothers had access during their pregnancy had better health and economic outcomes as adults than children who didn’t have access to food stamps. (See Figure 9.) Adults who had access to food stamps as young children reported better health and had lower rates of “metabolic syndrome” (a combined measure of the incidence of obesity, high blood pressure, heart disease, and diabetes), and women who had access to food stamps as young children reported improved economic self-sufficiency (as measured by a combination of employment, income, poverty status, high school graduation, and program participation).[40]
SNAP Complements Other Child Nutrition Programs
SNAP is one of several programs in the nutrition safety net for children, which also includes the National School Lunch Program, the School Breakfast Program, the Special Supplemental Nutrition Program for Women, Infants, and Children (WIC), and the Child and Adult Care Food Program.
These programs are a mainstay of overall resources in families with children. During and immediately after the Great Recession, for example, nearly half (44 percent) of all school-aged children participated in SNAP, the National School Lunch Program, or the School Breakfast Program during any four-month period, and most of these participated in more than one. School children who participate in SNAP typically participate in the lunch and breakfast programs as well, but less than half of those who receive a free or reduced-price lunch participate in SNAP. Among low-income school-aged children, food assistance made up, on average, almost one-fifth (18 percent) of their total household resources, and over one-third among those who participated in all three programs. Food assistance is most critical for children living in deep poverty — those in families with income less than half the poverty line. Among these children, the full array of food assistance contributed over half (52 percent) of total household resources.[41]
The largest nutrition assistance programs have adopted rules to simplify the application process, streamline paperwork, and reduce administrative error by using determinations of eligibility for one program — typically SNAP — to confer eligibility for another. Adjunctive eligibility enables WIC applicants, for example, to be automatically income-eligible for WIC by participating in SNAP, TANF, or Medicaid. Similarly, through direct certification, school districts that participate in the school lunch program match the names of children living in households that receive benefits from SNAP, TANF, or the Food Distribution Program on Indian Reservations (FDPIR) with school enrollment records. Children who match are certified for free school meals without the need for their families to complete a school meals application. School districts are required to directly certify students living in households receiving SNAP benefits and are encouraged to do so for children receiving TANF or FDPIR benefits and for children in foster care.
Most recently, the community eligibility option gives school districts a powerful new tool that makes it easier for low-income children in high-poverty schools to get free school meals. The option allows schools that predominantly serve low-income children to offer nutritious meals to all students at no charge. Community eligibility schools have less paperwork to complete, which frees up resources to invest in improving meal quality and increases staff time for other educational priorities. Instead of collecting and processing individual meal applications for each family, schools are reimbursed through a formula based on their number of students directly certified for free meals.
The increasing connection between SNAP eligibility and enrollment for free school meals means that changes in SNAP policy or practice can have spillover effects, intended or not, on children in other programs. Policies that restrict SNAP eligibility, for example, may also reduce the number of low-income children certified for free school meals as more are forced to use more burdensome and error-prone paper applications. Such changes might also affect both a school district’s eligibility for community eligibility and the feasibility of implementing the option.
Conclusion
SNAP forms a critical foundation for the health and well-being of America’s children despite its modest benefit, lifting millions of families and their children out of poverty, improving food security, and contributing to better health and academic achievement with long-lasting consequences. Much of the program’s success is due to critical features that distinguish it from other safety net programs, including:
- eligibility rules and a funding structure that make benefits available to children in almost all families with little income and few resources;
- a consistent national structure that effectively targets food benefits to those with the greatest need;
- a design that automatically responds to changing economic conditions; and
- rigorous requirements on states and clients to ensure a high degree of program integrity.
Efforts to reform or enhance SNAP should build on its effectiveness in protecting the well-being of America’s children, and preserve the essential program features that contribute to that success.
| APPENDIX TABLE 1 | |||||
|---|---|---|---|---|---|
| Number of Children Receiving SNAP as a Share of the Population, by State and Age, 2014 | |||||
| Pre-School | Elementary | Middle/High School | |||
| State | SNAP Children | Share of State's Children Receiving SNAP a | Share of State Children, 0-4, on SNAP | Share of State Children, 5-11, on SNAP | Share of State Children, 12-17, on SNAP |
| Alabama | 395,500 | 36% | 40% | 38% | 30% |
| Alaska | 38,300 | 21% | 22% | 22% | 18% |
| Arizona | 498,200 | 31% | 34% | 34% | 24% |
| Arkansas | 216,900 | 31% | 36% | 33% | 24% |
| California | 2,280,200 | 25% | 30% | 27% | 18% |
| Colorado | 245,100 | 20% | 23% | 20% | 17% |
| Connecticut | 152,200 | 20% | 25% | 23% | 13% |
| Delaware | 65,600 | 32% | 38% | 37% | 22% |
| District of Columbia | 51,200 | 44% | 44% | 50% | 39% |
| Florida | 1,385,300 | 34% | 40% | 38% | 25% |
| Georgia | 811,000 | 33% | 45% | 32% | 23% |
| Hawaii | 76,800 | 25% | 28% | 27% | 19% |
| Idaho | 102,000 | 24% | 30% | 27% | 16% |
| Illinois | 842,300 | 28% | 33% | 30% | 23% |
| Indiana | 397,900 | 25% | 29% | 28% | 19% |
| Iowa | 181,200 | 25% | 29% | 27% | 19% |
| Kansas | 136,700 | 19% | 21% | 22% | 14% |
| Kentucky | 318,300 | 31% | 34% | 34% | 26% |
| Louisiana | 411,400 | 37% | 41% | 40% | 30% |
| Maine | 76,100 | 29% | 36% | 33% | 21% |
| Maryland | 316,400 | 23% | 27% | 25% | 19% |
| Massachusetts | 304,500 | 22% | 23% | 23% | 20% |
| Michigan | 631,700 | 28% | 30% | 32% | 24% |
| Minnesota | 230,600 | 18% | 21% | 19% | 14% |
| Mississippi | 292,100 | 40% | 43% | 43% | 33% |
| Missouri | 363,300 | 26% | 28% | 30% | 20% |
| Montana | 48,700 | 22% | 28% | 22% | 16% |
| Nebraska | 83,800 | 18% | 20% | 20% | 13% |
| Nevada | 166,500 | 25% | 28% | 27% | 20% |
| New Hampshire | 44,700 | 17% | 23% | 18% | 11% |
| New Jersey | 388,300 | 19% | 21% | 22% | 15% |
| New Mexico | 196,300 | 39% | 46% | 42% | 30% |
| New York | 1,181,100 | 28% | 32% | 30% | 22% |
| North Carolina | 663,100 | 29% | 34% | 32% | 21% |
| North Dakota | 23,700 | 14% | 17% | 16% | 8% |
| Ohio | 741,200 | 28% | 36% | 30% | 20% |
| Oklahoma | 262,300 | 27% | 28% | 30% | 23% |
| Oregon | 272,600 | 32% | 38% | 33% | 25% |
| Pennsylvania | 683,900 | 25% | 30% | 27% | 20% |
| Rhode Island | 63,700 | 30% | 34% | 32% | 25% |
| South Carolina | 378,900 | 35% | 37% | 35% | 33% |
| South Dakota | 46,100 | 22% | 26% | 24% | 15% |
| Tennessee | 546,400 | 37% | 41% | 42% | 27% |
| Texas | 2,152,300 | 30% | 35% | 33% | 22% |
| Utah | 118,300 | 13% | 14% | 14% | 10% |
| Vermont | 31,700 | 26% | 38% | 26% | 18% |
| Virginia | 397,600 | 21% | 25% | 24% | 15% |
| Washington | 432,400 | 27% | 32% | 29% | 20% |
| West Virginia | 127,500 | 34% | 41% | 35% | 26% |
| Wisconsin | 338,600 | 26% | 29% | 28% | 21% |
| Wyoming | 17,900 | 13% | 15% | 15% | 9% |
| Guam | 27,100 | - | - | - | - |
| Virgin Islands | 12,900 | - | - | - | - |
| United States excluding Guam and Virgin Islandsb | 20,231,000 | 27% | 32% | 30% | 21% |
| APPENDIX TABLE 2 | ||||
|---|---|---|---|---|
| Number of SNAP Children by State and Age, 2014 | ||||
| State | Number of SNAP Children | Share of SNAP Children, age 0-4 | Share of SNAP Children, age 5-11 | Share of SNAP Children, age 12-17 |
| Alabama | 395,500 | 30% | 41% | 29% |
| Alaska | 38,300 | 31% | 41% | 27% |
| Arizona | 498,200 | 29% | 44% | 27% |
| Arkansas | 216,900 | 32% | 42% | 27% |
| California | 2,280,200 | 33% | 42% | 25% |
| Colorado | 245,100 | 31% | 40% | 29% |
| Connecticut | 152,200 | 31% | 45% | 24% |
| Delaware | 65,600 | 32% | 45% | 23% |
| District of Columbia | 51,200 | 36% | 40% | 23% |
| Florida | 1,385,300 | 32% | 43% | 26% |
| Georgia | 811,000 | 36% | 39% | 24% |
| Hawaii | 76,800 | 34% | 42% | 24% |
| Idaho | 102,000 | 33% | 45% | 22% |
| Illinois | 842,300 | 31% | 42% | 28% |
| Indiana | 397,900 | 31% | 44% | 26% |
| Iowa | 181,200 | 32% | 42% | 26% |
| Kansas | 136,700 | 30% | 45% | 25% |
| Kentucky | 318,300 | 30% | 42% | 28% |
| Louisiana | 411,400 | 31% | 42% | 27% |
| Maine | 76,100 | 31% | 44% | 25% |
| Maryland | 316,400 | 31% | 41% | 28% |
| Massachusetts | 304,500 | 27% | 41% | 32% |
| Michigan | 631,700 | 27% | 43% | 30% |
| Minnesota | 230,600 | 32% | 41% | 27% |
| Mississippi | 292,100 | 29% | 43% | 28% |
| Missouri | 363,300 | 29% | 45% | 26% |
| Montana | 48,700 | 35% | 39% | 25% |
| Nebraska | 83,800 | 31% | 45% | 24% |
| Nevada | 166,500 | 30% | 43% | 27% |
| New Hampshire | 44,700 | 34% | 42% | 25% |
| New Jersey | 388,300 | 29% | 45% | 26% |
| New Mexico | 196,300 | 32% | 43% | 26% |
| New York | 1,181,100 | 32% | 41% | 27% |
| North Carolina | 663,100 | 31% | 44% | 25% |
| North Dakota | 23,700 | 37% | 45% | 17% |
| Ohio | 741,200 | 33% | 42% | 25% |
| Oklahoma | 262,300 | 29% | 43% | 28% |
| Oregon | 272,600 | 32% | 40% | 27% |
| Pennsylvania | 683,900 | 31% | 41% | 28% |
| Rhode Island | 63,700 | 29% | 41% | 29% |
| South Carolina | 378,900 | 29% | 40% | 32% |
| South Dakota | 46,100 | 35% | 44% | 21% |
| Tennessee | 546,400 | 30% | 45% | 25% |
| Texas | 2,152,300 | 32% | 44% | 24% |
| Utah | 118,300 | 31% | 44% | 25% |
| Vermont | 31,700 | 37% | 39% | 25% |
| Virginia | 397,600 | 32% | 44% | 24% |
| Washington | 432,400 | 33% | 42% | 25% |
| West Virginia | 127,500 | 33% | 40% | 27% |
| Wisconsin | 338,600 | 30% | 43% | 27% |
| Wyoming | 17,900 | 33% | 45% | 22% |
| Guam | 27,100 | 34% | 39% | 27% |
| Virgin Islands | 12,900 | 35% | 35% | 30% |
| United States a | 20,271,000 | 31% | 42% | 26% |
| APPENDIX TABLE 3 | ||||
|---|---|---|---|---|
| Average Monthly SNAP Benefits by State and Household Gross Income as a Share of Poverty, 2014 | ||||
| State | All Households with Children | SNAP Households with Children with Gross Incomes Under 50% of Poverty | SNAP Households with Children with Gross Incomes Between 50-100% of Poverty | SNAP Households with Children with Gross Incomes Over 100% of Poverty |
| Alabama | $400 | $494 | $328 | $164 |
| Alaska | $658 | $796 | $615 | $259 |
| Arizona | $399 | $519 | $377 | $167 |
| Arkansas | $389 | $502 | $329 | $153 |
| California | $392 | $440 | $359 | $169 |
| Colorado | $402 | $484 | $369 | $214 |
| Connecticut | $363 | $468 | $399 | $170 |
| Delaware | $369 | $490 | $371 | $139 |
| District of Columbia | $378 | $472 | $279 | $102 |
| Florida | $379 | $500 | $347 | $172 |
| Georgia | $422 | $507 | $362 | $177 |
| Hawaii | $722 | $834 | $706 | $497 |
| Idaho | $394 | $517 | $363 | $205 |
| Illinois | $424 | $507 | $367 | $173 |
| Indiana | $400 | $495 | $344 | $185 |
| Iowa | $359 | $509 | $339 | $124 |
| Kansas | $397 | $522 | $352 | $170 |
| Kentucky | $383 | $486 | $319 | $144 |
| Louisiana | $406 | $509 | $353 | $148 |
| Maine | $350 | $497 | $350 | $173 |
| Maryland | $365 | $471 | $349 | $188 |
| Massachusetts | $335 | $455 | $359 | $152 |
| Michigan | $394 | $505 | $385 | $170 |
| Minnesota | $350 | $453 | $362 | $160 |
| Mississippi | $396 | $500 | $303 | $159 |
| Missouri | $421 | $532 | $342 | $198 |
| Montana | $400 | $519 | $358 | $173 |
| Nebraska | $397 | $501 | $384 | $177 |
| Nevada | $374 | $495 | $342 | $134 |
| New Hampshire | $321 | $486 | $343 | $164 |
| New Jersey | $359 | $468 | $340 | $191 |
| New Mexico | $398 | $498 | $353 | $178 |
| New York | $402 | $490 | $393 | $221 |
| North Carolina | $400 | $496 | $356 | $116 |
| North Dakota | $382 | $500 | $378 | $168 |
| Ohio | $403 | $500 | $362 | $156 |
| Oklahoma | $410 | $516 | $325 | $164 |
| Oregon | $337 | $444 | $372 | $155 |
| Pennsylvania | $379 | $498 | $372 | $162 |
| Rhode Island | $352 | $468 | $366 | $172 |
| South Carolina | $399 | $483 | $329 | $152 |
| South Dakota | $416 | $529 | $393 | $197 |
| Tennessee | $411 | $497 | $352 | $168 |
| Texas | $372 | $486 | $334 | $181 |
| Utah | $417 | $532 | $374 | $201 |
| Vermont | $342 | $475 | $379 | $207 |
| Virginia | $371 | $465 | $329 | $171 |
| Washington | $351 | $520 | $334 | $157 |
| West Virginia | $369 | $488 | $306 | $126 |
| Wisconsin | $352 | $490 | $382 | $144 |
| Wyoming | $391 | $484 | $360 | $217 |
| Guam | $729 | $853 | $722 | $441 |
| Virgin Islands | $501 | $639 | $434 | $239 |
| United States | $390 | $489 | $357 | $172 |
| APPENDIX TABLE 4 | |||
|---|---|---|---|
| Selected Characteristics of Children Receiving SNAP, 2014 | |||
| Number of Children Receiving SNAP | Share of all Children Receiving SNAP a | Share Among Those Who Reported b | |
| Total Children, Age 0-17, Receiving SNAP | 20,271,000 | 100% | |
| Age | |||
| Under 5 | 6,368,800 | 31% | |
| 5 to 11 | 8,597,000 | 42% | |
| 12 to 17 | 5,305,200 | 26% | |
| Race/Ethnicity | |||
| White, not Hispanic | 6,207,100 | 31% | 37% |
| African American, not Hispanic | 4,910,300 | 24% | 30% |
| Hispanic, any race | 4,318,800 | 21% | 26% |
| Asian, not Hispanic | 381,800 | 2% | 2% |
| Native- American, not Hispanic | 193,400 | 1% | 1% |
| Hawaiian/Pacific Islander | 104,300 | 1% | 1% |
| Multiple races reported, not Hispanic | 516,000 | 3% | 3% |
| Disability Status | |||
| Children without disabilities | 19,265,300 | 95% | |
| In household with no members with a disability | 17,244,700 | 85% | |
| In household with someone with a disability | 2,020,600 | 10% | |
| Children with disabilities | 1,005,700 | 5% | |
| Household Composition c | |||
| Children living with one adult | 12,233,900 | 60% | |
| Children living with multiple adults | 8,007,700 | 40% | |
| Married adults | 5,503,700 | 27% | |
| Other multiple-adult household | 2,504,000 | 12% | |
| Children living with no adults or where the household composition is unclear | 29,400 | 0.1% | |
| Citizenship Status c | |||
| Citizen children | 19,925,700 | 98% | |
| Citizen children living with only citizen adults | 15,763,300 | 78% | |
| Citizen children living with at least one non-citizen | 4,133,400 | 20% | |
| Citizen children living with no adults or with adults of unknown immigration status | 28,900 | 0.1% | |
| Non-citizen children (refugees, legal permanent residents, and other eligible non-citizens) | 345,300 | 2% | |
| Metro Status d | |||
| Suburban | 4,945,500 | 35% | 41% |
| Urban | 4,846,000 | 34% | 40% |
| Rural | 2,344,900 | 17% | 19% |
| Unknown | 1,992,400 | 14% | |
End Notes
[1] Steven Carlson is a research analyst who previously directed the Office of Policy Support at the Agriculture Department’s Food and Nutrition Service. The opinions and conclusions expressed in this report are solely those of the authors and should not be construed as representing the views of the Agriculture Department.
[2] The number of children projected to be served in 2016 and value of SNAP benefits provided to children are estimated by multiplying the Congressional Budget Office’s baseline estimates of total SNAP participation in 2016 (44.5 million) and total SNAP benefits ($67.7 billion) by the share of children among SNAP participants and the pro-rated share of benefits for children in 2014, the most current data available (both about 44 percent). See https://www.cbo.gov/sites/default/files/51312-2016-03-SNAP1.pdf for CBO estimates. In total, households with children received about 67 percent of SNAP benefits in 2014, which would equal about $45 billion in 2016.
[3] See, for example, Jeanne Brooks-Gunn, and Greg Duncan, “The Effects of Poverty on Children,” The Future of Children, 7(2), 1997, www.princeton.edu/futureofchildren/publications/docs/07_02_03.pdf.
[4] John T. Cook and Deborah A. Frank, “Food Security, Poverty, and Human Development in the United States,” Annals of the New York Academy of Sciences, 1136(1), 193-209, 2008, http://onlinelibrary.wiley.com/doi/10.1196/annals.1425.001/epdf.
[5] Center on the Developing Child at Harvard University (2016), “From Best Practice to Breakthrough Impacts,” May 2016, http://46y5eh11fhgw3ve3ytpwxt9r.wpengine.netdna-cdn.com/wp-content/uploads/2016/05/HCDC_From_Best_Practices_to_Breakthrough_Impacts.pdf.
[6] See, for example, Patricia Anderson, Kristin Butcher, and Diane Schanzenbach, “Changes in Safety Net Use During the Great Recession,” American Economic Review: Papers & Proceedings, 105(5): 161–165, 2015, http://www.sesp.northwestern.edu/docs/publications/1064188605560bfd3a080d6.pdf. These researchers focus on SNAP, the Earned Income Tax Credit, Unemployment Insurance, and cash welfare from the Temporary Assistance for Needy Families (TANF) program and conclude that “for households below the poverty line, SNAP benefits dominate the other programs.” Although the analysis does not focus specifically on families with children, its conclusions are relevant since nearly half of all SNAP households include children and two-thirds of all participants live in families with children.
[7] The poverty and food security statistics reported in this paper refer to calendar years; all other SNAP statistics refer to fiscal years unless otherwise noted. See Kelsey Farson Gray and Shivani Kochhar, “Characteristics of Supplemental Nutrition Assistance Program Households: Fiscal Year 2014,” prepared for the Food and Nutrition Service, USDA, December 2015, www.fns.usda.gov/snap/characteristics-supplemental-nutrition-assistance-program-households-fiscal-year-2014.
[8] Bernadette D. Proctor, Jessica L. Semega, and Melissa A. Kollar, “Income and Poverty in the United States: 2015,” U.S. Census Bureau, September 2016, http://www.census.gov/library/publications/2016/demo/p60-256.html; and Alisha Coleman-Jensen et al., “Household Food Security in the United States in 2015,” Economic Research Service, USDA, September 2016, http://www.ers.usda.gov/publications/err-economic-research-report/err215.aspx.
[9] Esa Eslami, “Trends in Supplemental Nutrition Assistance Program Participation Rates: Fiscal Year 2010 to Fiscal Year 2014,” prepared for the Food and Nutrition Service, USDA, June 2016, http://www.fns.usda.gov/snap/trends-supplemental-nutrition-assistance-program-participation-rates-fiscal-year-2010-fiscal-year. Because of the challenges of combining multiple data sources to simulate program eligibility and participation, estimates of participation rates among eligible children can exceed 100 percent. While it is unlikely that the program reaches every eligible child every month, it is fair to conclude that participation among eligible children is very high.
[10] These figures reflect the fact that households with non-citizen members are more likely to be low-income than other U.S. households. More than one in four low-income children live with a non-citizen, according to Census Bureau data. All undocumented immigrants and many legal immigrant adults are ineligible for SNAP.
[11] Kelsey Farson Gray and Shivani Kochhar, “Characteristics of Supplemental Nutrition Assistance Program Households: Fiscal Year 2014,” prepared for the Food and Nutrition Service, USDA, December 2015, table A.2, www.fns.usda.gov/characteristics-supplemental-nutrition-assistance-program-households-fiscal-year-2014.
[12] Dorothy Rosenbaum, “The Relationship between SNAP and Work Among Low-Income Households,” Center on Budget and Policy Priorities,” January 2013, https://www.cbpp.org/sites/default/files/atoms/files/1-29-13fa.pdf. The figures are based on data from the Survey of Income and Program Participation (SIPP) for the mid-2000s, before the recent recession, but preliminary analysis finds that they declined only modestly during the recession. For this analysis SNAP household members are considered to be working-age if they are age 18 through 59 and are disabled if they receive a disability-based benefit, such as Social Security Disability Insurance or Supplemental Security Income (SSI).
[13] U.S. Department of Health and Human Services, Office of the Assistant Secretary for Planning and Evaluation, “Welfare Indicators and Risk Factors: Fourteenth Report to Congress,” September 22, 2015, https://aspe.hhs.gov/sites/default/files/pdf/116161/FINAL%20Fourteenth%20Report%20-%20FINAL%209%2022%2015.pdf.
[14] SNAP’s disability definition is stringent; a person must be receiving a benefit such as Social Security Disability Insurance benefits, SSI, or veterans’ benefits based on total disability to be considered disabled. As a result, these figures likely understate the degree that SNAP children and their family members experience a disability; some may have less severe disabilities while others may not yet have received a disability determination from another program.
[15] Joshua Leftin, et al., “Dynamics of Supplemental Nutrition Assistance Program Participation from 2008 to 2012,” prepared for the Food and Nutrition Service, USDA, December 2014, www.fns.usda.gov/sites/default/files/ops/Dynamics2008-2012.pdf.
[16] Arloc Sherman and Danilo Trisi, “Safety Net More Effective Against Poverty than Previously Thought,” Center on Budget and Policy Priorities, May 6, 2015, www.cbpp.org/research/poverty-and-inequality/safety-net-more-effective-against-poverty-than-previously-thought. Figures for 2012 include the Recovery Act’s temporary SNAP benefit increase which has since ended; current figures may be lower. More recent data from the Census Bureau, also based on the Supplemental Poverty Measure but without the correction for underreporting of benefits, affirms the continued anti-poverty effectiveness of SNAP. These data show that SNAP benefits lifted at least 2.1 million children out of poverty, and more than 1.3 million children above half of the poverty line, in 2014. See Kathleen Short, “Current Population Reports: The Supplemental Poverty Measure: 2014.” U.S. Census Bureau, September 2015, www.census.gov/content/dam/Census/library/publications/2015/demo/p60-254.pdf. Although the estimated impacts in 2014 are less than those in 2012, it would be incorrect to conclude that SNAP was less effective in reducing poverty among children. The difference instead illustrates how important it is to correct for underreported benefits: the uncorrected estimates miss billions of dollars from government benefit programs and substantially understate the safety net’s anti-poverty effectiveness.
[17] The standard measure of poverty — the poverty rate — is simply the proportion of persons living in poverty. Additional measures of the depth and severity of poverty provide a more complete picture of SNAP’s importance for the well-being of low-income families by capturing increases in income among the poor even if the increases are not large enough to lift them out of poverty. Depth of poverty is the difference between a family’s income and the poverty line; the measure of severity is similar but gives more emphasis to families with the lowest incomes, under the logic that they are the highest priority for poverty reduction.
[18] Laura Tiehen, Dean Jolliffe, and Timothy Smeeding, “The Effect of SNAP on Poverty” in Judith Bartfeld, Craig Gundersen, Timothy Smeeding and James Ziliak (eds.), SNAP Matters: How Food Stamps Affect Health and Well-Being, Stanford, CA: Stanford University Press, 2016. Depth of poverty is measured by the poverty gap, the average distance between a family’s income and the poverty threshold, where the average is formed over the entire population (so that the non-poor are counted as having zero poverty gap). Severity of poverty is measured as the average of the squared poverty gaps.
[19] Laura Tiehen, Dean Jolliffe, and Craig Gundersen, “Alleviating Poverty in the United States: The Critical Role of SNAP Benefits,” Economic Research Service, USDA, April 2012, www.ers.usda.gov/media/478608/err132_1_.pdf.
[20] Luke Shaefer and Kathryn Edin, “Rising Extreme Poverty in the United States and the Response of Federal Means-Tested Transfer Programs,” Social Service Review, 87(2): 250-268, 2013.
[21] Michael Linden, “Turning Point: The Long Term Effects of Recession-Induced Child Poverty,” First Focus, May 2009, https://firstfocus.org/resources/report/turning-point-long-term-effects-recession-induced-child-poverty/ and William Schneider, Jane Waldfogel, and Jeanne Brooks-Gunn, “The Great Recession and Behavior Problems in 9-Year Old Children,” Developmental Psychology, 51(11): 1615-1629, November 2015.
[22] The most current data available on children’s food security are presented in Alisha Coleman-Jensen, Matthew Rabbitt, Christian Gregory, and Anita Singh, “Household Food Security in the United States in 2015,” Economic Research Service, USDA, September 2016, http://www.ers.usda.gov/publications/err-economic-research-report/err215.aspx.
[23] See Alisha Coleman-Jensen, William McFall, and Mark Nord, “Food Insecurity in Households with Children: Prevalence, Severity, and Household Characteristics, 2010–11,” Economic Research Service, USDA, 2013, http://www.ers.usda.gov/publications/eib-economic-information-bulletin/eib113.aspx for a comprehensive catalog of the substantial and growing body of research on the associations between children’s health, development, and well-being and measures of food security.
[24] For a more complete summary of this emerging research see Craig Gundersen, and James P. Ziliak, “Childhood Food Insecurity in the US: Trends, Causes, and Policy Options,” The Future of Children 24(2), 2014, www.aap-oc.org/wp-content/uploads/large-files/Food%20Insecurity%20Research%20Report%20Fall%202014.pdf. This study finds that children living with a disabled adult, for example, are almost three times as likely to experience very low food security as children who don’t; the risk of food insecurity among children rises by at least 50 percent when mothers are moderately to severely depressed; and the children at most risk of very low food security are disproportionately raised in immigrant families.
[25] James Mabli and Julie Worthington, “Supplemental Nutrition Assistance Program Participation and Child Food Security,” Pediatrics, 133(4), 2014, pediatrics.aappublications.org/content/early/2014/02/25/peds.2013-2823.abstract and Yiran Li, et al., “Child Food Insecurity and the Food Stamp Program: What a Difference Monthly Data Make,” Social Services Review, 88(2), 2014, uknowledge.uky.edu/cgi/viewcontent.cgi?article=1021&context=ukcpr_papers.
[26] The demonstration initially provided a monthly benefit of $60 in the summer of 2012 and then compared the relative effectiveness of a smaller benefit ($30) in the summers of 2013 and 2014. The results suggested that both increases produced similar improvement in the most severe form of food insecurity among children. The study also tested delivering SNAP benefits or benefits through the Special Supplemental Nutrition Program for Women, Infants, and Children (WIC). In each group, and for the combined two groups, the $60 benefit reduced the prevalence of very low food security among children by about one-third, and there was not a statistically significant difference in the reduction of food insecurity or very low food security among children between the SNAP and WIC groups. See Ann Collins, et al., “Summer Electronic Benefits Transfer for Children (SEBTC) Demonstration: Summary Report,” prepared for the Food and Nutrition Service, USDA, May 2016, www.fns.usda.gov/sites/default/files/ops/sebtcfinalreport.pdf.
[27] Stephanie Ettinger de Cuba, et al., “Diluting the Dose: Cuts to SNAP Benefits Increased Food Insecurity Following the Great Recession,” Children’s HealthWatch, September 2015, www.childrenshealthwatch.org/wp-content/uploads/FINAL-Diluting-the-Dose-for-web-.pdf. The findings of this study are consistent with another study that found that the number of SNAP households with very low food security increased by 16.5 percent between 2009 and 2011, when the real value of the temporary benefit increase declined due to food price inflation. See Mark Nord, “Effects of the Decline in the Real Value of SNAP Benefits From 2009 to 2011,” USDA Economic Research Service Report Number 151, August 2013, http://www.ers.usda.gov/media/1155211/err151.pdf
[28] Tatiana Andreyeva, Amanda S. Tripp, and Marlene B. Schwartz, “Dietary Quality of Americans by Supplemental Nutrition Assistance Program Participation Status: A Systematic Review,” American Journal of Preventive Medicine, 49(4), 2015, www.uconnruddcenter.org/files/Pdfs/1-s2_0-S0749379715002263-main.pdf.
[29] Patricia M. Anderson and Kristin F. Butcher, “The Relationships Among SNAP Benefits, Grocery Spending, Diet Quality, and the Adequacy of Low-Income Families’ Resources,” Center on Budget and Policy Priorities, June 14, 2016, www.cbpp.org/sites/default/files/atoms/files/6-14-16fa.pdf.
[30] Douglas Almond, Hillary Hoynes, and Diane Schanzenbach, “Inside the War on Poverty: The Impact of Food Stamps on Birth Outcomes,” The Review of Economics and Statistics, 93(2), 2011, www.mitpressjournals.org/doi/pdfplus/10.1162/REST_a_00089. It is important to note that much has changed since the initial introduction of the Food Stamp Program, including the introduction and growth of the Special Supplemental Nutrition Program for Women, Infants, and Children (WIC) and Medicaid. A similar study using the county rollout in California also found that the introduction of food stamps was associated with a reduction in birth weight, which was driven particularly by first births among teens and by changes for Los Angeles County. See Janet Currie and Enrico Moretti, “Did the Introduction of Food Stamps Affect Birth Outcomes in California?” in Harold Pollack, Making Americans Healthier: Social and Economic Policy as Health Policy, Russell Sage Foundation, 2008, www.princeton.edu/~jcurrie/publications/RS_foodstamps.pdf.
[31] Children’s HealthWatch is a nonpartisan network of pediatricians, public health researchers, and children’s health and policy experts that has collected data on more than 42,000 infants and toddlers from families facing economic hardship. These researchers survey the caregivers of children under four visiting emergency departments and clinics at hospitals in five cities: Baltimore, Little Rock, Boston, Philadelphia, and Minneapolis. The survey is supplemented with detailed medical and sociodemographic data from administrative records.
[32] Katherine M. Joyce, et al., “Household Hardships, Public Programs, and Their Associations with the Health and Development of Very Young Children: Insights from Children’s HealthWatch,” Journal of Applied Research on Children: Informing Policy for Children at Risk, 3(1), 2012, www.childrenshealthwatch.org/wp-content/uploads/KJ_JARC_2012.pdf and Stephanie Ettinger de Cuba, et al., “The SNAP Vaccine: Boosting Children’s Health,” Children’s HealthWatch, February 2012, www.childrenshealthwatch.org/publication/the-snap-vaccine-boosting-childrens-health-2/.
[33] See, for example, Allison Bovell, et al., “Making SNAP Work for Families Leaving Poverty,” Children’s HealthWatch, November 2014, www.childrenshealthwatch.org/wp-content/uploads/FINALPhilly-Food-to-web3.pdf and Stephanie Ettinger de Cuba, et al., “Punishing Hard Work: The Unintended Consequences of Cutting SNAP Benefits,” Children’s HealthWatch, December 2013, www.childrenshealthwatch.org/publication/punishing-hard-work-unintended-consequences-cutting-snap-benefits/.
[34] Chloe East, “The Effect of Food Stamps on Children's Health: Evidence from Immigrants’ Changing Eligibility,” March 2016, http://cneast.weebly.com/uploads/8/9/9/7/8997263/east_jmp.pdf. While immigrants are a select and relatively more disadvantaged group of SNAP participants, children of immigrants account for about a quarter of all children and one-third of children in poverty. Welfare reform eliminated SNAP eligibility for most immigrant families in 1996, but subsequent federal legislation gradually restored eligibility between 1998 and 2003. These changes in eligibility allow for a relatively strong test of the impact of SNAP on children's health.
[35] Alternatively, body weight may influence the decision to participate in SNAP. Although this possibility has not yet been tested among children, a recent study of adult women found a strong and statistically significant relationship between obesity and the propensity to participate in SNAP. Joanna P. McEwan, Aaron Smith, and Julian M. Alston, “The Supplemental Nutrition Assistance Program, Energy Balance, and Weight Gain,” Food Policy, 61, 103–120, 2016, www.researchgate.net/publication/297698608_The_Supplemental_Nutrition_Assistance_Program_energy_balance_and_weight_gain.
[36] For example, one study concluded that SNAP participation is associated with an increase in obesity among young girls, a reduction among young boys, and has no effect on older children (see Diane Gibson, “Long-Term Food Stamp Program Participation Is Differentially Related to Overweight in Young Girls and Boys,” The Journal of Nutrition, 134(2), 2004, jn.nutrition.org/content/134/2/372.full). Another concluded that SNAP is associated with decreases in obesity among most children (see Maximilian Schmeiser, “The Impact of Long‐Term Participation in the Supplemental Nutrition Assistance Program on Child Obesity,” Health Economics, 21(4), 2012, 386-404). A third analysis found no evidence of a consistent relationship between childhood obesity and participation in SNAP (see Michele Ver Ploeg, et al., “US Food Assistance Programs and Trends in Children’s Weight,” International Journal of Pediatric Obesity, 3(1), 2008, 22-30). And finally, a recent study cautions that the effect of participating in more than one food assistance program may be greater than the sum of the individual programs and estimates that simultaneous participation in SNAP, school lunch, and school breakfast reduces adolescent BMI by nearly 12 percent (see Manan Roy, Daniel L. Millimet, and Rusty Tchernis, “Federal Nutrition Programs and Childhood Obesity: Inside the Black Box,” Review of Economics of the Household, 10(1), 2012: 1-38, www.econstor.eu/bitstream/10419/51971/1/668768452.pdf).
[37] Brent Kreider, et al., “Identifying the Effects of SNAP (Food Stamps) on Child Health Outcomes When Participation Is Endogenous and Misreported,” Journal of the American Statistical Association, 107(499), 2012: 958-975, http://batten.virginia.edu/sites/default/files/research/attachments/JASA_KPGJ_online(1).pdf.
[38] For a brief summary of the underlying research, see Meredith Hickson et al., “Too Hungry to Learn: Food Insecurity and School Readiness” and “Feeding Our Human Capital: Food Insecurity and Tomorrow’s Workforce,” Children’s HealthWatch, September 2013, www.childrenshealthwatch.org/publication/too-hungry-to-learn/ and www.childrenshealthwatch.org/publication/feeding-our-human-capital-food-insecurity-and-tomorrows-workforce/.
[39] Edward Frongillo, Diana F. Jyoti, and Sonya J. Jones, “Food Stamp Program Participation is Associated with Better Academic Learning among School Children,” Journal of Nutrition, 136(4): 2006, 1077-80, http://jn.nutrition.org/content/136/4/1077.full and Hilary Hoynes, Diane Whitmore Schanzenbach, and Douglas Almond, “Long-Run Impacts of Childhood Access to the Safety Net,” American Economic Review, 106(4): 2016, 903–934. There is also some limited evidence that the time elapsed since the issuance of SNAP benefits within a month can also affect test scores (see Anna Gassman-Pines, and Laura Bellows, “SNAP Recency and Educational Outcomes,” 2015, papers.ssrn.com/sol3/papers.cfm?abstract_id=2701380).
[40] Hilary Hoynes, Diane Whitmore Schanzenbach, and Douglas Almond, “Long-Run Impacts of Childhood Access to the Safety Net,” American Economic Review, 106(4): 2016, 903–934.
[41] Judith Bartfeld, “SNAP and the School Meal Programs,” in Judith Bartfeld, Craig Gundersen, Timothy Smeeding, and James Ziliak (eds.), SNAP Matters: How Food Stamps Affect Health and Well-Being, Stanford, CA: Stanford University Press, 2016.
More from the Authors

Steven Carlson is a research analyst who previously directed the Office of Policy Support at the Agriculture Department’s Food and Nutrition Service.

Areas of Expertise

Areas of Expertise