Most Working-Age SNAP Participants Work, But Often in Unstable Jobs
SNAP helps workers, both to supplement low wages and support them when they are between jobs. SNAP (formerly known as the Food Stamp Program) helps millions of Americans put food on the table each month. While two-thirds of participants are children, elderly, and people with disabilities, who are not expected to work, SNAP also helps workers, both to supplement low wages and support them when they are between jobs.
Millions of workers are in jobs that provide low pay, can have shifting schedules, and often lack key benefits such as paid sick leave. These features can contribute to income volatility and job turnover: low-wage workers, including many who participate in SNAP, are more likely than other workers to experience periods when they are out of work or when their monthly earnings drop, at least temporarily. These dynamics lead many adults to participate in SNAP temporarily, often while between jobs or when their work hours are cut. Others, such as workers with steady, but low-paying, jobs, or those unable to work, participate on a longer-term basis. SNAP’s dual function as both a short-term support to help families afford food during a temporary period of low income and a support for others with longer-term needs is one of its principal strengths.
The backdrop of frequent job turnover among low-income workers can make it difficult to assess and quantify the work experiences of SNAP recipients. Looking at work status among SNAP participants at a given point in time substantially overstates their joblessness, the evidence makes clear, as large numbers of participants receive SNAP for short-term periods and work both before and after their stay on SNAP (or work in some months while on SNAP but are underemployed in other months). When data on SNAP participants’ work patterns and low-wage workers’ participation in SNAP are examined over a period of several years, as this analysis does, it becomes clear that workers earning low wages are frequently in and out of work and on and off SNAP as their earnings fall and rise. Most low-income, non-disabled adults work, but often with interruptions, and they are more likely to participate in SNAP when they are not working. For the small share of participants who are unable to work or face barriers to work, SNAP is a crucial support that helps them buy groceries.
Terms and Concepts Used in This Report
Non-disabled adults: This report looks at individuals who participate in SNAP, are aged 18-59, and are not receiving disability benefits.a These individuals include both those living with children and those in childless households. Government disability benefits, such as Supplemental Security Income (SSI) and Social Security Disability Insurance (SSDI), have stringent criteria that limit benefits to individuals with serious long-lasting disabilities. As a result, many individuals with impairments and health conditions do not receive disability benefits, and those who apply for such benefits can face a lengthy application and appeals process. While this paper uses the phrase “non-disabled” to describe individuals not receiving disability benefits, many of these individuals have impairments that limit their ability to work or to perform other everyday tasks.
Work among SNAP participants over time: This report uses two main methods to analyze the patterns of SNAP participation and work among non-disabled adults over time using data from the Census Bureau’s Survey of Income and Program Participation (SIPP).
“Within a year of a point in time”: This analysis looks at participants who were receiving SNAP in a specific month in mid-2012, and then observes their work the year before and after that month (without regard to whether they participated in SNAP in the other months). Comparing work among participants in a given month when participating in SNAP to work among those individuals over a longer period of time demonstrates that work is under-counted if one looks only at work in a specific month among the adults participating in SNAP in that month.
“Ever over the period”: This analysis looks at the group of non-disabled adults who received SNAP at any point in a roughly 3.5-year period from mid-2009 through mid-2013.b This allows us to better capture the patterns of work and SNAP participation over a longer period, including times when individuals are not participating in SNAP.
The SIPP is based on self-reported data, including SNAP participation and work status. This and other factors result in some limitations in identifying SNAP participants, and some differences in identifying work status through the SIPP as compared to identifying it through the SNAP administrative data. For a discussion of these limitations and differences, more detailed descriptions of the above terms and concepts, and other methodological notes, please see the Appendix.
a Under SNAP definitions an individual is considered “elderly” beginning at age 60 and is considered “disabled” if he or she receives certain disability benefits.
b The time window for the analysis includes 44 months, but we include only the months when an individual who participated in the survey was aged between 18 and 59 and was not receiving disability benefits. Because some individuals did not meet these conditions for all 44 months, on average the analysis covers about 39 months, which we refer to as roughly 3.5 years.
Our analysis of employment and SNAP participation trends among working-age adults who are not receiving disability benefits finds:
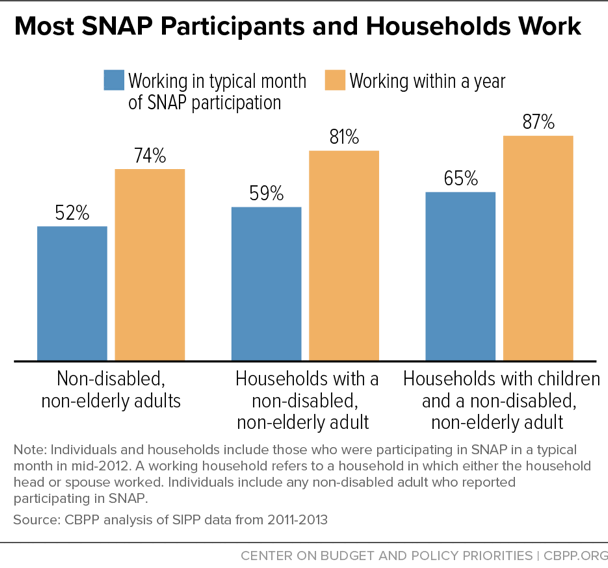
- Nearly three-quarters of adults who participate in SNAP in a typical month work either that month or within a year of that month of participation. Over half of individuals who were participating in SNAP in a typical month in mid-2012 were working in that month. Furthermore, 74 percent worked in the year before or after that month (in the 25-month period). Rates were even higher when work among other household members is counted: 81 percent of SNAP households with a non-disabled adult, and 87 percent of households with children and a non-disabled adult, included at least one member who worked in this 25-month period.
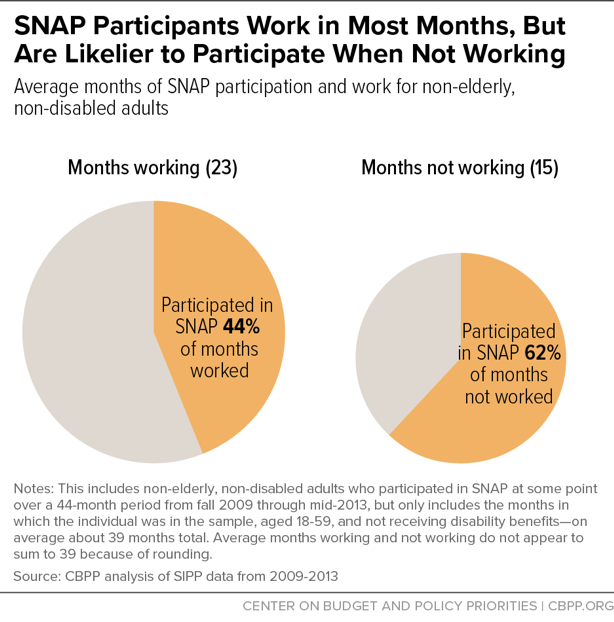
- SNAP participants often experience periods of joblessness and are more likely to participate in SNAP when they are out of work. Individuals who participated in SNAP at any point over a 3.5-year period from 2009 through 2013 worked most months over this period, but were more likely to participate when they were out of work. They participated in SNAP in over two-fifths of the months that they were working (44 percent). They participated in SNAP in 62 percent of the months in which they were not working, a time when their income was lower and their need for help affording food was higher.
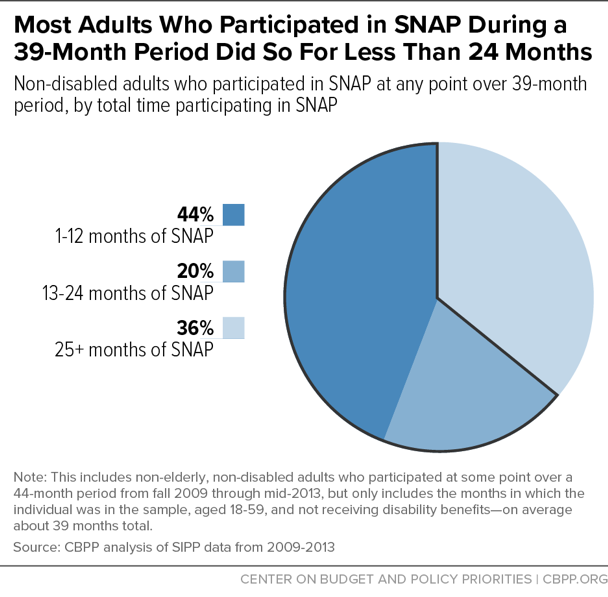
- SNAP participation among non-disabled adults is often short term, but those who receive SNAP for longer periods still work most of the time. Nearly two-thirds (64 percent) of the adults who participated in SNAP at some point over the roughly 3.5-year period that this part of our analysis examined received it for a total of less than two years. Regardless of how long these adults participated in SNAP, however, they worked in the majority of months in which they received SNAP assistance. Over one-third of non-disabled adults worked in every month they participated in SNAP.
- SNAP participants who are consistently out of work often face barriers to work or have caretaking responsibilities. About one-quarter of adults who participated in SNAP in a given month in 2012 did not work within a year. Of those adults, most cited caretaking responsibilities or health conditions as the reasons they were not working. These adults were also more likely to lack a high school degree or to report a work-limiting health condition than those who worked. (While this analysis is limited to adults who do not receive disability benefits, many individuals with significant impairments and other health conditions that limit their ability to work do not receive such benefits.)
Existing policy already limits SNAP participation for childless adults who are not employed at least half-time to just three months out of every three years, and imposes other work requirements, for which failure to comply can result in sanctions. Policies that would further limit SNAP for jobless participants would, sooner or later, harm many individuals who currently are working as well as poor adults who are looking for work, and those who face significant obstacles to employment. For individuals who earn persistently low wages, putting up additional barriers to receiving SNAP will not improve their labor market prospects or increase mobility. For those who are out of work for longer periods of time, many of whom face serious barriers to employment or are unable to work because they lack access to supports such as affordable child care, helping them increase their ability to work in a meaningful way would require an investment in resources, rather than a denial of basic food assistance.
Results from other programs show that work requirements rarely lead to significant increases in meaningful employment, and often result in increased poverty for those who lose benefits without increasing earnings. The most successful interventions offer intensive assessment and training and supportive services, which are extremely expensive, and are provided for voluntary participants. Congress provided funding in 2014 for ten comprehensive SNAP employment and training demonstration projects to test whether new, innovative approaches would help boost employment and earnings. Policymakers should wait to learn the results from these demonstrations before instituting policies that research indicates are unlikely to significantly increase work.
SNAP Participation Is Variable, Especially for Workers
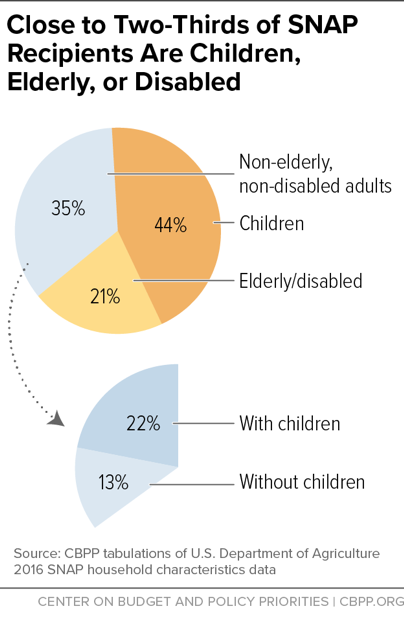
SNAP provides food assistance benefits to a diverse group of low-income individuals. In an average month, close to two-thirds of SNAP participants are children, elderly, and people who receive disability benefits and are not expected to work. In an average month, about 35 percent of participants are non-elderly adults who do not meet the strict criteria to receive disability benefits, most of whom have children, according to SNAP administrative data.[1] (See Figure 1.)
An extensive body of research shows that SNAP has significant short-and long-term benefits for participants. SNAP participation is linked to reduced food insecurity and poverty and improved health, and is an important short-term support for unemployed workers.[2]
SNAP’s structure allows it to provide temporary support for many participants, as well as longer-term support for some households with longer-term needs, including many low-wage workers. SNAP provides benefits to eligible households based on monthly income and other household information. Because of SNAP’s entitlement funding, it guarantees food assistance to all eligible applicants when they need it. Participants can receive benefits for a given period (called a “certification period”), generally six to 12 months for households without elderly or disabled members. During this period, they must report certain changes (for example, changes that put their income over the program’s income limit) and must reapply after this period is over.[3] If a SNAP recipient takes a new job that raises her income above SNAP income limits, she can return to the program later if her income falls.
The length of time that people participate in SNAP depends on their circumstances. Participants can receive SNAP until they lose eligibility, as determined both by program rules and by individual circumstances.[4] Many participants turn to SNAP temporarily, such as following a job loss or a family crisis. The most common changes that precede SNAP participation include a loss of or decrease in earnings or other income or a birth or other addition of a new family member, according to U.S. Agriculture Department (USDA) research. Half of all participants who begin receiving SNAP leave within 12 months, and two-thirds leave within two years, this same USDA report, which looks at data from 2008 through 2012, finds. Those who participate longest tend to be elderly individuals and people with disabilities. About half of all non-disabled, childless adults who began receiving SNAP left within eight months, on average.[5]
For some participants, SNAP serves an important role as a long-term support. For example, elderly participants or those with disabilities who live on fixed incomes may need help affording food for years, given their consistently low incomes. Similarly, workers who consistently earn low wages may continue to need and qualify for SNAP benefits to help feed their families.
Analyses of SNAP participants that use data on participants in a given month in which they participate in the program, such as the administrative data cited above, provide a useful snapshot of who may be participating in SNAP at any point in time. But these analyses cannot capture SNAP participation patterns or work patterns over time. Some SNAP participants in a snapshot analysis have just begun receiving benefits, some are in their last month of benefit receipt and will soon no longer receive benefits, and some have been in SNAP for a number of months. Similarly, because people tend to turn to SNAP when their income is lowest (or when their income stretches least, such as when they have large expenses or a change in household composition), their income while participating in SNAP may not be representative of their income over a longer period. This is especially true for workers: because many workers participate in SNAP when they lose a job or their work hours are low, they are less likely to be working while they are participating in SNAP than they will be in the future and were in the past.
Analysts often use an analogy to a hospital room to explain this dynamic, which here we will modify to a hotel analogy.[6] Consider a hotel with two rooms. Over a week, one room is occupied by the same person throughout. The other room is occupied by seven different people who stay for one night each and then leave. If you ask what share of those who are guests in these rooms on any given day are “long stayers,” the answer is 50 percent (one of the two people then in the rooms). But if you ask what share of all guests over the course of the week were long stayers, the answer is 12.5 percent — 1 in 8. Now, imagine that the long-term guest in the first room, who appears as half of the guests in a snapshot analysis, was unable to work and did not work that week or any time recently. Imagine also that some of the short-term stayers were workers who were not working that day, while the other short-term stayers were working during their visit (and were at the hotel staying as business travelers). Even though the large majority of the guests over the week were indeed workers, a snapshot analysis would find a much smaller share were working on any given day.
Analyzing Work and SNAP Participation Among Non-Disabled Adults
To analyze work and SNAP participation among adults, we conducted two analyses using longitudinal data from the Survey of Income and Program Participation (SIPP). (See text box, “Terms and Concepts Used in This Report.”) These analyses show that most non-disabled adults participating in SNAP are workers, but they are more likely to participate in SNAP when they are between jobs. For those who participate when they are without a job, they are often soon working again, and many of those who do not work face significant barriers to work.
This analysis focuses on the period immediately following the Great Recession, a time when poverty, unemployment, and SNAP participation remained substantially elevated. Current trends may be somewhat different, but it’s difficult to know the effect on the work experiences of SNAP participants because some people are no longer SNAP participants in a stronger economy.
- A stronger economy means some individuals are less likely to become unemployed, while others may experience shorter spells of unemployment or be able to obtain more hours of work over the week (or more weeks of work over the year). As a result, fewer people qualify for SNAP and those who do qualify may be less likely to participate because they anticipate being back on their feet faster. Accordingly, it could be that SNAP participants, on average, work more, or it could be that the people who remain on SNAP are those who face more substantial barriers to work with the result that, on average, the share of SNAP participants who are workers is lower.
- Second, childless individuals aged 18 through 49 are generally subject to a three-month time limit on SNAP participation unless they receive an exemption or are working (or in a work or training program) at least half-time. This time limit can be waived during periods of high unemployment, and was waived in most states for the period studied.[7] However, with the stronger economy, fewer areas now qualify for waivers of the time limit and some states have declined to apply for or renew waivers. As a result, the childless adults ages 18-49 who remain on SNAP are more likely to work at least part time, because many who aren’t able to do so have been cut off after three months.[8]
More Participants Work Than Are Captured in a Typical Month
This first section reports findings from the “point-in-time analysis,” which looks at a group of participants who were receiving SNAP in a specific month in mid-2012 and observes their work during the year before and after that month (when they may or may not have also been participating in SNAP). Comparing a typical month to a broader time for the same participants shows this group is more likely to work over time than in a typical month while participating in SNAP.
While most participants work in a given month while they receive SNAP, even more work within a year. Among non-disabled adults participating in SNAP in a particular month in mid-2012, 52 percent worked in that month, but about 74 percent worked at some point in the year before or after that month (a period of 25 months). Rates were even higher counting work among other household members: over 80 percent of SNAP households with a non-disabled adult, and 87 percent of households with children and a non-disabled adult, worked in this 25-month period. (See Figure 2.) The increased work rate over time demonstrates that joblessness is often a temporary condition for SNAP participants.
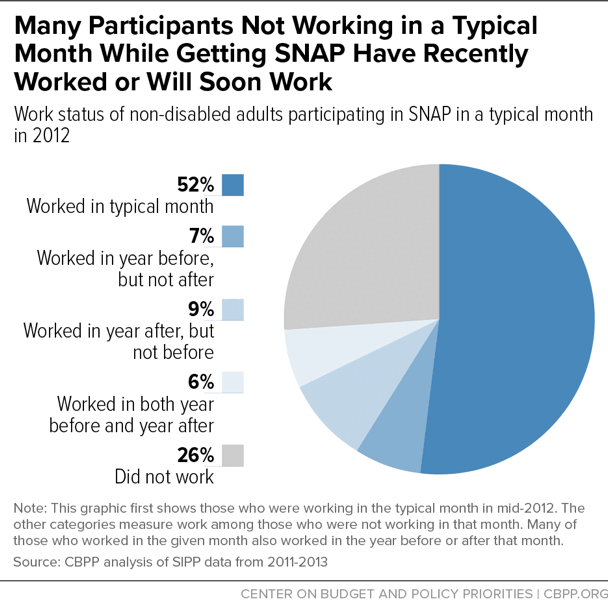
Many SNAP participants who are not working in a typical month while they are participating in SNAP have recently worked or will soon work. Of those adults who were not working in the month studied, close to half worked in either the year before or the year after that month.[9] (See Figure 3.)
Among participants who are employed, work is substantial. When participants work, they typically work at least half time, and usually full time. (Here, “full time” means either the individual worked at least 35 hours per week, and “half time” means he or she worked at least 20 hours a week, but fewer than 35.) As part of this analysis, we looked at non-disabled adults who were participating in SNAP in a given month in 2012 and who worked in the year after this month, which is about two-thirds of all non-disabled adults who participated in that given month.
Of the adults who worked in this year, about half (52 percent) worked at least six months full time, and an additional 19 percent worked at least one month full time. (These individuals may also have worked some months part time, but here we first looked at workers with full-time work.[10]) Some 14 percent did not work full-time in this year, but they worked half time for at least six months.[11] Only 15 percent worked 20 hours per week for less than six months or worked fewer hours than that for any length of time.
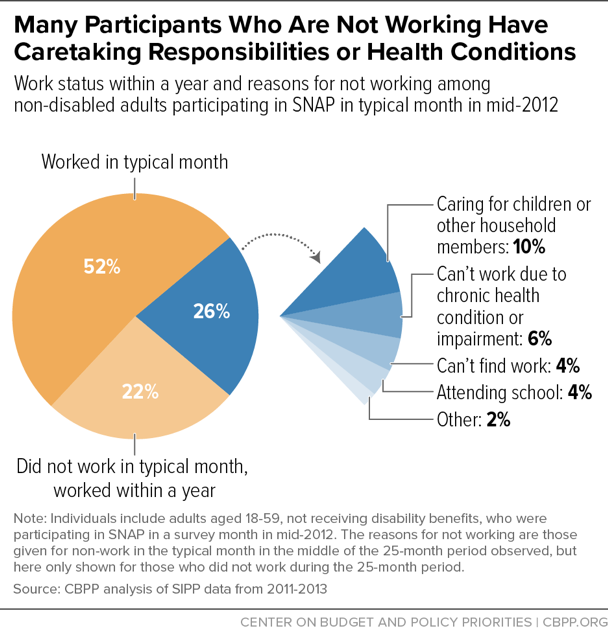
Many SNAP participants who did not work over the 25-month period reported caregiving responsibilities or faced barriers to work. The adults who did not work over the 25-month period surrounding the given month in 2012 when they participated in SNAP most commonly reported caregiving responsibilities (for children or others), health conditions that prevent work, inability to find work, or going to school as the reason for not working. (See Figure 4.) (The survey only allowed respondents to select one reason, so these are mutually exclusive.)
These adults were also more likely than those who worked to lack a high school diploma and to report a disability or health condition for which they did not receive disability assistance, both of which may present barriers to work. While 23 percent of SNAP participants who worked reported having less than a high school education, this was true of 30 percent of those who did not work. In addition, over one-third of those who didn’t work reported a work-limiting disability, compared to just 11 percent of those who worked.[12]
Many People Participate in SNAP When Between Jobs, But They Still Work Most Months During Which They Receive SNAP
In the last section, we looked at non-disabled adults who were receiving SNAP in a given month in mid-2012. In this section, we look at the non-disabled adults who ever participated in SNAP in a period of almost 3.5 years, which allows us to observe their work both while they participated in SNAP and in the months when they did not, and to observe work among SNAP participants over a longer period of time. This analysis also allows us to measure the amount of SNAP participation over a broader period of time.
SNAP bridges periods of joblessness for many participants. Non-disabled adults worked most of the time, but they were more likely to participate in SNAP in the months when they were out of work and their income was lowest. These adults participated in SNAP in over two-fifths of the months they were working (44 percent), and in 62 percent of the months in which they were not working.[13] This helps explain why a static analysis that focuses only on work in a given month among those participating in SNAP in that month will show less work than is the case over time: many of these workers are temporarily participating in SNAP between jobs. (See Figure 5.)
SNAP helps workers supplement wages and fill gaps in employment for both short- and longer-term periods. Many workers participate in SNAP on a temporary basis, while others participate for longer periods. Looking at the group of people who ever participate in SNAP over a period of time allows us to gain a fuller picture of the participants, including those who participate for short periods (who make up a smaller share of those who participate in any given month than those who participate over time). A majority of the adults who ever participated in SNAP in this three-and-a-half-year period participated in the program for less than two years total, with about two-fifths (44 percent) participating for one year or less and 20 percent participating for one to two years.[14] (See Figure 6.)
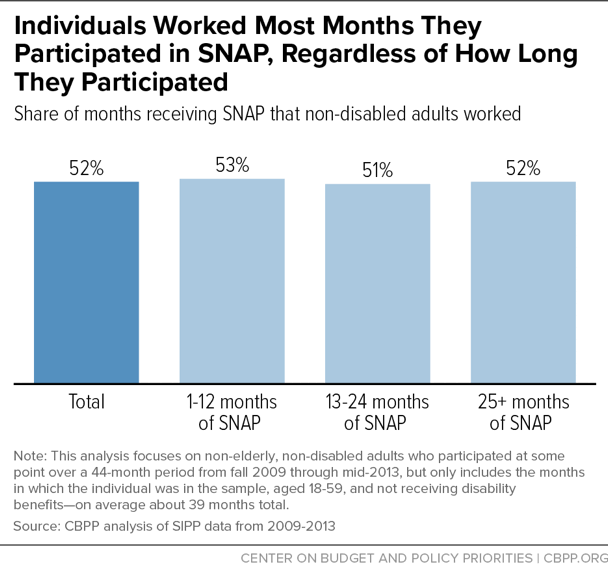
Regardless of how long they participated in SNAP, however, individuals in every group worked most of the months they participated. On average non-disabled adults worked in a majority of the months they received SNAP, with over one-third of these adults working every month they participated in SNAP. The share of months that non-disabled adults worked while getting SNAP was virtually the same for each group: those who participated for one year or less worked about 53 percent of the months they participated in SNAP, compared to about 51 percent for both those who participated one to two years and 52 percent for those who participated more than two years.[15] (See Figure 7.) In general, adults who participated in SNAP for longer periods of time were no less likely to work while getting SNAP than other participants.
Low-Wage Work Contributes to Volatility
These findings show that while most SNAP participants work, many experience periods when they are out of work. While on average most people who participated in SNAP worked over the 3.5-year period we examined, and they worked most of the time, most workers were out of work for at least one month in this study period.[16] The types of jobs that participants are most likely to have likely contribute to these patterns. Many low-paying jobs have features that contribute to workers cycling in and out of jobs, and SNAP participants disproportionately work in these jobs.
Low-paying jobs often have irregular schedules that change from week to week. Workers in these jobs are sometimes given little notice of schedule changes or are expected to be on call, and are more likely to work part-time hours when they would prefer a full-time schedule.[17] Low-wage jobs are also more likely to lack paid sick leave or other paid leave. For example, only 46 percent of workers in jobs with average hourly wages in the bottom 25 percent of the wage distribution had paid sick leave in 2016, compared to 91 percent of workers in the highest-paid jobs (and 72 percent overall).[18] Evidence suggests over the last decade, there has also been a rise in so-called alternative work arrangements, which include short-term and contract positions with little job security.[19]
Low wages and irregular schedules contribute to conditions that make it harder for workers to keep jobs and feed their families when they are employed. Workers may lose jobs when their changing schedules interfere with other responsibilities such as child care, making it difficult to maintain required hours.
Workers in jobs with lower wages, more volatility, and fewer benefits are more likely to experience turnover, research shows. For example, a study found that workers with access to paid sick leave or paid vacation were more likely to stay in their current job. This study found these effects even when controlling for other characteristics of workers, such as education level or income, or characteristics of jobs (such as the size of the firm and other benefits provided) that are associated with more job separations.[20] Another study that examined data from a large chain of retailers found that workers who earned lower wages and had more schedule volatility (which was driven by changes in consumer demand, not by employee choice) were more likely to leave their jobs; this study found that these effects were not due to worker ability.[21] Other studies have shown that increasing wages in certain low-wage industries such as food service has been associated with reduced employee turnover.[22]
In addition to job conditions, the lack of key supports such as stable housing and access to affordable child care may also contribute to volatility or periods of joblessness among low-income workers. For example, recent research finds that low-income renters who experience a forced move (such as following an eviction) are more likely to be laid off from their jobs, compared to similar renters who did not experience a forced move.[23]
Child care is often unaffordable for many low-income parents: for families with income at the poverty level, average child care costs in family-based child care can range from about 17 percent of total household income for a family of three in Mississippi to 62 percent in Massachusetts. Center-based child care can be even further out of reach for these households.[24]
Despite these costs, funding for subsidies to help defray them is limited. In 2013, only about 1 in 6 low-income children eligible for child care under federal rules received subsidies to help them afford care.[25] While these subsidies are limited, studies show that providing support to increase access to child care helps parents work: low-income women with access to affordable child care through subsidies are more likely to participate in the labor force and to be employed, research finds.[26]
At least in part because of these conditions, workers in low-wage jobs are more likely to be employed at jobs for shorter periods and to experience periods of non-work. Workers with lower levels of education (who are more likely to work in low-wage jobs) spend more weeks unemployed than those with more education and they experience less wage growth over the course of their lifetimes, according to studies by the Bureau of Labor Statistics that follow workers over time. These studies also find that younger workers with less education are more likely to have short-term jobs of six months or less, compared to workers of a similar age with more education.[27] Workers in jobs that tend to have low wages, such as in the leisure and hospitality industry and service occupations, also tend to stay at jobs for shorter lengths than workers in other jobs.[28]
Working SNAP participants often work in occupations and industries with low wages and more volatility. Compared to all workers, a greater share of workers who participate in SNAP are employed in service occupations and in industries such as retail and hospitality, where jobs are more likely to pay low wages and have other features of low quality.[29] Another way of looking at the connection between SNAP and job quality is to look at occupations where a high share of workers participate in SNAP. At least one-quarter of all personal care aides, maids and housekeeping cleaners, dishwashers, food preparation workers, and workers in a few other occupations are in a household that participated in SNAP in the previous year.[30]
Proposals to Further Restrict SNAP for Jobless Workers Are Misguided
SNAP serves as an important support for many working-age individuals and their families. Many people participate while they are working to supplement low incomes; others participate when they are temporarily without a job; and still others participate who have health conditions, caretaking responsibilities, or other conditions that make working difficult, though many have other family members who do work.
Some policymakers suggest that further limiting SNAP participation among non-disabled adults to those who are working while participating would increase employment rates. Such proposals, however, hold little potential to increase work among this population and carry a high risk of increasing hardship among workers.
- SNAP already has work requirements. SNAP requires most working-age, non-disabled adults to register for work and accept any reasonable job offer. Adults who are physically or mentally unable to work, are raising young children, receiving (or applying for) unemployment benefits (which have their own work-related requirements), participating in a drug treatment program, or already working 30 hours a week do not have meet this requirement. States may require individuals to participate in employment and training activities, like job search, education, or workfare. They can opt to offer these activities to individuals on a voluntary basis as well. In addition, as described above, most unemployed adults without children can only get SNAP for three months in any three-year period unless they are working or in a job training program at least half time. And because states are not required to provide a work or training slot for these individuals, they can be cut off from benefits irrespective of whether they are searching diligently for a job or willing to participate in, but unable to find, a qualifying work or job training program.[31]
- Most participants are working while they are participating in SNAP, have recently worked, or soon will be working, as this paper details. Designing policies based on participants’ lack of a job during SNAP participation misses the fact that many of them are experiencing temporary unemployment, as well as temporary SNAP participation.
- SNAP already provides incentives to work. SNAP’s basic structure incentivizes work. As participants earn more, their benefits gradually decrease, and participants are therefore better off working than not.[32]
-
Effectively addressing employment barriers would be costly. Many SNAP participants who consistently are out of work may be able to work if given appropriate services to assess and address their barriers to employment, such as access to affordable child care or targeted training to gain skills that better match them to available jobs; providing these services to all such SNAP participants would, however, be extremely expensive. The most successful interventions provide a thorough assessment of an individual’s needs, provide a comprehensive approach to addressing barriers to employment and gaps in skills, and develop skills that are linked to the labor demands of the job market in their area. These services are often intensive and costly, and are currently very limited as a result of scarce funding. Other less costly interventions such as job search have not been found to lead to increased employment.[33]
Experience with work requirements in cash assistance programs also suggests that even providing supportive services to people with serious barriers to employment may not significantly increase their ability to find a suitable job.[34] In the meantime, these individuals, many of whom are among the most vulnerable, would lose access to food assistance if harsher, more rigid SNAP work requirements were imposed on them.
- More stringent work requirements could leave many participants worse off. Past experiences with policies that penalize adults who are not working show these policies lead to the loss of benefits for many, while rarely producing significant long-term improvements in employment. Evaluations of work requirements in cash assistance programs found that the modest increases in employment that occurred among recipients subject to the work requirements faded over time, and employment outcomes were no different five years later for these individuals than similar recipients who were not subject to work requirements. Studies have also found that work for many individuals who found work was unstable and not long-lasting, and that the loss of benefits overall sometimes outweighed any modest increase in earnings, with considerable numbers of individuals losing benefits without finding a job. By contrast, providing targeted and comprehensive services to voluntary participants, who tend to be the individuals most able to take advantage of these services, has been shown to be more successful.[35]
- USDA is also testing new approaches to improve results through SNAP employment and training. In response to the lack of proven interventions to increase employment outcomes for SNAP recipients, Congress acted on a bipartisan basis in 2014 to set up ten comprehensive SNAP employment and training demonstration projects to test whether new, innovative approaches would help boost employment and earnings. These projects, which build upon existing state efforts, are testing a variety of interventions, including intensive supports for individuals with significant barriers to employment as well as job training based on needs that local employers identify.[36] Policymakers should wait to learn the results from these demonstrations before instituting policies that research indicates are unlikely to significantly increase work.
Appendix: Measuring Work Among SNAP Participants
In this paper, we analyze the relationship between work and SNAP receipt in two ways. In the first approach, we focus on SNAP recipients in a particular month and assess their work rates in the period immediately before and after that month. Our second approach focuses on individuals who ever receive SNAP in a 3.5-year period; we determine how much they work and participate in SNAP over that period.
Data Source
The analyses in this paper use the 2008 panel of the Census Bureau’s Survey of Income and Program Participation (SIPP) to assess the work rates of SNAP recipients.[37] The SIPP is a large-scale, national survey that collects information about household and individual income, program participation, labor force activity, and demographics.
The SIPP is a longitudinal survey conducted over a multi-year period, which gives it a unique survey structure. Most households in the 2008 SIPP panel remained in the survey through 2013 and were interviewed in four-month intervals called “waves.” A household answered questions about all four months in a wave at one time. Households were also divided into four “rotation groups.” One rotation group was surveyed each month of the panel so that all households were surveyed in any four-month period. Because of this unique structure, the first survey month for one rotation group did not take place in the same calendar month as the first survey month for another rotation group.
Definitions
Non-Disabled, Non-Elderly Adults
For this paper, we focus on non-disabled, non-elderly adults who reported receipt of SNAP benefits and have tried to match SNAP program definitions where possible. Under SNAP definitions an individual is considered “elderly” beginning at age 60 and “disabled” if he or she receives certain disability benefits. As a result, we limit our analysis to adults aged 18-59 who did not receive government disability income from Supplemental Security Income (SSI) or Social Security Disability Insurance (SSDI).
SNAP Households
SNAP households include all individuals who live at the same sample address and are covered by the same SNAP benefit. The SIPP identifies SNAP coverage units and a “coverage owner,” the person who receives the SNAP benefits, whom we refer to as a SNAP household head. (If there are two SNAP units living together in a single Census-defined household, they are counted here as two separate SNAP households.)
SNAP Household Types
Households with children. The “households with children” category includes all SNAP households with at least one child under age 18. Individuals under 18 are not counted as children if they are themselves the household head or the household head’s spouse or a subfamily head or head’s spouse. Note that SIPP data do not identify child-only SNAP units (for example, if the parent is an ineligible immigrant), so in the SIPP data, parents are always included in the SNAP households.
Households without children. The “households without children” category includes all SNAP households that do not have a child under age 18 present. This category includes a broad subset of SNAP households that do not fall in the “households with children” category, such as single-person households and elderly households.
Non-elderly, non-disabled households. We define a SNAP household as non-elderly, nondisabled if at least one adult in the SNAP household is under age 60 and does not receive disability income from SSI or SSDI. (The adult must be the SNAP household head, or the spouse or unmarried partner[38] of the household head.)
Defining Work
Work participation is measured using two survey variables. The first is the respondent’s employment status in each month, which indicates whether he or she held a job in that month. The second variable is the typical number of hours per week that respondents were working at jobs during the period. We include individuals out of the labor force as a part of those who are not employed, regardless of whether they reported working some hours.
When we look at household-level work, we consider the employment only of the SNAP household head, or his or her spouse or partner. This approach likely underestimates SNAP households’ work rates because it does not include the work of other household members, such as grandparents, siblings, adult children, and some unmarried partners.
- Individuals are considered working adults if they have a job and worked during the month. Households are considered working if a household head, or his or her spouse or partner, worked.
- An individual worked full time in a given month if he or she had a job and worked at least 35 hours per week in that month.
- An individual worked part time in a given month if he or she had a job and worked at least 20 hours a week but less than 35 hours a week during the month.
- An individual worked less than part time in a given month if he or she had a job and worked fewer than 20 hours a week or did not specify the number of hours worked.
Notes on the Analyses
Participated Within a Year of a Point in Time
The first analysis assesses the work rates of households and individuals who were participating in SNAP in a particular month. For this analysis, we look at all households and individuals that receive SNAP in a specified month and explore their work rates in the year before and after that month.
Specifically, we examine households and individuals receiving SNAP in the 48th month of the survey, which ranged from April to July 2012, depending on the rotation group. Since the 60th survey month is the last month of wave 15, which is the last wave where all four rotation groups participated, we selected the 48th survey month as our focal point because it was the last month where we could look ahead 12 months in the panel.
Participated Ever in the Panel
Our second approach focuses on individuals who were ever SNAP participants during waves 5 to 15 (survey months 17 to 60) of the 2008 SIPP panel and examines how many months of this period they worked or received SNAP. We limited our analysis to this window because wave 5 was the first wave where all survey months referred to a period after the end of the recession in June 2009. As mentioned above, we stopped in wave 15 because this was the last wave where all four rotation groups participated.
For this analysis, we focused on individuals who participated in SNAP at any point during this 44-month period. We further limited our universe to those individuals who were ever between the ages of 18 and 59 during this period and who did not receive government disability income from SSI or SSDI.[39]
This analysis includes people who were participating in SNAP in the beginning of the period (known in the literature as “left censored”), and those who were still participating at the end (known as “right censored”). We included these individuals when discussing the total number of months of SNAP participation over the time period because those individuals who were participating at the beginning of our window participated for longer periods of time. Excluding them would artificially lower the share that participated in SNAP for longer than two years.
Notes on Limitations of SIPP and Comparing Work Rates Across Sources
Some features of the SIPP and differences between the SIPP and SNAP administrative data produce different estimates of work among SNAP participants.
Some SNAP participants, particularly some of the most vulnerable, may be less likely to participate in the SIPP survey. The Census data are based on a household survey, which means that respondents must have a fixed residence. SNAP, on the other hand, does not require a fixed address and reaches many homeless individuals and other more transient households. Such individuals may be less likely to work than those who are captured in SIPP. In addition, our analysis excludes individuals who left a survey household or entered it in the middle of the survey period and therefore have missing data for some months. Some of these individuals, who may be more transient as well, could be less likely to work than individuals who remain in the same household.
The SNAP participants identified in the SIPP may erroneously include some non-participating household members as SNAP participants. Some individuals who are ineligible for SNAP have family members who participate in SNAP, notably ineligible immigrant adults with citizen children or other adults who have been sanctioned for noncompliance with program rules. The SIPP does not allow us to identify these individuals and separate them out. Because they are in a household that receives SNAP, they may report participating, even though they are technically not participants. It does not appear that counting these individuals as SNAP participants affects our estimates of work rates among SNAP participants. An analysis of USDA SNAP Household Characteristics data from 2016 found that among non-disabled, non-elderly adults, ineligible household members had the same work rates as participants.
Overall, the SNAP Household Characteristics data find lower rates of work than the Census data. For example, we found that 52 percent of SNAP participants worked in a specific month in 2012 according to the SIPP, compared to 33 percent in an average month in fiscal year 2012 in SNAP administrative data. There are several reasons why this may be the case. First, as stated above, some disadvantaged individuals who are less likely to work because they face more barriers to work (such as homeless individuals) may also be less likely to be captured in the SIPP, and it is possible that some workers in the SIPP (such as undocumented immigrants with citizen children) are ineligible for SNAP. At the same time, work that is not required to be reported for SNAP purposes may be captured by the SIPP but not the SNAP Household Characteristics data, which could cause the Household Characteristics data to understate work by SNAP participants. Some work may not be required to be reported for SNAP either because the work is irregular or not expected to continue into the future, or because, under SNAP’s “simplified reporting” rules, changes in circumstances that do not result in household income exceeding 130 percent of the poverty level only need to be reported to the state at six-month intervals.
End Notes
[1] While this paper uses the phrase “non-disabled” to describe these individuals, many of these individuals may have impairments. See box. For more information, see: “Policy Basics: Social Security Disability Insurance,” Center on Budget and Policy Priorities, July 25, 2017, https://www.cbpp.org/research/retirement-security/policy-basics-social-security-disability-insurance; “Supplemental Security Income,” Center on Budget and Policy Priorities, January 29, 2018, https://www.cbpp.org/research/social-security/supplemental-security-income-ssi; and Steven Carlson, Brynne Keith-Jennings, and Raheem Chaudhry, “SNAP Provides Needed Food Assistance to Millions of People with Disabilities,” Center on Budget and Policy Priorities, June 14, 2017, https://www.cbpp.org/research/food-assistance/snap-provides-needed-food-assistance-to-millions-of-people-with.
[2] “Chart Book: SNAP Helps Struggling Families Put Food on the Table,” Center on Budget and Policy Priorities, updated February 14, 2018, https://www.cbpp.org/research/food-assistance/chart-book-snap-helps-struggling-families-put-food-on-the-table.
[3] State rules differ as to what changes households are required to report. For more, see U.S. Department of Agriculture, “State Options Report,” revised August 15, 2017, https://fns-prod.azureedge.net/sites/default/files/snap/13-State_Options-revised.pdf.
[4] As discussed later in this paper, participants aged 18 through 49 with no dependent children in the household are limited to only three months of SNAP eligibility out of every three years, unless they live in an area with a waiver from this requirement due to high unemployment or lack of jobs, meet certain criteria for exemption, or are working or in a training program at least 20 hours per week.
[5] Joshua Leftin et al., “Dynamics of Supplemental Nutrition Assistance Program Participation from 2008 to 2012,” USDA Food and Nutrition Service, December 2014, https://fns-prod.azureedge.net/sites/default/files/ops/Dynamics2008-2012.pdf.
[6] This analogy was originally developed to discuss poverty and welfare dynamics by Mary Jo Bane and David Ellwood. See for example: Mary Jo Bane and David Ellwood, “Slipping into and out of poverty: the dynamics of spells,” National Bureau of Economic Research, September 1983, http://www.nber.org/papers/w1199.pdf.
[7] For more on the time limit, see Ed Bolen and Stacy Dean, “Waivers Add Key State Flexibility to SNAP’s Three-Month Time Limit,” Center on Budget and Policy Priorities, February 6, 2018, https://www.cbpp.org/research/food-assistance/waivers-add-key-state-flexibility-to-snaps-three-month-time-limit.
[8] While some reports suggest that the time limit has increased work rates among this population, a careful analysis finds that there is no evidence that these individuals would not have been working at some point anyway, without the time limit. See Dottie Rosenbaum and Ed Bolen, “SNAP Reports Present Misleading Findings on Impact of Three-Month Time Limit,” Center on Budget and Policy Priorities, December 14, 2016, https://www.cbpp.org/research/food-assistance/snap-reports-present-misleading-findings-on-impact-of-three-month-time.
[9] These findings also echo a similar analysis by Mathematica Policy Research, which found that among those adult non-elderly SNAP participants (including those with disabilities) who were unemployed in April 2010, 41 percent were employed in one month one year later, in April 2011, while 27 percent had left the labor force. See: James Mabli and Irinia Cheban, “Supplemental Nutrition Assistance Program Participants’ Employment Characteristics and Barriers to Work,” Mathematica Policy Research, July 19, 2017, https://www.mathematica-mpr.com/our-publications-and-findings/publications/supplemental-nutrition-assistance-program-participants-employment-characteristics-and-barriers. Among other differences, the Mathematica analysis looked at non-elderly adults, while our analysis looks at non-elderly adults without disabilities based on receipt of government disability benefits. Mathematica’s analysis looked not just at employment and non-employment, as ours does, but also at labor force participation. Its analysis also used a slightly different time frame (comparing a single month in April 2010 to a single month in April 2011). But, most findings are broadly similar.
[10] This analysis was a waterfall analysis that categorized individuals according to the first category to which they belong. Individuals may in fact belong to more than one category. We first grouped those who worked full time for at least six months, then those who worked full time for less than six months but at least one month, then those who did not work full time but worked at least six months half time, then those who worked less than six months half time but at least one month, then others who worked but less than half time every month or less than one month half time. An individual who worked eight months full time and four months part time would thus be in the first category, as having worked full time for at least six months.
[11] We limited this analysis to the group who worked the year after participating in SNAP because considering work over a one-year period is more intuitive. While we chose the year after the given month, findings are very similar for looking at work among those who worked in the year before the given month in mid-2012, with a slightly lower share working full time at least six months (48 percent), a slightly higher share working full time one to six months (25 percent), and a slightly lower share working half time at least six months (12 percent).
[12] An analysis by Mathematica Policy Research found similar barriers among non-workers, though its findings differ slightly because it was not limited to those not receiving disability benefits and it examined labor force participation in addition to work. For example, Mathematica’s study found that close to half of those who were not working (either unemployed or out of the labor force) reported a work-limiting condition, with a majority of these individuals who reported such a condition (58 percent) being people who were out of the labor force. The single most common reason cited by non-workers for their lack of employment (including both those unemployed and those out of the labor force) was a chronic health condition.
[13] SNAP participants are also more likely to work in months when they are not receiving SNAP. Overall, they worked 60 percent of the total 39 months studied, including 52 percent of the months they received SNAP and 69 percent of the months they were not participating in SNAP.
[14] This is the total amount of participation; if a participant left SNAP but then began receiving SNAP again later during this period, this amount would reflect the sum of the months they participated in both periods. This analysis includes individuals who were already participating at the beginning of the period or were still participating at the end, but only reports the participation that we could observe during the period studied.
[15] Most participants worked at least some point during the months they received SNAP. The share who worked at least one of the months they received SNAP ranged from 63 percent of those who received SNAP for one year or less to 78 percent of those who received SNAP for more than two years. While a lower share of people who participated for one year or less worked while receiving SNAP, those who did work on average worked in a greater percentage of the months that they participated than workers who received SNAP for more than two years.
[16] As stated above, they worked about 52 percent of the months they participated in SNAP, but because they worked a higher share of months when they were not participating in SNAP, in total, the share of all months they worked is higher: about 60 percent of all months we observed. Overall, 81 percent of these non-disabled adults worked during the period examined. Among those who worked, about two-thirds had at least one month when they were out of work.
[17] For more information, see Brynne Keith-Jennings and Vincent Palacios, “SNAP Helps Millions of Workers,” Center on Budget and Policy Priorities, May 10, 2017, https://www.cbpp.org/research/food-assistance/snap-helps-millions-of-low-wage-workers.
[18] Bureau of Labor Statistics, Employee Benefits Survey, https://www.bls.gov/ncs/ebs/benefits/2017/ownership/civilian/table32a.htm. This survey constructs hourly wage percentiles by looking at average reported hourly wages for workers by occupation. (Because these averages are for occupations, workers may fall into a different percentile than their occupation as a whole if they earn more or less than the average for their occupation.)
[19] Lawrence Katz and Alan Krueger, “The Rise and Nature of Alternative Work Arrangements in the United States, 1995-2015,” NBER Working Paper 22667, September 2016, http://www.nber.org/papers/w22667.pdf; David Weil, “Enforcing Labour Standards in Fissured Workplaces: the U.S. Experience,” Economic and Labour Relations Review, Vol. 22, No. 2, http://web.law.columbia.edu/sites/default/files/microsites/career-services/David%20Weil%20Enforcing%20Labour%20Standards%20in%20Fissured%20Workplaces.pdf.
[20] Heather Hill, “Paid Sick Leave and Job Stability,” Work and Occupations, Vol. 40, Issue 2, 2013, https://www.ncbi.nlm.nih.gov/pmc/articles/PMC3825168/.
[21] Saravanan Kesavan and Camelia Kuhnen, “Demand fluctuations, precarious incomes, and employee turnover,” working paper, May 2017, http://public.kenan-flagler.unc.edu/faculty/kuhnenc/research/kesavan_kuhnen.pdf.
[22] Amanda Gallear, “The Impact of Wages and Turnover on Security and Safety in Airports: A review of the literature,” UC Berkeley Labor Center, October 2017, http://laborcenter.berkeley.edu/pdf/2017/SFO-literature-review.pdf.
[23] Matthew Desmond and Carl Gershenson, “Housing and Employment Insecurity Among the Working Poor,” Social Problems, Vol. 63, Issue 1, February 2016, https://academic.oup.com/socpro/article-abstract/63/1/46/1844105.
[24] “Parents and the High Cost of Child Care,” Child Care Aware of America, 2017, https://usa.childcareaware.org/wp-content/uploads/2017/12/2017_CCA_High_Cost_Report_FINAL.pdf
[25] “Factsheet: Estimates of Child Care Eligibility and Receipt for Fiscal Year 2013,” U.S. Department of Health and Human Services, November 2, 2017, https://aspe.hhs.gov/pdf-report/factsheet-estimates-child-care-eligibility-and-receipt-fiscal-year-2013.
[26] Kimberly Burgess, Nina Chien, and Maria Enchautegui, “The Effects of Child Care Subsidies on Maternal Labor Force Participation in the United States,” U.S. Department of Health and Human Services, December 2016, https://aspe.hhs.gov/system/files/pdf/253966/EffectsCCSubsidiesMaternalLFPBrief.pdf.
[27] Bureau of Labor Statistics, “America’s Young Adults at 29: Labor Market Activity, Education and Partner Status: Results from a Longitudinal Survey,” April 8, 2016, https://www.bls.gov/news.release/nlsyth.nr0.htm; Bureau of Labor Statistics, “Number of Jobs Held, Labor Market Activity, and Earnings Growth Among the Youngest Baby Boomers: Results from a Longitudinal Survey Summary,” August 24, 2017, https://www.bls.gov/news.release/nlsoy.nr0.htm.
[28] Bureau of Labor Statistics, “Employee Tenure in 2016,” https://www.bls.gov/news.release/pdf/tenure.pdf.
[29] Keith-Jennings and Palacios.
[30] Keith-Jennings and Palacios. These data are from the 2015 American Community Survey. SNAP participation is at the household level, and of households that reported participating in the last year. Workers are identified as having worked at the time of the survey. Workers in these households may not be participants themselves and may have participated in SNAP while they were not working.
[31] For more information, see Bolen and Dean.
[32] Elizabeth Wolkomir and Lexin Cai, “The Supplemental Nutrition Assistance Program Includes Earnings Incentives,” Center on Budget and Policy Priorities, March 6, 2018, https://www.cbpp.org/research/food-assistance/the-supplemental-nutrition-assistance-program-includes-earnings-incentives.
[33] “Supplemental Nutrition Assistance Program (SNAP) Employment and Training (E & T) Best Practices Study: Final Report,” USDA, November 2016, https://fns-prod.azureedge.net/sites/default/files/ops/SNAPEandTBestPractices.pdf.
[34] LaDonna Pavetti, “Work Requirements Don’t Cut Poverty, Evidence Shows,” Center on Budget and Policy Priorities, June 7, 2016, https://www.cbpp.org/research/poverty-and-inequality/work-requirements-dont-cut-poverty-evidence-shows.
[35] Pavetti 2016.
[36] Stacy Dean, Ed Bolen, and Brynne Keith-Jennings, “Making SNAP Work Requirements Harsher Will Not Improve Outcomes for Low-Income People,” Center on Budget and Policy Priorities, March 1, 2018, https://www.cbpp.org/research/food-assistance/making-snap-work-requirements-harsher-will-not-improve-outcomes-for-low.
[37] While Census recently released data from the first wave of the 2014 SIPP panel, the new panel now only asks questions every 12 months (due to budget cuts). As a result, it does not capture monthly variations in program participation or work as accurately as the 2008 SIPP panel. For this reason, we conducted our analysis using the earlier panel.
[38] We are able to match unmarried partners if two individuals in a household are both parents to a child in the household.
[39] When calculating the number of months of SNAP and work for this group, we only included months when an individual was not receiving disability benefits and between 18 and 59 years old. This is because some people in this universe were children, elderly, or disabled for some period during the panel and we did not want to include these periods when calculating work rates.
More from the Authors