Factors Affecting SNAP Caseloads
The Supplemental Nutrition Assistance Program (SNAP) has historically been, after Unemployment Insurance, the most responsive federal program during economic downturns, expanding to meet need and then shrinking when the increased need recedes. SNAP was quick to respond after the onset of the Great Recession and reached all-time high enrollment levels. SNAP enrollment has receded in the years since then, with the decline accelerating since 2016. There was, however, a substantial lag between the decline in the unemployment rate and the decline in SNAP enrollment, and enrollment remains well above pre-recession levels nationally. This analysis examines the available evidence about some of the factors that may be contributing to these caseload patterns — including a poverty rate that has lagged post-recession employment gains and a greater share of eligible households enrolling in the program.
First, a few basic facts about SNAP. It provided $63.6 billion in benefits to 42 million people in fiscal year 2017, with an average benefit of $254 per month per household, or about $1.40 per person per meal. More than 90 percent of benefits go to households with cash income at or below the poverty line. Nearly 60 percent of benefits go to households with cash income at or below half of the poverty line.
SNAP Caseloads Grew During the Recession and Sluggish Recovery, Then Fell Gradually
Enrollment peaked in December 2012. Since then, the number of people participating in SNAP has fallen by more than 8 million SNAP caseloads grew substantially — by about 81 percent — between fiscal years 2007 and 2013, primarily for two reasons. First, many more households qualified due to the steep recession and the subsequent sluggish recovery, with the share of Americans living below 130 percent of the poverty line (the official SNAP income limit) remaining well above the 2007 level for the first five years of the recovery and not falling back to that level until 2016. Second, a significantly larger share of eligible people enrolled.[1] In 2007, some 69 percent of eligible individuals participated; in 2016, the latest year for which participation rate data are available, 85 percent did, according to U.S. Department of Agriculture (USDA) estimates.
Enrollment peaked in December 2012. Since then, the number of people participating in SNAP has fallen by more than 8 million. Figure 1 shows the number of SNAP participants as a share of the U.S. population from 1995 through 2017, as well as the Congressional Budget Office’s (CBO) latest projections (issued in April 2018) for SNAP participation over the coming decade. CBO forecasts that by 2027, the share of the population receiving SNAP will return close to the 2007 level, at about 9 percent of the U.S. population.
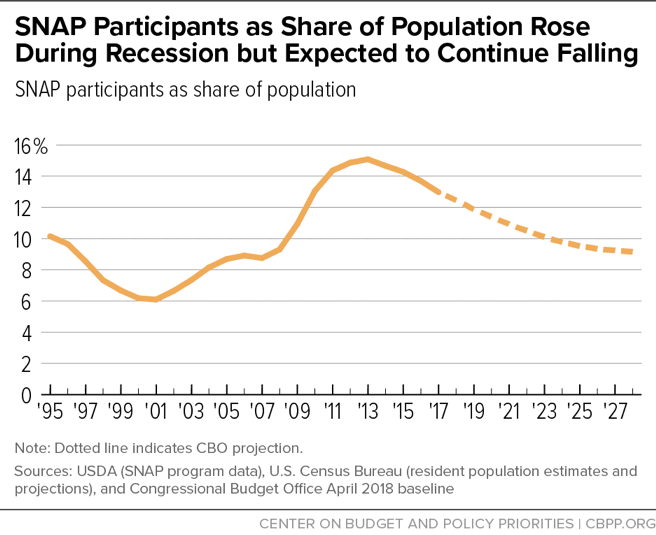
Nationally, the number of SNAP participants fell by about 12 percent between 2013 and 2017. Because the total U.S. population grew slightly over this period, the share of the population participating in SNAP fell by about 14 percent over this period.
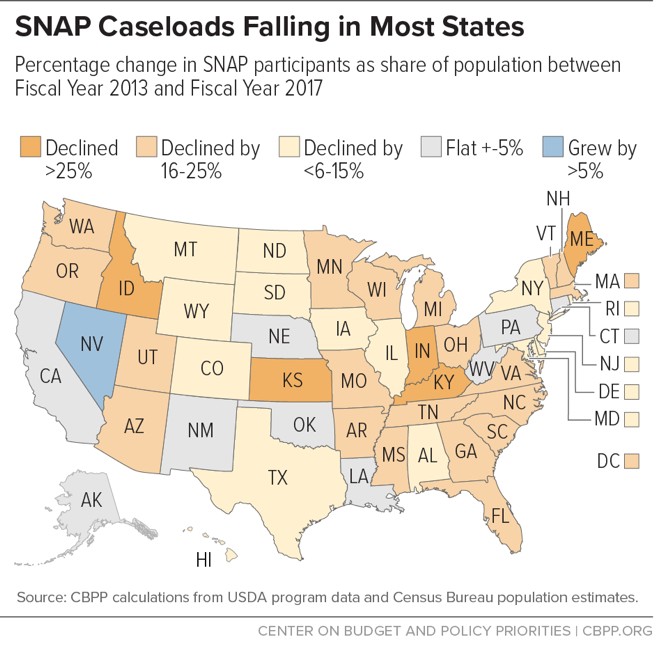
In 47 states, the District of Columbia, Guam, and the Virgin Islands, a smaller share of the population participated in SNAP in 2017 than in 2013.[2] (See Figure 2.) In 25 states and the District of Columbia, the decline in SNAP participation over this period exceeded 15 percent; those states and D.C. accounted for more than half of the national SNAP caseload in 2013. In some states, the share of the state population participating in SNAP had fallen, by 2017, to levels approaching those of 2007.
Participation declines have accelerated in recent years. When compared to the previous year, the national caseload fell by about 2 percent in each of 2014 and 2015, by 3.4 percent in 2016, and by 4.7 percent in 2017. Trends from the first half of fiscal year 2018 indicate that caseloads will likely continue to decline in 2018 at rates similar to 2017.[3]
Why SNAP Participation Remains Above Pre-Recession Levels
The available evidence provides insights as to why SNAP participation remains well above pre-recession levels nationally. As CBO’s forecast implies, some of these factors have begun to abate in coming years and are expected to continue doing so.
Poverty Reduction Has Lagged Economic Recovery, Employment Gains
When the economy begins to emerge from downturns, reductions in poverty — and in SNAP participation — virtually always follow, but usually with a significant lag. CBO explained in 2012:
Even as the unemployment rate began to decline from its 1992, 2003, and 2010 peaks, decreases in [SNAP] participation typically lagged improvement in the economy by several years. For example, the number of SNAP participants rose steadily from about 20 million in the fall of 1989 to more than 27 million in April 1994 — nearly two years after the unemployment rate began to fall and a full three years after the official end of the recession in March 1991.[4]
This isn’t an independent artifact of SNAP. Rather, it’s a reflection of the fact that when the economy recovers from recession, the decline in the poverty rate typically lags the decline in the unemployment rate.
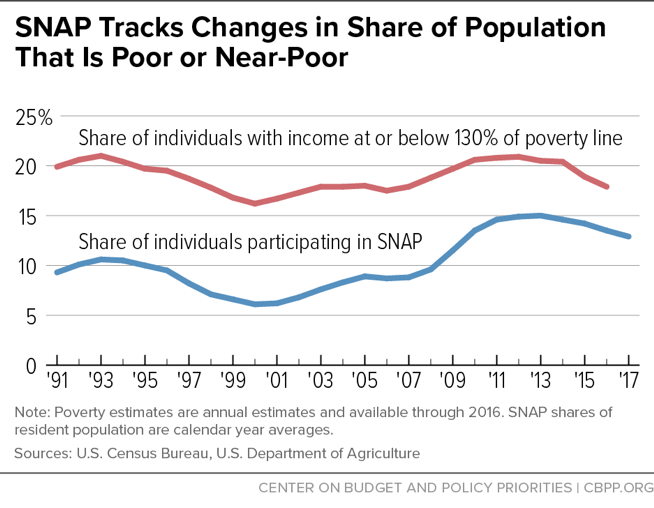
Thus, the poverty rate remained above pre-recession levels through 2015. SNAP’s federally established income limit is 130 percent of the poverty line, so the number of people below that level is a better indicator of need for SNAP than the unemployment rate (or the number of people below 100 percent of poverty). The share of Americans who live below 130 percent of the poverty line rose from about 18 percent in 2007 to 20 percent through 2014, before dropping to 19 percent in 2015 and falling back to 18 percent (the pre-recession level) in 2016. (See Figure 3.) And, the number of people below 130 percent of the poverty line was still about 4 million higher in 2016 than in 2007.
SNAP Participation Rates Among Eligible Households Have Risen Significantly
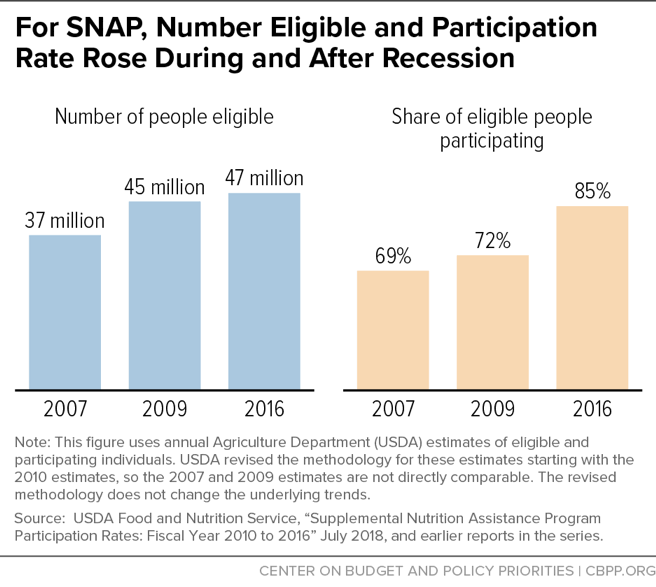
As Figure 4 below shows, there have been pronounced increases both in the number of people eligible for SNAP and in the participation rate among eligible individuals, which rose from 69 percent in 2007 to 85 percent in 2016. These data are from studies conducted for USDA by Mathematica Policy Research.
A number of factors likely contributed to the increase in the participation rate.
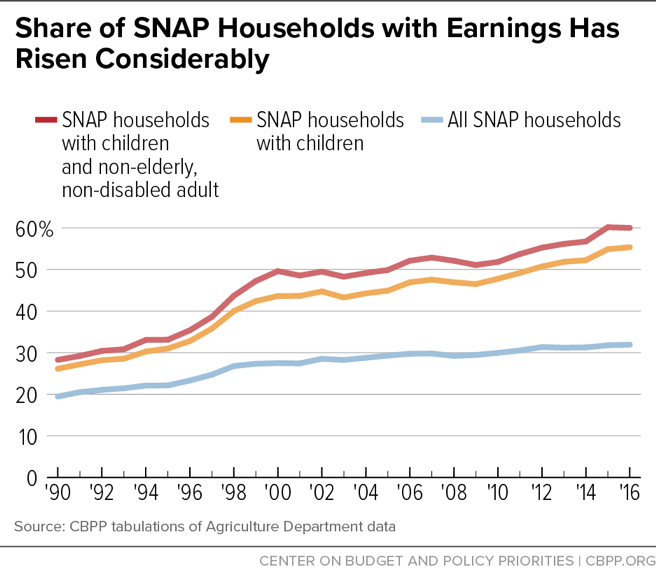
- Many states undertook or continued efforts to reach more eligible households — particularly working families and senior citizens, two groups that have historically had low participation rates. States achieved this primarily by simplifying SNAP policies and the program’s enrollment and renewal procedures, increasingly making use of advances in technology to streamline applicants’ documentation processes and reduce the need for them to make multiple trips to the welfare office. This appears to have been particularly important in spurring enrollment by eligible working-poor families. The share of eligible low-income working families participating in SNAP rose from 57 percent in 2007 to 75 percent in 2016. As a result of this and other factors, the number and share of working families participating in SNAP have risen in recent years. (See Figure 5.) Among the eligible low-income elderly, the participation rate rose from 30 percent in 2007 to 45 percent in 2016.[5]
- The recession may have raised program awareness. Some individuals who may not have previously realized that they were eligible for SNAP, especially people working in low-wage jobs who had little connection to the welfare system, may have gained experience with the eligibility rules and application procedures during a recession-related bout of unemployment and then continued participating after they resumed employment at low-wage jobs. Moreover, in states that expanded Medicaid for low-income adults in recent years, some individuals may have become familiar with SNAP when applying for Medicaid, after becoming newly eligible for that program. (Due to similarities in eligibility for these two programs, most states have integrated the application and other processes for these programs, often allowing applicants to jointly apply to both programs.)
- Take-up of SNAP among eligible households is higher when the benefits are higher, research shows. The 2009 Recovery Act contained a substantial temporary boost in SNAP benefits that likely increased participation. Some of that participation increase may have persisted after the benefit increase ended in November 2013.
- Longer term, the transition away from food stamp coupons almost certainly reduced stigma. More than 20 years ago, SNAP households began using benefits on electronic debit cards that look like other credit cards. This appears to have substantially reduced stigma at the check-out counter, where people paying with food stamps used to be readily identifiable but no longer are.
- Other factors, like rising rental costs, increased stress on low-income families’ budgets. No condition affecting low-income families has worsened more over the last 10-15 years than the shortage of affordable rental housing. Census data show that between 2001 and 2015, the number of low-income renters paying more than 50 percent of their income for housing or living in severely substandard housing jumped a startling 66 percent.[6] The disruption and widespread foreclosures in the housing market during the recession, along with credit constraints in recent years, apparently led many middle-income families that would have been homeowners to become renters, which caused the demand for rental housing to rise faster than the supply, pushing up rents. In addition, most new rental housing construction has been for upscale housing. The added squeeze on family budgets may have led more of these families to seek SNAP assistance to help make ends meet.
In short, SNAP appears to be doing a substantially better job now at reaching groups of eligible households that historically have had low participation rates, particularly households with earnings and the elderly.
Finally, a few states that historically had quite low participation rates, such as California and Nevada, have had substantial increases in their participation rates in recent years. The participation rate among eligible people in California rose from about 48 percent in 2007 to 70 percent in 2015; in Nevada, it rose from 52 percent in 2007 to 81 percent in 2015.[7] SNAP caseloads have declined more slowly in these states than the average rate of decline nationally. For example, in California, the share of the population participating in SNAP declined by only about 4 percent between 2013 and 2017, compared to 15 percent in the rest of the nation.
California has long had one of the lowest SNAP participation rates in the country, due in part to highly restrictive or burdensome procedures that impeded participation, particularly by working-poor families. In recent years, however, California policymakers have sought to address this performance, and the state instituted a series of reforms that have led to a significant increase in the SNAP participation rate. The slow rate of decline in SNAP participation in California and a few other states with relatively large populations is one reason why the national caseload has not declined more steeply.
State Options Played a Role, But a Modest One That Is Now Receding
Two eligibility changes also contributed to SNAP caseload growth during and following the recession: one temporary (and largely reversed by 2017), the other more permanent but with modest effects on SNAP caseloads.
The first involves SNAP’s three-month time limit on unemployed individuals aged 18-49 who are not raising minor children and don’t have a serious disability. Under a provision enacted in 1996, SNAP limits such individuals to three months of benefits out of every three years, unless they are employed or in a work program for at least 20 hours a week. Someone who searches for a job but can’t find one is still cut off after three months. SNAP data show that the average cash income of the individuals subject to the three-month time limit is just 33 percent of the poverty line. No other means-tested program has a comparable provision.
Because of the severity of this provision, it includes waiver authority. States may secure waivers of the three-month time limit for areas with too much unemployment. The 2009 Recovery Act suspended the three-month limit nationally for 2009 and 2010; when the suspension expired in 2010, most states qualified for and secured waivers of the time limit, as unemployment remained elevated. One study estimated that the application of waivers to more areas during this period accounted for 10 percent of the overall growth in SNAP caseloads between 2007 and 2011.[8] But by 2017, with many fewer areas qualifying for waivers, most of that increase had reversed.
More than 500,000 of these adults lost SNAP in 2016 alone in areas that reinstated the three-month time limit that year. SNAP caseloads fell significantly more in states that began cutting people off SNAP again that year due to re-imposition of the time limit than in other states. By 2017, the three-month time limit was back in effect in most of the country, and caseloads continued to decline. Today, the share of the population living in areas where the time limit is in effect is about the same as it was under the George W. Bush Administration before the Great Recession.
The second eligibility-expansion factor is that since 2007, a number of states have adopted or made greater use of a longstanding SNAP state option that allows them to provide food assistance to households — primarily low-income working families and seniors — that have assets modestly above the federal SNAP asset limits, or have gross income modestly above the program’s 130-percent-of-poverty limit. This provision helps households with modest assets receive assistance; the SNAP asset limit for households without an elderly or disabled member is only $2,250.[9] This provision also enables some working households that have gross income modestly above 130 percent of the poverty line but face high child care or housing expenses to qualify.
This provision helps address the inequity that would otherwise exist between the treatment of the minority of low-income working households that receive federal housing or child care subsidies and those low-income households that do not receive such aid and face large child care or housing cost burdens that consume a sizeable share of their income. (Only about 1 in every 4 low-income households eligible for federal rental assistance — and in recent years only about 1 in 6 eligible for federal child care subsidies — receive them.) This option has been available for almost two decades, and the majority of states have elected to use it.
The effect of this provision on SNAP costs and participation is, however, relatively modest. CBO has estimated that use of this option in all states that have adopted it — not just those that adopted it over the past decade — accounts for about 2 percent of program costs and about 5 percent of SNAP participation.[10] The difference between the 2 percent and 5 percent figures reflects the fact that most households gaining eligibility under this option qualify for significantly smaller-than-average benefits. This is another factor in SNAP caseload growth but not a large one.
End Notes
[1] All years here are fiscal years, unless otherwise stated.
[2] You can see each state’s participation on an interactive here: https://www.cbpp.org/research/food-assistance/interactive-map-snap-rose-in-states-to-meet-needs-but-participation-has.
[3] For example, average monthly SNAP participation from November 2017 through April 2018 was about 4.3 percent lower than participation in the same months of the previous year. October 2017 was not included because of elevated SNAP participation in some states due to natural disasters. (SNAP caseloads temporarily increased in response to hurricanes in the fall of 2017. SNAP acts as a first responder in the wake of natural disasters, providing food assistance to vulnerable households. Last fall, SNAP helped households affected by Hurricanes Harvey, Maria, and Irma in Texas, Louisiana, Florida, and the U.S. Virgin Islands.) Rhode Island was also excluded from both years due to data reporting issues.
[4] Congressional Budget Office, “The Supplemental Nutrition Assistance Program,” April 2012, https://www.cbo.gov/sites/default/files/112th-congress-2011-2012/reports/04-19-snap.pdf.
[5] USDA made technical changes in 2010 in the methodology for computing the participation rates, so the pre-recession and 2016 figures aren’t precisely comparable, but the trend is clear.
[6] Alicia Mazzara, “Gap Between Federal Rental Assistance and Need Is Growing,” Center on Budget and Policy Priorities, August 16, 2017, https://www.cbpp.org/blog/gap-between-federal-rental-assistance-and-need-is-growing.
[7] State participation rates among eligible people are only available through 2015.
[8] Peter Ganong and Jeffrey B. Liebman, “The Decline, Rebound, and Further Rise in SNAP Enrollment: Disentangling Business Cycle Fluctuations and Policy Changes,” American Economic Journal: Economic Policy, forthcoming, https://www.aeaweb.org/articles?id=10.1257/pol.20140016&&from=f.
[9] For households with an elderly or disabled member, the limit is $3,500.
[10] The provision allowing states to extend eligibility above the 130 percent levels by aligning SNAP’s rules with those that states set for benefits funded through the Temporary Assistance for Needy Families (TANF) program is known as “categorical eligibility.” CBO estimates that restricting categorical eligibility to households receiving cash assistance under TANF — effectively ending broad-based categorical eligibility — would reduce SNAP spending on benefits by about 2 percent a year. The number of participants eligible because of categorical eligibility is based on the 2016 SNAP Household Characteristics data and earlier CBO estimates of the number of people who would be affected by eliminating this state option.
More from the Authors


Areas of Expertise