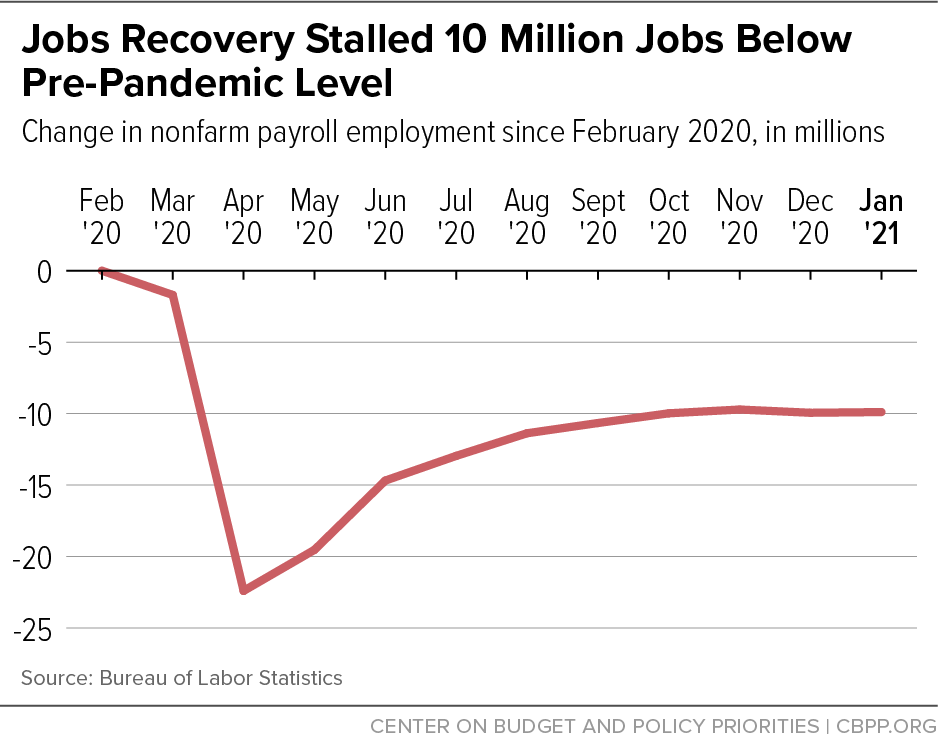
Today’s labor market is much weaker than the headline numbers suggest. Private and government employers have 10 million fewer jobs on their payrolls than they did in February 2020 — a jobs deficit larger in percentage terms than in the worst of the Great Recession. Estimates of a realistic unemployment rate — one that includes people who are not looking for work for pandemic-related health or caregiving reasons — range from 8.3 percent to nearly 10 percent, far above the official 6.3 percent figure. As Federal Reserve Chair Jerome Powell testified recently: “The economic recovery remains uneven and far from complete, and the path ahead is highly uncertain. . . . There is a long way to go.”[1]
Growth in gross domestic product and national income after the economy hit bottom in the second quarter of last year, dominated by high earners and a booming stock market, may create the misimpression that the economy is well on the way to a full recovery. While the economy and the labor market have improved since the plunge in economic activity and employment last spring, a close look at current labor market conditions and the particularly severe burdens the pandemic has imposed on certain groups supports Powell’s sober assessment. Job creation stalled in the second half of the year and job losses remain particularly large in industries that pay low wages. Workers of color, those without a bachelor’s degree, and immigrants have experienced disproportionate job losses. Women have fared worse than men, and mothers of school-age children have been more likely than fathers to drop out of the labor force to meet caregiving responsibilities.
The relief package enacted at the end of the year provides important but temporary help to unemployed workers and others struggling to make ends meet. It should help strengthen the recovery, according to the Congressional Budget Office (CBO) and other forecasters. But robust additional measures, such as those in the economic relief bill now working its way through Congress, are critical for relieving the widespread hardship among families[2] and achieving a full, equitable recovery as quickly as possible.
The following analysis highlights several dimensions of the labor market’s performance in the pandemic and the experiences of different population subgroups.
The COVID-19 pandemic profoundly affected the U.S. economy, causing a steep decline in economic activity and employment between February and April 2020. The economy began to recover following the March enactment of substantial relief and stimulus measures and an easing of some pandemic-related restrictions,[3] with large increases in output and employment in May and June. But the recovery gradually lost momentum over the second half of the year as the large federal supplement to unemployment insurance benefits expired at the end of July, the impact of the economic stimulus payments began to fade, and the virus surged in the fall and winter. No further relief was enacted until late December. The result at year-end was a stalled jobs recovery, a large remaining jobs deficit, and an unemployment rate that significantly understates the number of people not working because of COVID-19 and the scarcity of jobs.
The economic burdens of the pandemic have not been borne equally across the population. People who work in low-wage industries, are Black or Hispanic/Latino,[4] lack a bachelor’s degree, or are foreign-born have been far more likely to lose their job than their counterparts who work in higher-wage industries, are white, have a college degree, or are native born. And women’s job losses were significantly higher (measured as a share of their February 2020 employment level) than men’s in the pandemic’s early months — in contrast to the Great Recession, when men experienced significantly higher job losses — although the gap had narrowed by the end of 2020. Mothers of school-age children, however, were more likely than fathers to be not working or looking for work because they had caregiving responsibilities.
The December coronavirus relief package provided a new round of stimulus payments, increased food assistance benefits through the SNAP program through June, provided new rental assistance for those behind on their rent, and extended expiring unemployment benefits for a few months, among other provisions. Under CBO’s latest economic projections, the labor market will improve this year but payroll employment will still be 5.5 million jobs below its February 2020 level in the second quarter and 3.1 million below in the fourth. CBO projects that the official unemployment rate will be 5.3 percent by the end of the year but the labor force and total nonfarm employment will still be smaller than in the first quarter of 2020. CBO acknowledges that its projections are “subject to an unusually high degree of uncertainty,” including uncertainty about the course of the pandemic itself.[5]
Measures in the economic relief bill to fund COVID-19-control measures, extend unemployment and SNAP benefits, and provide other assistance to struggling families and state and local governments would relieve hardship among those struggling today and substantially increase the likelihood of a robust and speedy recovery, subject to the pace at which COVID-19-control measures allow the easing of pandemic restrictions. Historical experience indicates that the groups experiencing the largest losses in a recession also experience the slowest recovery after the economy turns around, making it all the more important to return to a high-employment economy as rapidly as possible.
Faltering job growth. After a partial bounce-back from a steep plunge in March and April, the jobs recovery slowed and eventually stalled in December and January, leaving almost 10 million fewer jobs on private and government payrolls than in February 2020.[6] (See Figure 1.) In percentage terms, the January jobs hole — 6.5 percent fewer jobs than the previous February — exceeded the worst month of the Great Recession period (6.3 percent).
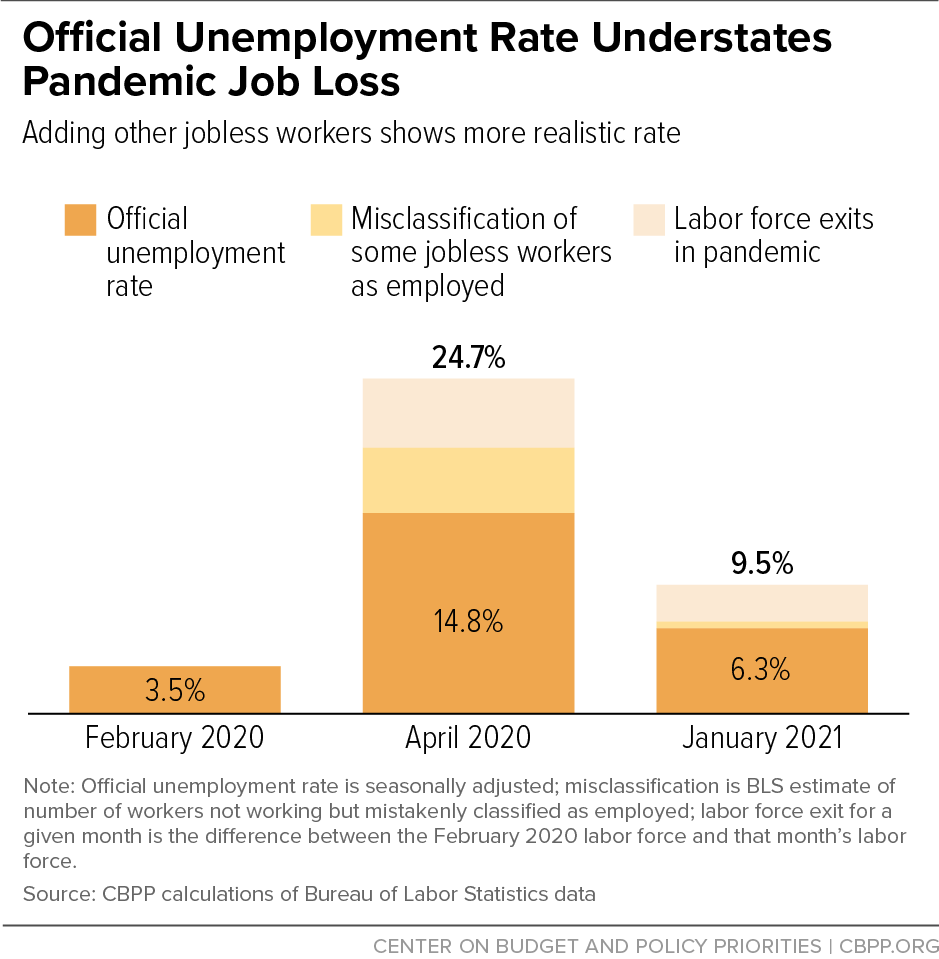
Weaker job market than unemployment rate suggests. At 6.3 percent, the unemployment rate in January 2021 was substantially lower than its 14.8 percent peak in April but still 2.8 percentage points higher than in February 2020. Moreover, the 6.3 percent figure substantially understates the true extent of joblessness, for several reasons.
First, the Bureau of Labor Statistics (BLS) estimates that in January as many as 848,000 people who were not at work were misclassified as “employed” in the survey data from which the unemployment rate is estimated.[7] Reclassifying all of them as “unemployed” would raise the January unemployment rate to 6.9 percent.[8]
Second, many people who would be in the labor force — that is, working or looking for work — in a normal labor market free from the health risks from COVID-19 are not working, either because of COVID-related health or family caregiving reasons (including remote schooling) or because they are discouraged from looking since jobs are scarce. The labor force participation rate, which measures the share of the population that is either working or actively looking for work and counted as unemployed, fell from 63.3 percent in February 2020 to a low of 60.2 percent in April and was a still-depressed 61.4 percent in January 2021; the labor force contracted by 4.3 million workers between February 2020 and January 2021.
Treating all these workers who left the labor force as unemployed and combining them with the 848,000 potentially misclassified workers discussed above “would boost the unemployment rate to close to 10 percent in January,” Federal Reserve Chair Jerome Powell stated recently.[9] (See Figure 2.) Combining a more conservative estimate of the effect of declining labor force participation with the same reclassification estimate, Jason Furman, Chair of the Council of Economic Advisers under President Obama, finds that the “realistic” unemployment rate for January 2021 would be 8.3 percent.[10]
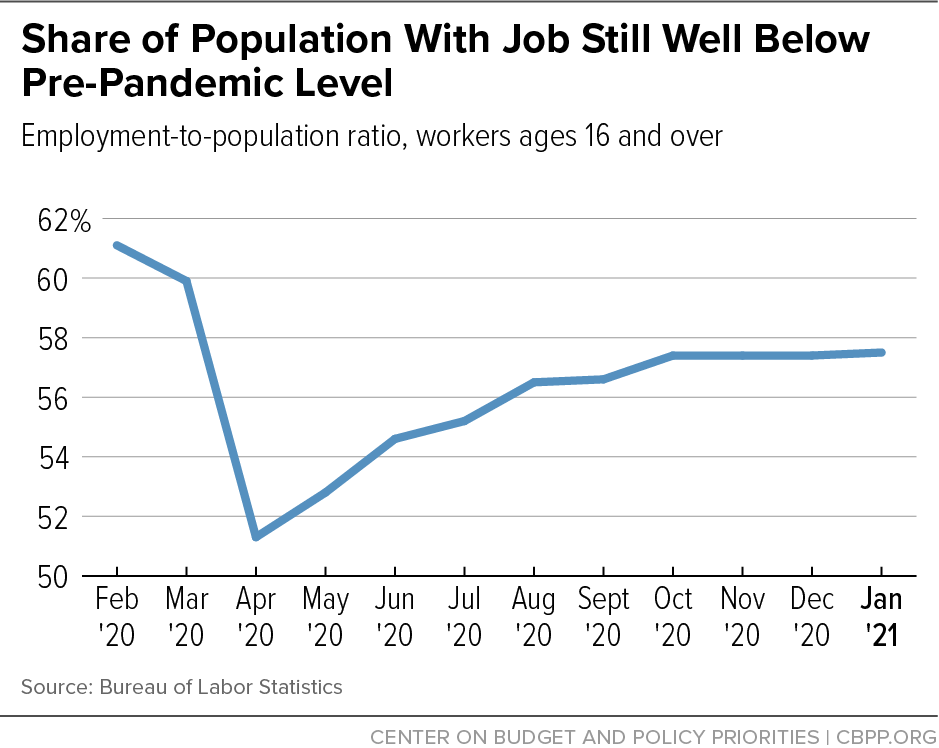
The share of the population with a job, which reflects both the increased unemployment and reduced labor force participation since February and is therefore a more comprehensive measure of job loss than the unemployment rate, has partially recovered from its sharp 9.8 percentage-point drop from February to April 2020. But it has been essentially flat for several months and is still 3.6 percentage points lower than when the recession started. (See Figure 3.)
Finally, almost 6 million people were classified as working part-time for economic reasons in January 2021, meaning they were involuntarily working fewer hours than they would have liked. That is down from a peak of 10.9 million in April but 1.6 million higher than in February 2020. These people are included in a measure of unemployment and underemployment known as U-6, which is the sum of the number of people who are unemployed, marginally attached to the labor force (meaning they want a job but have not looked recently enough to be classified as unemployed), or working part-time for economic reasons, measured as a share of the labor force plus those marginally attached to the labor force. U-6, which does not correct for misclassification, was 11.1 percent in January 2021, up from 7.0 percent in February 2020.
Long-term unemployment rising. The number of long-term unemployed, with spells of 27 weeks or more, nearly quadrupled between February 2020 and January 2021, from 1.1 million to 4.0 million — or almost 2 in 5 unemployed workers. The average duration of existing unemployment spells was 26 weeks in January and the median duration was 15.3 weeks.
Early in the pandemic, job losses were very high but the average unemployment spell was low because so many workers were newly unemployed. Similarly, long-term unemployment fell as a share of total unemployment as the ranks of the newly unemployed swelled. More recently, slightly more people have returned to the labor force to look for work than have become newly unemployed, but the share of the unemployed who are long-term has increased. The additional weeks of unemployment assistance available since March 2020 have provided vital support to the long-term unemployed as they try to make ends meet until more jobs open up in a recovering labor market.
The Census Bureau’s basic monthly Current Population Survey (CPS), which provides the household survey data used in the monthly BLS jobs report, collects basic demographic information on all members of interviewed households. CBPP analysis of those data finds that nearly 28 million people either met the official definition of unemployed or lived with an unemployed family member in January, including nearly 7 million children.[11] These figures are down from April (when 54 million people were in families with an unemployed person) but still significantly above pre-pandemic levels (17.7 million in January 2020). The number of people living with a long-term unemployed family member in January (10.5 million) was also significantly above pre-pandemic levels (3.5 million in January 2020). (See Table 1.)
| TABLE 1 |
| Figures in thousands, not seasonally adjusted |
| |
Jan. 2020 |
Feb. 2020 |
Apr. 2020 |
Dec. 2020 |
Jan. 2021 |
| People age 16 and over |
|
|
|
|
|
| Unemployed |
6,504 |
6,218 |
22,504 |
10,404 |
10,851 |
| Long-term unemployed (27 weeks or more) |
1,217 |
1,177 |
928 |
3,882 |
4,075 |
| Sidelined in the pandemic economy |
|
|
|
15,732 |
16,359 |
| People in families |
|
|
|
|
|
| With unemployed family member |
17,693 |
17,341 |
54,009 |
26,732 |
27,926 |
| With long-term unemployed family member |
3,465 |
3,297 |
2,606 |
9,726 |
10,486 |
| With family member sidelined in the pandemic economy |
|
|
|
38,948 |
40,031 |
| Children in families |
|
|
|
|
|
| With unemployed family member |
4,560 |
4,379 |
12,769 |
6,520 |
6,719 |
| With long-term unemployed family member |
920 |
730 |
558 |
2,039 |
2,208 |
| With family member sidelined in the pandemic economy |
|
|
|
9,635 |
9,759 |
Moreover, as we’ve already discussed, official unemployment statistics badly understate the number of workers deprived of pay amid the pandemic. They only count people who actively looked for work in the last four weeks or reported being on temporary layoff. This omits some 4.7 million workers in January who were not in the labor force and did not look for work in the last four weeks “because of the coronavirus pandemic,” according to supplemental COVID-related questions from the Labor Department.[12] It also omits another 800,000 workers who reported that they had a job but that they were absent from work without pay and lost pay in the last four weeks “because their employer closed or lost business due to the coronavirus pandemic,” we calculate.[13]
When family members are considered, as many as 40 million people in January, including nearly 10 million children, lived in a family where at least one adult did not have paid work in the last week because of unemployment or the pandemic, we estimate.
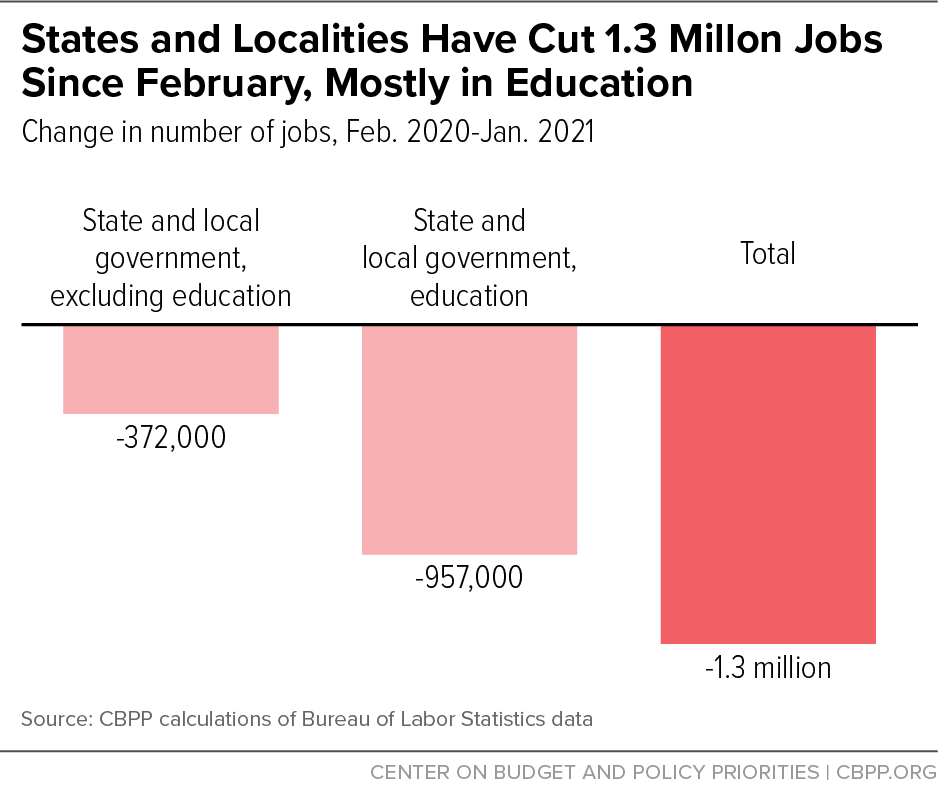
State and local job losses concentrated in education. State and local policymakers began slashing their workforces to help balance their budgets almost immediately after the pandemic began, when tax revenues plummeted as businesses shuttered and people lost their jobs. The worst job losses occurred in April, but as of January 2021 there were still 1.3 million fewer state and local jobs than in February 2020. Almost a million of the lost jobs were in K-12 schools (including teachers and support workers such as bus drivers) or higher education (including college and university faculty and administrators). While social distancing temporarily reduced the need for some of these jobs, such as bus drivers and janitors, these and other jobs that have been lost will need to be restored as students return to schools and campuses. (See Figure 4.)
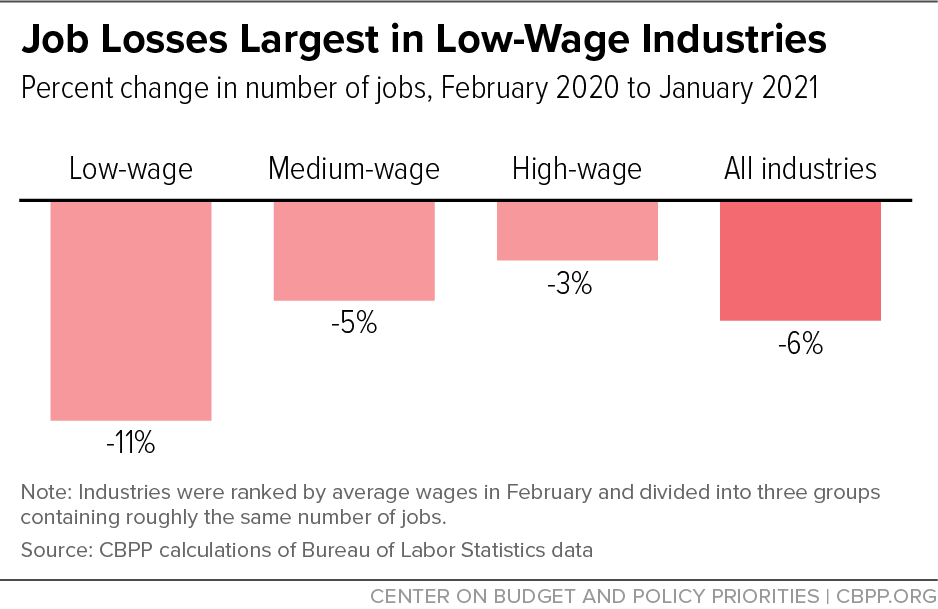
Private-sector job losses concentrated in low-wage industries. The majority of jobs lost during the crisis have come in industries that pay low average wages, with the lowest-paying industries accounting for 31 percent of all jobs but 57 percent of the job losses from February 2020 to January 2021, according to CBPP analysis.[14] Jobs in low-paying industries were down more than twice as much in this period (11.3 percent) as jobs in medium-wage industries (5.2 percent) and nearly four times as much as in high-wage industries (2.9 percent). (See Figure 5.) More than half of the jobs lost in low-wage industries were in the industry category “food services and drinking places.”
On average, workers of color experienced larger job losses in the spring of 2020 and a slower recovery thereafter than white workers; workers without a college degree have been hit harder than those with a bachelor’s degree or higher; and foreign-born workers have been hit harder than native-born workers. Within almost all of these groups, the impact has been more severe for women than for men.
Federal Reserve researchers have found that the lack of in-person education for their children has hindered parents’, and especially mothers’, labor force participation and may explain some of these differences across groups.[15] In particular, the Fed researchers found the following:
- Among mothers aged 25 to 54 with children aged 6 to 17, the share who said caregiving was the reason they were not working or looking for work was 2.5 percentage points higher in the three months ending January 2021 than over the year-earlier period, compared with a 0.5 percentage-point increase for fathers.
- Relative to white mothers, the increase was about twice as large for Hispanic mothers and more than twice as large for Black mothers.
- The increase was more than twice as large for mothers without any college as for mothers with at least some college.
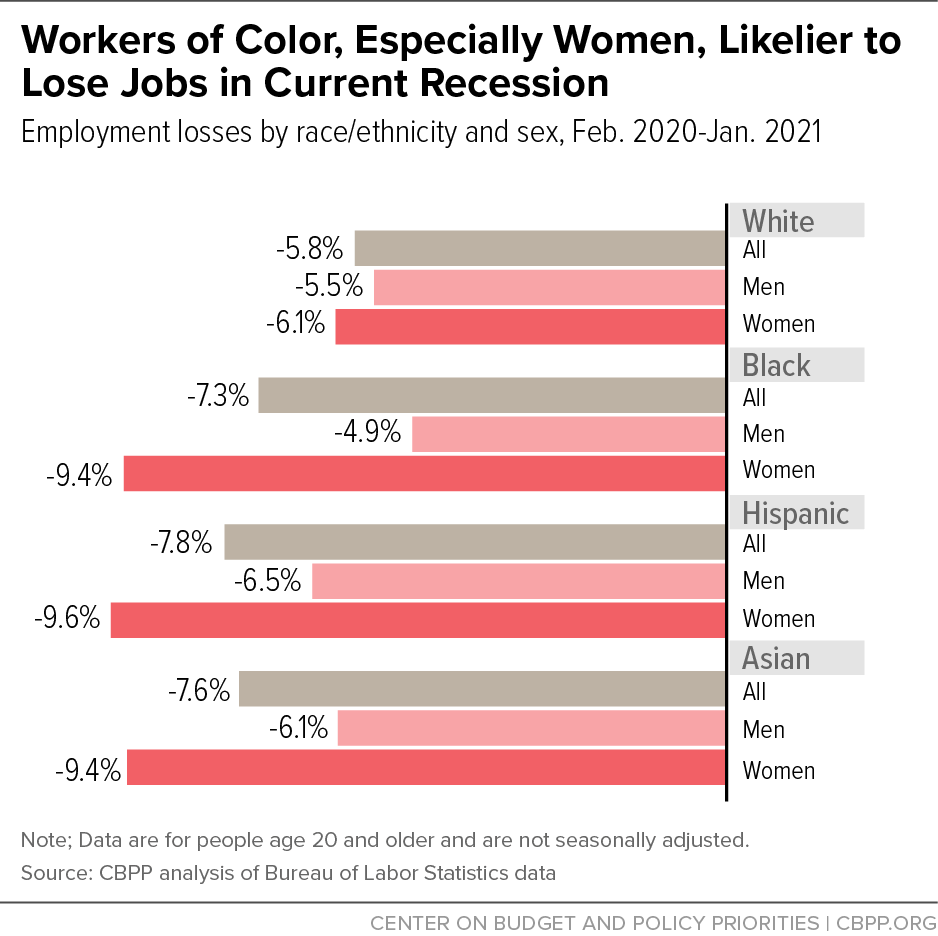
Race, ethnicity, and gender. Black, Hispanic, and Asian workers age 20 or older experienced larger percentage job losses than white workers between February 2020 and January 2021. Within each group, women experienced larger losses than men. (See Figure 6.)
The disparity between Black and white workers reflects patterns that have endured in recessions and recoveries alike, with Black unemployment rising more in recessions and falling more slowly in recoveries.[16] These patterns are rooted in the nation’s history of structural racism, which curtails job opportunities for Black people through policies and practices such as unequal school funding, mass incarceration, and hiring discrimination. As a result, Black workers tend to be “the last hired and first fired.” High unemployment rates for Hispanic workers, which also consistently exceed the white rate, reflect many of the same barriers to opportunity. In January, the Black and Hispanic unemployment rates were 9.2 and 8.6 percent, respectively, compared with a white rate of 5.7 percent.
Asian workers (in data going back to 2003) experienced lower unemployment rates than white workers until the COVID-19 recession, when their higher job losses pushed their unemployment rate above that of white workers, to 6.6 percent in January 2021.
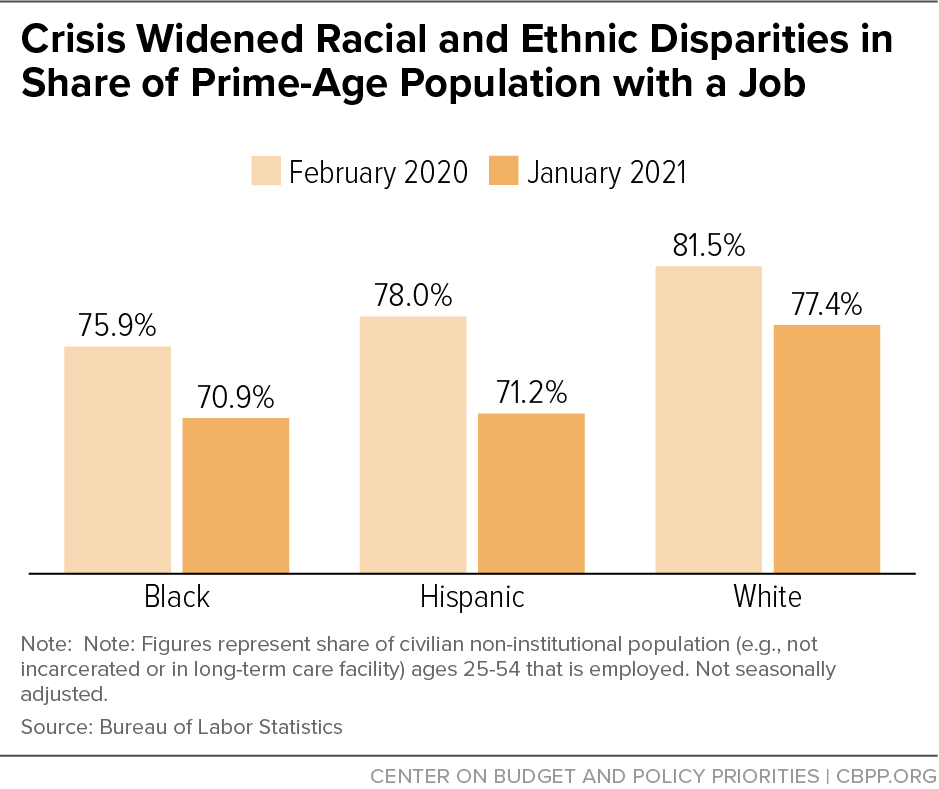
As discussed above, the unemployment rate is an incomplete measure of joblessness because it only includes people who are actively looking for work (or have been laid off but are subject to recall to their former jobs). It does not include people who want a job but have not been looking due to a lack of opportunities or because school and child care closures make working difficult or impossible. The prime-age employment-to-population ratio — the share of the population aged 25-54 with a job — doesn’t have that shortcoming, and it tells a similar story of large, continuing racial disparities: it was lower for Black and Hispanic workers than for white workers when the recession started and has fallen more for them since. (See Figure 7.)
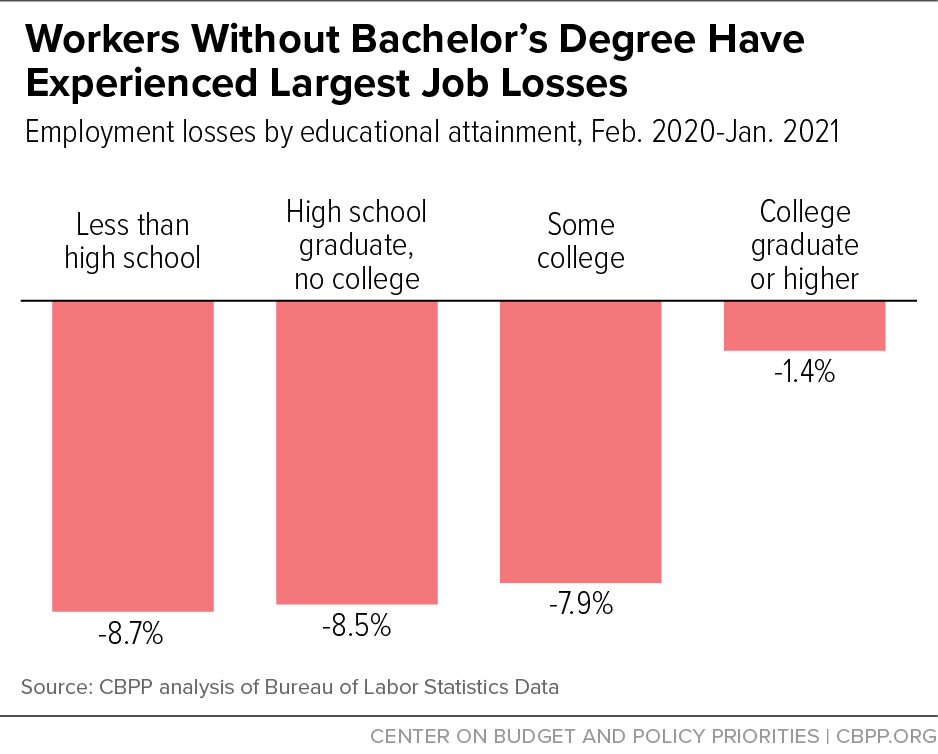
Education. Underscoring the impact of unequal educational opportunities, the number of employed workers age 25 or over with a bachelor’s degree or higher fell by just 1.4 percent between February 2020 and January 2021 but employment fell by 8.5 percent among those who only completed high school. (See Figure 8.) The former had a January unemployment rate of 4.0 percent, compared with 7.1 percent for the latter.
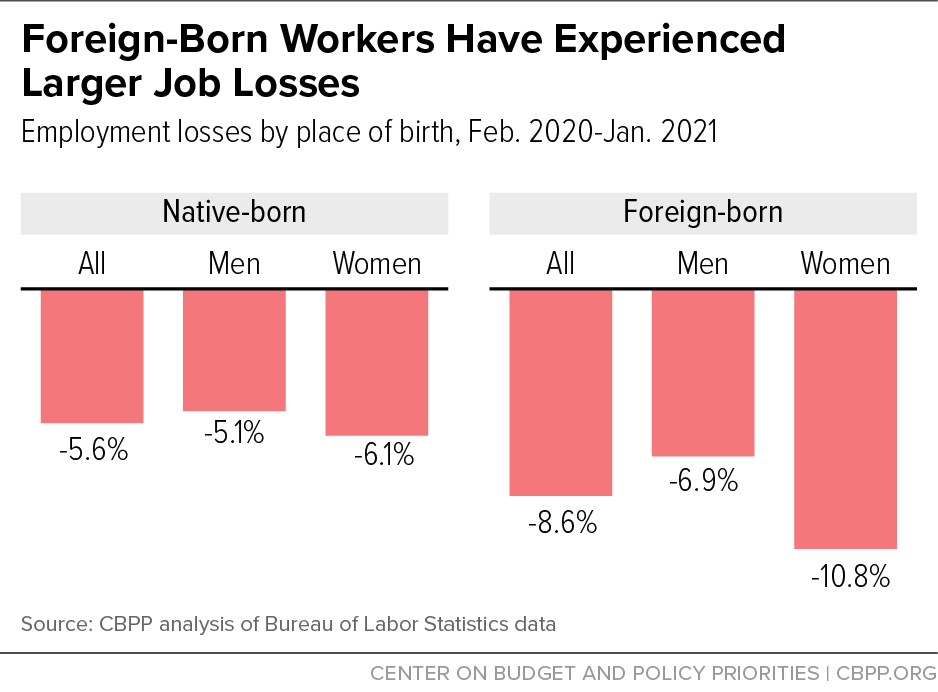
Place of birth. Workers born abroad, especially women, are more likely to work in the industries hit hardest by the pandemic and have suffered disproportionate job losses. In the depths of the recession in April, employment levels for foreign-born and U.S.-born workers were 21 percent and 15 percent below February levels, respectively. These numbers have since improved but a significant gap persists: in January 2021, the number of foreign-born workers with a job was still 8.6 percent below its February level, compared with 5.6 percent for native-born workers. (See Figure 9.) For both groups, employment losses since February have been larger for women than for men.
In January 2021, workers born abroad had a higher unemployment rate (8.1 percent) than workers born here (6.5 percent).[17] Men had similar unemployment rates (7.1 percent and 7.2 percent for the two groups, respectively), but women born abroad had a far higher unemployment rate (9.3 percent) than women born in the United States (6.0 percent).
This pattern is markedly different from 2019, when workers born abroad had a lower unemployment rate (3.1 percent) than workers born here (3.8 percent). Men born abroad had a lower unemployment rate in 2019 (2.7 percent) than men born here (4.0 percent), while unemployment rates for women were similar (3.7 percent and 3.6 percent, respectively).
In the spring of 2020, policymakers provided a swift and substantial response to rising hardship and the threat to the economy from COVID-19, although it was clear even then that more needed to be done in many areas.[18] The economy began to recover in the months that followed, but the recovery was incomplete and uneven and, with no further action, lost momentum later in the year. Groups that experienced especially large losses in the downturn have recovered more slowly than their more advantaged counterparts, and joblessness and hardship remain extremely high. Notwithstanding temporary measures enacted in December 2020, the measures in the emerging relief package are necessary to achieve a strong and more equitable recovery.
