BEYOND THE NUMBERS
K-12 Funding Cuts Include Capital Spending to Build and Renovate Schools
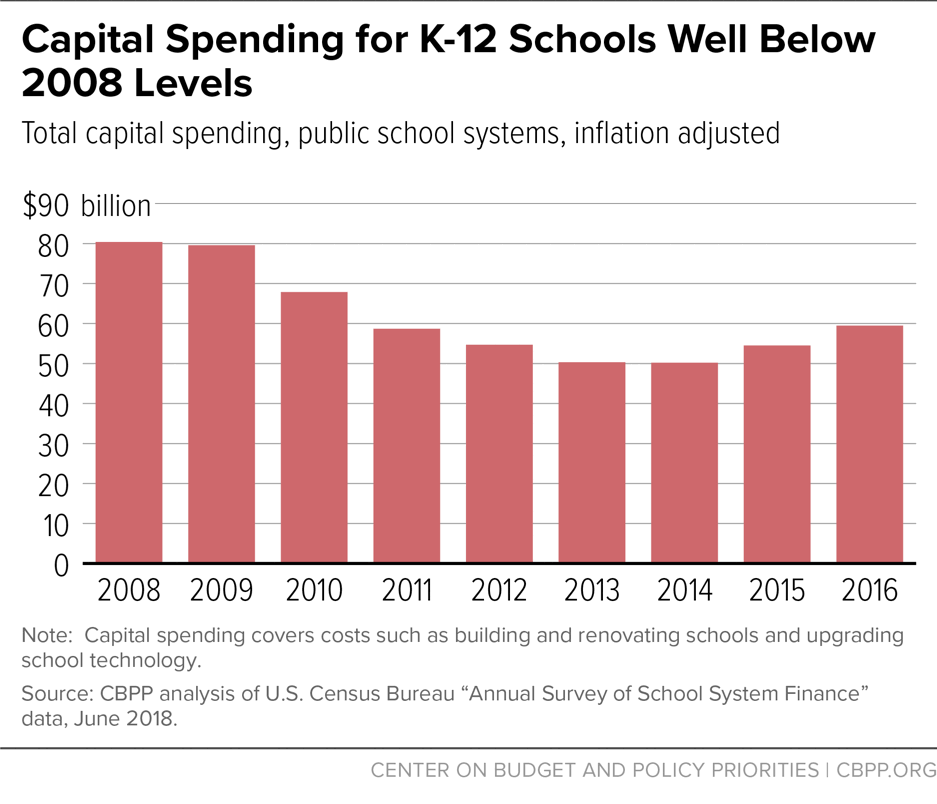
Teacher strikes in Oklahoma, Arizona, and other states highlighted low and declining teacher pay — due in part to large state funding cuts in some states since the Great Recession. Many states have also imposed large school capital spending cuts since then, which has meant less money to build new schools, renovate and expand facilities, and equip schools with more modern technologies, further diminishing the environment in which teachers educate and children learn.
States and localities cut capital spending for elementary and secondary schools nationally by nearly $21 billion, or 26 percent, between fiscal years 2008 and 2016 (the latest year for which we have data), after adjusting for inflation. While states and localities increased capital spending after 2014, the gains fell far short of offsetting earlier, deep cuts. (See graph.)
In 36 states, capital spending fell between 2008 and 2016 — in many cases drastically, as the table below shows. In six states it fell by more than half. Nevada, the state with the sharpest reductions, cut capital spending by 81 percent.
| Change in Capital Spending on Schools, 2008-2016 | |
|---|---|
| Adjusted for Inflation | |
| Nevada | -81% |
| Florida | -71% |
| Arizona | -70% |
| Delaware | -62% |
| Vermont | -55% |
| North Carolina | -53% |
| Georgia | -40% |
| Pennsylvania | -37% |
| Ohio | -36% |
| California | -36% |
| West Virginia | -35% |
| Louisiana | -35% |
| Alabama | -34% |
| Connecticut | -33% |
| Tennessee | -33% |
| Virginia | -33% |
| Colorado | -32% |
| Utah | -32% |
| Michigan | -31% |
| Maryland | -31% |
| Illinois | -30% |
| Idaho | -29% |
| Alaska | -26% |
| Missouri | -26% |
| New Hampshire | -26% |
| Maine | -25% |
| New Jersey | -23% |
| Mississippi | -21% |
| South Carolina | -19% |
| New Mexico | -14% |
| Kentucky | -14% |
| New York | -14% |
| Texas | -9% |
| Indiana | -7% |
| Oregon | -2% |
| Arkansas | -1% |
| Washington | 9% |
| Montana | 12% |
| Iowa | 18% |
| Oklahoma | 24% |
| Massachusetts | 28% |
| Nebraska | 28% |
| Wyoming | 30% |
| Minnesota | 36% |
| Rhode Island | 44% |
| Wisconsin | 44% |
| South Dakota | 49% |
| Kansas | 100% |
| Hawaii | 104% |
| North Dakota | 315% |