BEYOND THE NUMBERS
Geographic Concentration of Poor Health Explains Most of “Disability Belt”
A new Social Security Administration (SSA) study reinforces what research from CBPP and other experts have found: Most geographic variation in the share of residents receiving federal disability benefits stems from variation in the prevalence of disability itself, as well as socioeconomic characteristics. The findings rebut claims that inconsistent program administration or a “culture of disability” account for regional differences in benefit receipt.
Since Social Security Disability Insurance (SSDI) began paying benefits over 60 years ago, analysts have observed a distinct pattern of where beneficiaries live. Researchers analyzing SSDI’s early years identified a “Disability Belt” that included Appalachia, the mid-South, and the Mississippi Delta. Further research after Supplemental Security Income (SSI) began providing disability benefits to low-income people with disabilities confirmed the pattern for both programs. Along with the South, researchers identified pockets of higher disability benefit receipt in isolated parts of the Upper Great Lakes, northern Maine, and the Pacific Northwest.
SSA’s new study helps explains those patterns. It finds that geographic variation in the disability rate accounts for 80 percent of the geographic variation in SSDI receipt and 63 percent of the geographic variation in SSI receipt. (The lower figure for SSI reflects the fact that in addition to having a disability, SSI disability beneficiaries must have very low incomes and assets, and poverty rates vary considerably by region.) The study confirms the findings of a previous study that found that health in a given state strongly predicts SSDI participation there.
Not surprisingly, the geography of disability benefit receipt echoes state variation in common measures and determinants of health status, such as obesity, smoking, diabetes, cardiovascular disease, cancer, and life expectancy. Disability rates also vary greatly among metropolitan areas, as does life expectancy among lower-income residents.
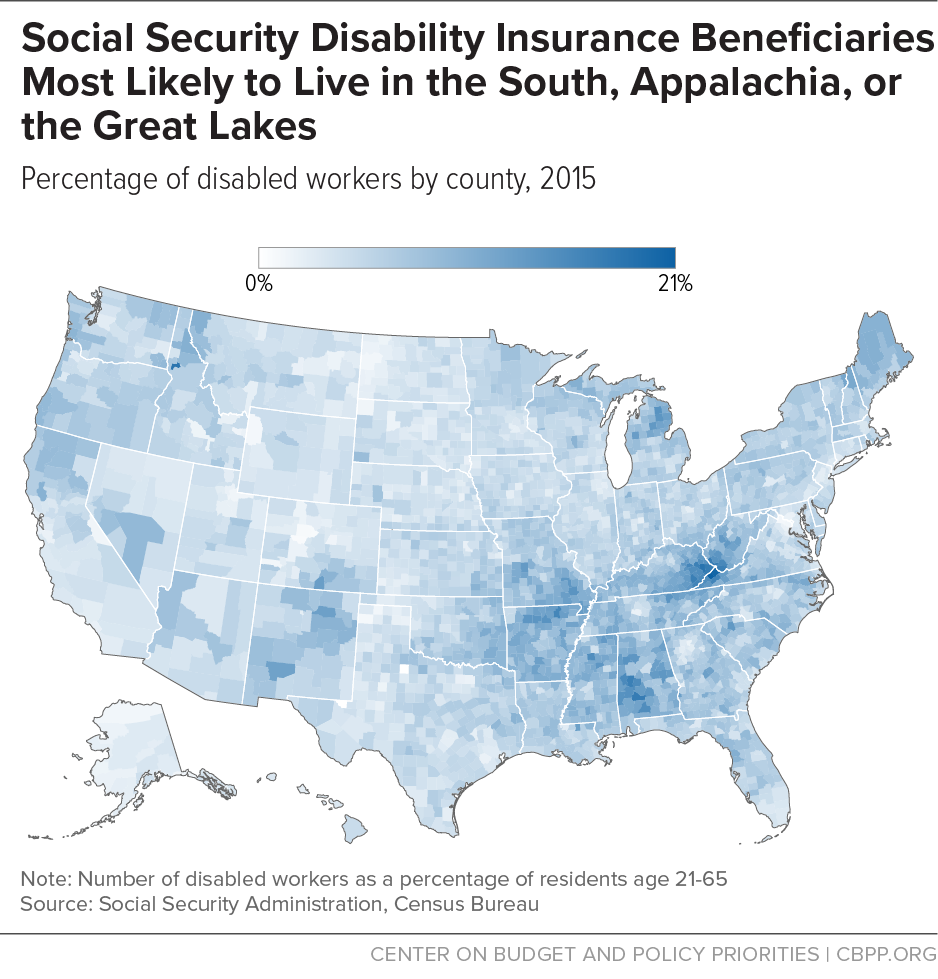
Health and longevity, in turn, are highly influenced by socioeconomic factors, like wealth and education. The higher a person’s socioeconomic status — whether measured in earnings, income, or education — the longer her life expectancy and the better her health. So it’s no surprise that areas with higher rates of disability receipt tend to have populations that are less educated, more blue-collar, and older, as a 2015 CBPP analysis found. Areas along the Washington-to-Boston corridor, much of the West Coast, and in the Great Plains and Mountain West have relatively few disability beneficiaries. (See map.)
Socioeconomic status is also important for another reason. Whether a physical or mental impairment is disabling for a particular person — that is, whether it prevents her from performing substantial work — depends on her circumstances. People with limited education aren’t just likelier to experience serious health problems; they’re also less likely to be able to adjust to different work due to their limited skills. Likewise, people in physically demanding jobs tend to have worse health and their skills don’t transfer as readily to other, less arduous types of work. Federal disability program rules reflect this reality, requiring applicants to prove that their impairment prevents them from supporting themselves through work — even in different, less demanding jobs — considering their age, education, and work experience.
Examining the geographic pattern of disability receipt gives a valuable perspective on how SSDI and SSI — even with their strict eligibility rules and modest benefits — protect some of the nation’s most vulnerable people.