BEYOND THE NUMBERS
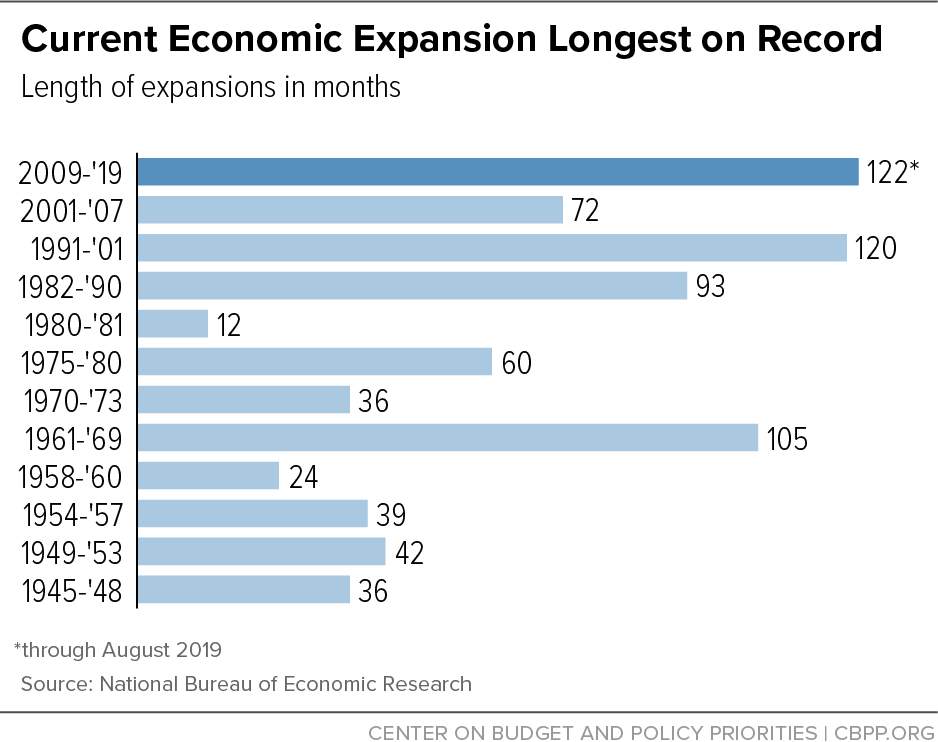
June 2019 is the 120th month since the Great Recession ended in June of 2009, tying this expansion for the longest on record with the expansion of 1991 to 2001 (see chart). This expansion will become the longest on record next month — barring an extremely unlikely collapse in economic activity that would prompt the National Bureau of Economic Research, the recognized arbiter of business-cycle dating, to later determine that a recession began in June or July.
We’re tracking the economic expansion in a new chart book. “Tracking the Post-Great Recession Economy” replaces “The Legacy of the Great Recession.” A final version of the latter, which covers the decade from the start of the Great Recession in December of 2007 through December of 2017, is here.
The new chart book tracks the current economic expansion and the economy’s evolution since President Trump took office in January of 2017, both in terms of how the expansion compares with other expansions of the past several decades and how recent economic performance compares with Trump’s claims of what his policies will accomplish.
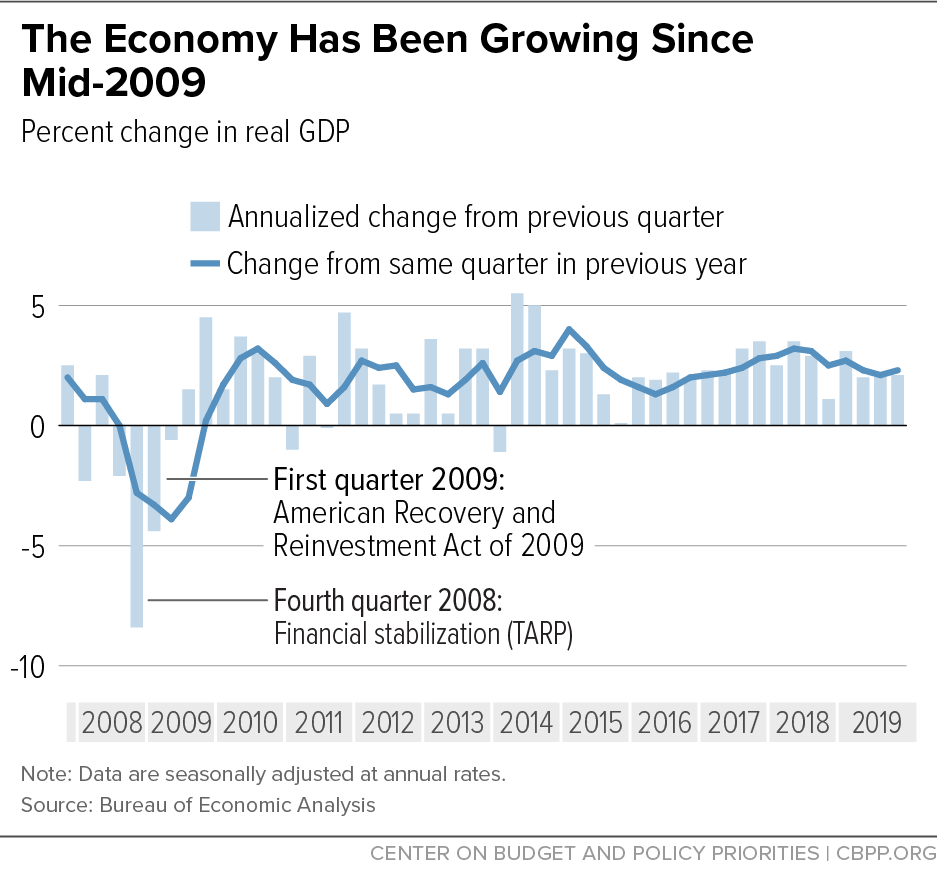
The new chart book will include versions of familiar charts from the now-retired one, with monthly updates of economic growth and labor market statistics in the first section on recovery and expansion after the Great Recession, such as this:
It will also include new sections on:
- Achieving and maintaining full employment, with charts tracking the Federal Reserve’s efforts to meet its employment and inflation targets, alternative measures of labor market strength, racial disparities in unemployment, and long-term unemployment.
- Prospects for economic growth and earnings, with charts on the effect of the Great Recession on future growth prospects, why the Trump Administration’s growth projections are highly unrealistic, and the widening gap since the early 1970s between workers’ productivity (output produced per hour of work) and their hourly compensation (wages plus benefits).
- International trade, federal budget deficits, and growth, with a discussion and charts describing the nexus between international payments flows, federal budget deficits, and future economic growth that provides context for understanding (1) the flaws in Trump’s argument that a trade deficit makes the United States “losers” in international trade and justifies a trade war and (2) the consequences for future payments imbalances, budget deficits, and economic growth from the President’s tax cuts.
The new chart book will get its first update with tomorrow’s jobs report.


