BEYOND THE NUMBERS
Countdown to Tax Day: Where Do Our Federal Tax Dollars Go?
Across the country, many people are putting final touches on their tax returns while many others are eagerly awaiting refunds. As Tax Day — which this year is April 18 for most filers — approaches, we’ll highlight ten federal tax charts to provide some tax policy context.
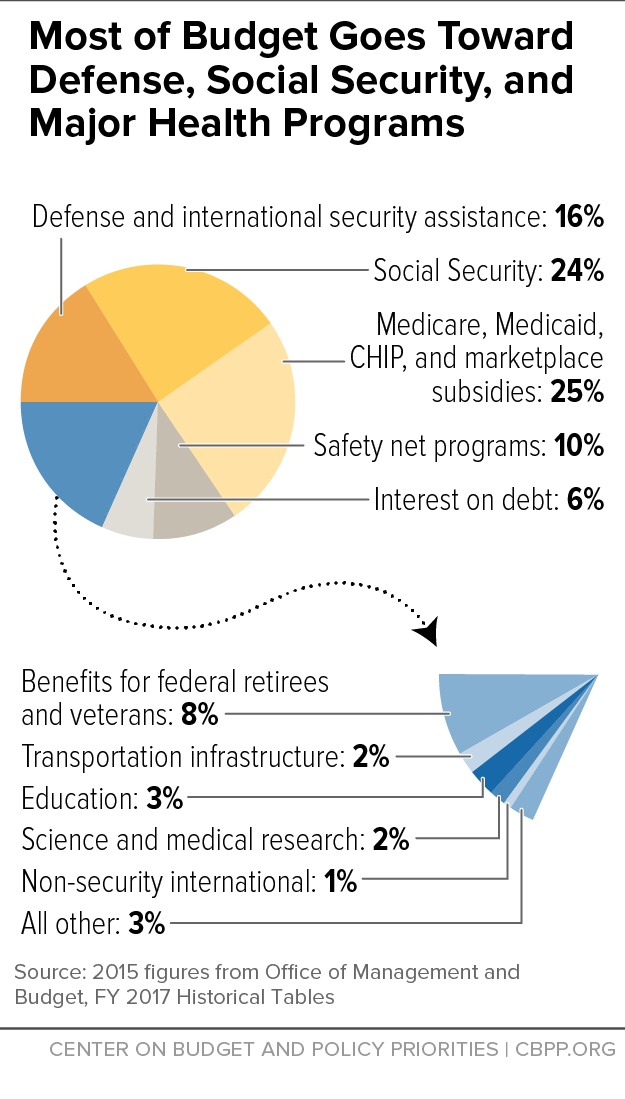
Our first chart reminds us why we pay taxes by showing where the money goes. Three large areas account for roughly two-thirds of the budget: health programs such as Medicare, Social Security, and defense and international security assistance. The safety net (including programs like SNAP and unemployment insurance) plus interest on the debt make up roughly another sixth.
The remainder — roughly 20 percent — is everything else, from infrastructure to science research, the FBI, education, veterans’ programs, and so on.
So, a part of almost every tax dollar goes to things like a safer highway bridge, a new hip for an elderly person, a soldier’s gear, or diabetes research.