That's all the analysis on 2022 Census data that we'll be posting here. Watch our other spaces for our expert analysis on these and other issues.
off the charts
POLICY INSIGHT
BEYOND THE NUMBERS
BEYOND THE NUMBERS
Analyzing the Census Bureau’s 2022 Poverty, Income, and Health Insurance Data
Census Data Show Health Coverage Gains in 2022, Point to Policy Priorities
The rates of people in the U.S. without health insurance hit all-time lows in 2022, this week’s Current Population Survey and American Community Survey (ACS) data confirmed.
The data show that policy can drive major coverage gains. In particular, the drop in the uninsured rate was driven by pandemic-era Medicaid protections, Affordable Care Act (ACA) Medicaid expansions, and policies that improved access and affordability in the ACA marketplace. Although the recent expiration of pandemic-era Medicaid protections is now causing many to lose their coverage, the policies that led to 2022’s historically low uninsured rate provide a roadmap to future coverage gains.
I’ve detailed more about the ACS findings in a separate post.
ACS Data Show Narrowing of Coverage Differences by Income, Race and Ethnicity
As I discuss in my blog post, the uninsured rate declines were largest among lower-income groups. The number of uninsured people fell by 1.4 percentage points among people with incomes below 138 percent of the poverty threshold (roughly $32,500 for a family of three), which is generally used as the eligibility threshold for Medicaid coverage in states that have expanded Medicaid. The uninsured rate fell 0.8 percentage points among people with incomes of 138 to 399 percent (roughly $32,500 to $94,100 for a family of three) of the poverty threshold. Meanwhile, the uninsured rate held roughly steady among people with incomes at or above 400 percent of the poverty threshold.
The uninsured rates for Black people and Latino people, groups with higher uninsured rates due to systemic racism and discrimination in areas such as education and employment, each fell by 0.9 percentage points to all-time lows. The uninsured rate for American Indian and Alaska Native people, who also have high uninsured rates and tend to be employed in jobs that do not offer employer coverage, fell by 1.1 percentage points to a record low. The uninsured rates for Asian people and white people each fell by 0.4 percentage points, also reaching record lows.
States That Expanded Medicaid in 2021 Saw Large Declines in Uninsured Rates
Uninsured rates fell steeply in Oklahoma and Missouri — the two states that expanded Medicaid in 2021 — today’s American Community Survey data show. The uninsured rates in Oklahoma and Missouri declined by 2.1 and 0.8 percentage points, respectively.
While striking, these findings are not surprising: states typically see big drops in uninsured rates after they expand Medicaid. The results are also consistent with the fact that since they each expanded, administrative data show that Medicaid enrollment increased far more in Oklahoma and Missouri than in any other state.
Most recently, South Dakota expanded Medicaid in 2023. North Carolina adopted expansion but is still working out the details of when it will be implemented.
American Community Survey Data Confirm Record-Low Uninsured Rate Reached in 2022
As expected, the uninsured rate reached an all-time low in the American Community Survey (ACS) data released today, falling to 8.0 percent. That’s well below the previous record low of 8.6 percent achieved in 2021 and 2016.
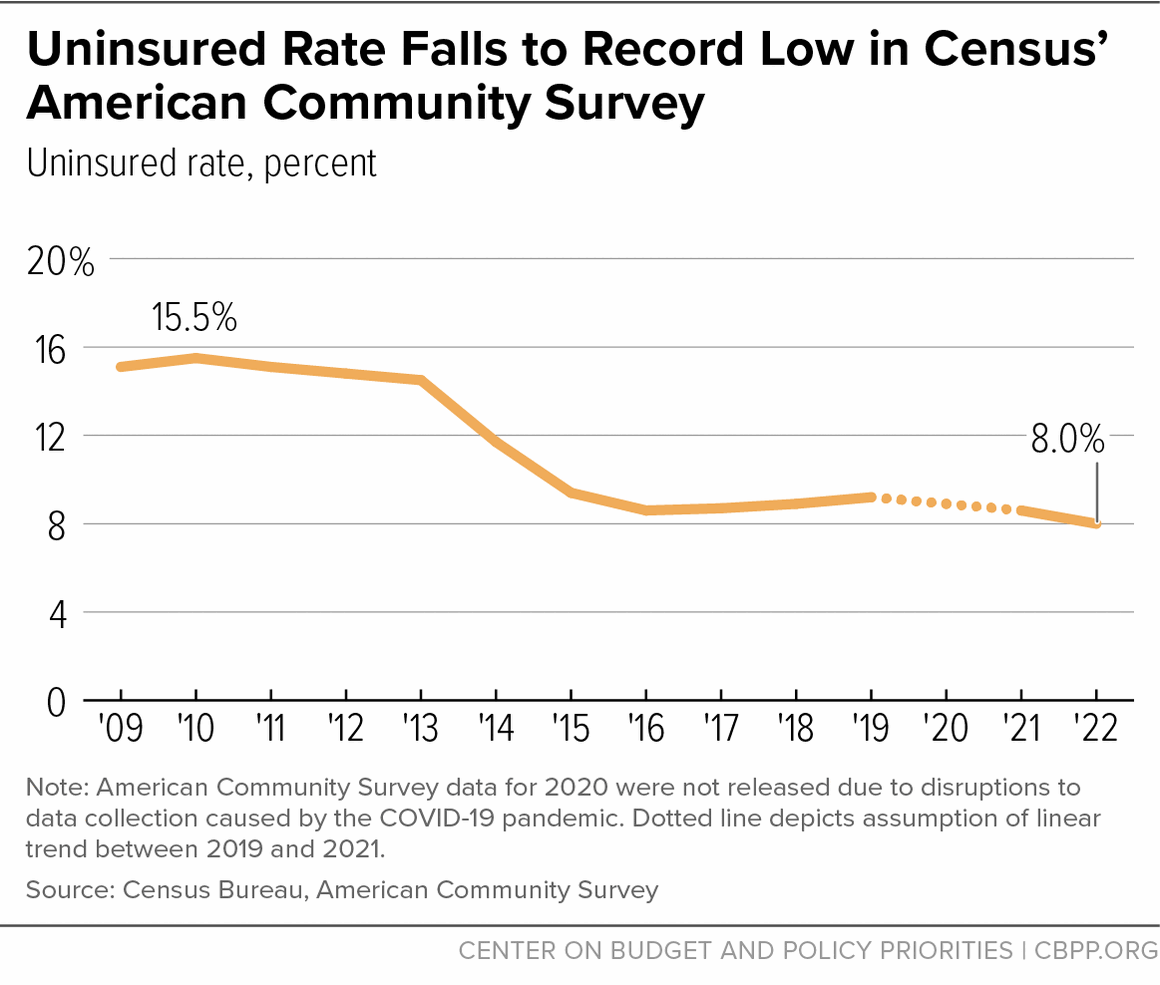
That makes it unanimous: the ACS, Current Population Survey, and National Health Interview Survey all recorded all-time low uninsured rates in 2022.

I’ll be back soon with more analysis of what the ACS data show and how that fits within our current policy context.
That's it for today. We'll continue to update this page with further analyses, notably including health data in the American Community Survey on Thursday.
Full Statement Posted: Record Rise in Poverty Highlights Importance of Child Tax Credit; Health Coverage Marks a High Point Before Pandemic Safeguards Ended
CBPP President Sharon Parrott released her full statement on the 2022 Census poverty, health, and income data that were released today.
Stay Tuned for ACS Data Release on Thursday
Stay tuned for the American Community Survey (ACS) data release on Thursday. The ACS has maintained a more consistent series over time than the Current Population Survey (CPS), and is much larger than both the CPS and the National Health Interview Survey.
Given that the ACS uninsured rate in 2021 already tied a record low, and other surveys have shown major uninsured rate declines in 2022, we expect the ACS will reach an all-time low uninsured rate for 2022. With its large sample size, the ACS data will also offer a great opportunity to see what happened in individual states and among smaller demographic subgroups.
New Census Data Reveal Near Full Reversal of Recent Narrowing in Racial and Ethnic Differences in Child Poverty
After economic assistance in effect for 2021 helped drive racial and ethnic differences in child poverty to their lowest level ever, those gaps reopened in 2022, nearly to their pre-pandemic levels. This reflects the capacity — and critical need — for economic assistance like the Child Tax Credit to promote well-being for children and families of color in the face of discrimination and governmental underinvestment in communities that have limited opportunity for their parents.

Black and Latino people entered the pandemic with lower income and fewer assets due to discrimination and other structural barriers to opportunity. This meant that many elements of the pandemic response that targeted those with the greatest need had particularly large, positive impacts on Black and Latino people.
In 2021, when pandemic assistance measures including the American Rescue Plan’s Child Tax Credit expansion and stimulus payments were still in place, the poverty rates for Black and Latino children were 6 percentage points higher than for white children. These differences were the narrowest they’ve ever been, with data going back to 1970, making the Child Tax Credit a critical tool toward eliminating these differences altogether while advancing opportunity for all children.
In 2022, the expiration of pandemic assistance drove the poverty rate for Black children to a level 11 percentage points higher than for white children. For Latino children, it was 12 percentage points higher. This largely reversed recent progress. Pre-pandemic, in 2019, the poverty rate for Black children was 14 percentage points higher, and for Latino children was 13 percentage points higher, than for white children. Those were record lows at the time — again, with data going back to 1970.
The Rescue Plan’s one-year Child Tax Credit expansion in 2021 played a key role in this historic narrowing of racial and ethnic differences in child poverty. Making the full Child Tax Credit available to children in families with low incomes lowered child poverty among all races and ethnicities and especially helped Black and Latino children, whose families are overrepresented in low-paid work due to past and present hiring discrimination, inequities in housing opportunities, less access to good schools, and other sources of inequality.
By lifting larger shares of Black and Latino children above the poverty line, the Child Tax Credit expansion narrowed differences in child poverty rates by race and ethnicity. If the expansion had been renewed, it would have kept 5.9 percent of Black children and as much as 5.2 percent of Latino children above the poverty line in 2022, as well as 2.8 percent of white children.
After 2021, Congress allowed the Child Tax Credit to return to an earlier, smaller, and less equitable design that denies full participation in the credit to families with low or no earnings. Because children in families with low incomes currently cannot receive the full Child Tax Credit, roughly 46 percent of Black children, 39 percent of American Indian or Alaska Native children, 37 percent of Latino children, 17 percent of white children, and 15 percent of Asian children get less than the full credit or no credit at all, we have previously estimated using data that allow us to analyze a wider range of racial and ethnic groups.
Making the Child Tax Credit more available to these children would lower the number of them experiencing poverty, push back against long-standing inequities, and ensure all families can offer their children a stronger foundation of income security and opportunity.
CPS Record-Low Uninsured Rate Consistent With National Health Interview Survey Data
The Current Population Survey (CPS) is not the first major survey to find a record-low uninsured rate in 2022. Last month’s release of preliminary 2022 National Health Interview Survey (NHIS) data found that the uninsured rate fell to 8.4 percent in 2022, down from 9.2 percent in 2021 and easily falling below the previous record of 9.0 percent reached in 2016. One difference is that the CPS 2022 uninsured rate matched its record low achieved in 2017 and 2016, while the NHIS 2022 uninsured rate fell to a new record low.

ACA Marketplace and Medicaid Policies Drove Coverage Gains
As I mentioned in my earlier post, administrative data show that coverage gains were mostly due to enhanced premium tax credits for people with Affordable Care Act (ACA) marketplace coverage and the pandemic-related continuous coverage requirement that safeguarded coverage for people enrolled in Medicaid. Expanded enrollment periods for marketplace coverage and increased outreach and enrollment assistance also played big roles.
Administrative data illustrate the enormous role that the ACA marketplace and Medicaid played in boosting coverage.
A record 15.7 million people were enrolled in the ACA marketplace in February 2023, up 40 percent from 11.2 million in February 2021, prior to the premium tax credit enhancements.

Over 94 million people were enrolled in Medicaid and Children’s Health Insurance Program coverage in April 2023, a record level and up from roughly 71 million in February 2020.

States That Expanded Medicaid Maintained Far Lower Uninsured Rates
The uninsured rate in states that expanded Medicaid under the Affordable Care Act, at 8.4 percent, was about half the 16.2 percent uninsured rate in non-expansion states. This is a perennial finding and not a surprise, given that numerous studies show that Medicaid expansion boosts overall coverage. The difference remains striking and highlights that the uninsured rate, like poverty, reflects policy choices. States that have refused to adopt the expansion have made an affirmative choice to have more people without health coverage — a choice that results in poorer health, more medical debt, and higher mortality.

Declines in Uninsured Rate Among Latino and Black Adults Were Particularly Steep in 2022
Today’s Current Population Survey (CPS) data also show that the declines in the uninsured rate were particularly steep among Latino and Black adults under age 65, who historically have higher uninsured rates due to factors such as immigration-related restrictions and systemic racism and discrimination in areas such as education and employment.
For Latino people aged 19-64, the uninsured rate dropped from 25.1 percent in 2021 to 23.4 percent in 2022. And the uninsured rate for Black people aged 19-64 fell from 12.7 percent to 11.4 percent. That compares to a smaller drop for white people aged 19-64, from 7.5 to 6.8 percent, and a statistically insignificant decline for Asian people aged 19-64, two groups that historically have had lower uninsured rates.
If Child Tax Credit Expansion Had Been Renewed, 3 Million Fewer Children Would Have Been in Poverty in 2022
Driving the historic rise in child poverty in 2022 was the expiration of pandemic-era relief programs, including Congress’s decision to allow the expiration of the 2021 Child Tax Credit expansion. Renewing the expansion — which President Biden and many in Congress supported — would have kept about 3 million children above the poverty line in 2022, avoiding more than half of the actual rise in child poverty, we calculate using Census data released today. The child poverty rate in 2022 would have been about 8.4 percent rather than 12.4 percent.
Instead, the number of children in poverty more than doubled, from 4 million in 2021 to 9 million in 2022.

The Rescue Plan’s Child Tax Credit expansion raised the maximum credit amount from $2,000 to $3,600 for children under 6 and to $3,000 for children aged 6-17 (the first time 17-year-olds were included). Most importantly, for the first time, it made the Child Tax Credit “fully refundable,” meaning the full credit was available to children in families with low or no earnings.
When the expansion expired at the end of 2021, the credit reverted to the flawed design in place under the prior law — namely that the families who need help the most get less than middle- and higher-income families. Given that this flawed design remains in place today, it’s likely that these higher child poverty rates will continue beyond 2022 unless Congress acts.
An estimated 19 million children — or more than 1 in 4 children under age 17 — get less than the full Child Tax Credit or no credit at all under current law because their families earn too little, while families with much higher incomes (up to $400,000 for married couples) receive the full $2,000 credit for each child.
Another major factor in the increase in poverty in 2022 was the expiration of pandemic stimulus payments, which were meant to be temporary. The Rescue Plan’s stimulus payments provided $1,400 per person and kept a similar number of children above the poverty line in 2021 as the Child Tax Credit expansion.
Historic Increase in Child Poverty Driven by Expiration of Pandemic Relief
Today’s Census figures show a historic increase in poverty in 2022 driven by the expiration of pandemic assistance including the American Rescue Plan’s Child Tax Credit expansion, according to Census’ Supplemental Poverty Measure (SPM).
Overall poverty and child poverty rose in 2022 by the largest amount on record both in Census’ SPM data, which starts in 2009, and in our own analysis of SPM data back to 1967, produced by Columbia University researchers. SPM is the broader of Census’ two main poverty measures, as it accounts for taxes and non-cash benefits.
This historic increase in child poverty, by 7.2 percentage points, contrasts sharply with recent progress. It follows two years of historic drops.

2022’s poverty increases were driven by the expiration of the American Rescue Plan’s expanded Child Tax Credit and by the end of $1,400 stimulus payments. The role of the expiring expanded credit, which many policymakers want to again expand, in driving up poverty underscores that the number of children living in poverty is a policy choice.
President Biden has made clear that expanding the Child Tax Credit to reduce child poverty is a top priority, and recently there have been encouraging signs of bipartisan interest. Income supplements like the Child Tax Credit have been found to help children perform better in school and make lasting gains in adult health and earnings.
Census CPS Data: Uninsured Rate Matched Lowest Ever in 2022
The uninsured rate matched a record low of 7.9 percent in 2022, down from 8.3 percent in 2021 and 8.6 percent in 2020, according to Current Population Survey (CPS) data released today by the Census Bureau.
These data are broadly consistent with preliminary data from the National Health Interview Survey (NHIS) released in August, although the NHIS data showed a new record low while the CPS data matched the record low achieved in 2017 and 2016.
Administrative data show that health coverage gains were mostly due to the pandemic-related continuous coverage protection that safeguarded coverage for people enrolled in Medicaid and the enhanced premium tax credits for people with Affordable Care Act (ACA) marketplace coverage, along with expanded enrollment periods and increased outreach and enrollment assistance for marketplace coverage.
Analyzing health insurance trends using CPS data is difficult due to survey redesigns, changes in data processing systems, and pandemic-related data collection disruptions. But looking at prior years’ data, aided by a special Census “bridge” file for 2017 and “research” file for 2016 to compare the updated data to the older data, it is very likely that the CPS uninsured rate in 2022 matched the lowest ever.

Today’s Census data release arrives as millions of people are losing their Medicaid coverage due to the “unwinding” of the pandemic-related provision that barred states from disenrolling Medicaid enrollees from March 2020 through March 2023. Already, about 6 million people have lost Medicaid coverage since April 1, 2023, including many who are likely still eligible. And millions more will follow well into 2024. That coverage loss isn’t reflected in the 2022 data released today.
Looking ahead, policy action is needed to build upon the historically low uninsured rate in 2022. Policymakers should make it easier for eligible people to enroll in and maintain Medicaid and other health coverage. Congress should make the ACA marketplace premium tax credit enhancements — first enacted in 2021 and currently set to expire after 2025 — permanent. Policymakers should also eliminate immigration-related barriers to affordable health coverage and close the Medicaid coverage gap by providing a pathway to coverage for roughly 2 million people with incomes below the poverty level who live in states that have refused to expand Medicaid.
Parrott: Record Rise in Poverty Highlights Importance of Child Tax Credit; Health Coverage Marks a High Point Before Pandemic Safeguards Ended
CBPP President Sharon Parrott has commented on today's Census data. Full statement to follow:
“Today’s stunning rise in poverty is the direct result of policy choices — including Congress’s decision to allow the successful Child Tax Credit expansion to expire. Policymakers should expand the Child Tax Credit this year and reverse this troubling trend.
The number of people with incomes below the poverty line in 2022 rose a sobering 15.3 million, today’s Census data show, reflecting the expiration of pandemic relief programs including the expanded Child Tax Credit. The poverty rate for children more than doubled from a historic low of 5.2 percent in 2021 to 12.4 percent in 2022, erasing all of the record gains made against child poverty over the previous two years. Progress made in 2021 in narrowing the glaring differences between the poverty rates of Black and Latino children compared to white children was largely reversed.
The rise in the poverty rate, the largest on record in over 50 years both overall and for children, underscores the critical role that policy choices play in the level of poverty and hardship in the country.
If Congress had continued the American Rescue Plan’s Child Tax Credit increase in 2022, about 3 million additional children would have been kept out of poverty, preventing more than half of the 5.2 million increase in the number of children in poverty last year, CBPP analysis shows; the child poverty rate would have been about 8.4 percent rather than 12.4 percent. Even a more modest compromise expansion this year focused on children with low incomes could have a significant impact and partially reverse the stunning spike in child poverty the nation saw in 2022. Expanding the Child Tax Credit should be the top tax policy priority for lawmakers this year and during the 2025 tax debate.
Pre-tax cash incomes of lower-income households held roughly steady between 2021 and 2022, and the official poverty measure, which only considers pre-tax cash income and excludes resources from the Child Tax Credit, Earned Income Tax Credit, and SNAP, was unchanged in 2022 as compared to 2021. This further demonstrates that the loss of pandemic-related assistance, including the expanded Child Tax Credit, drove the increase in poverty under the more comprehensive Supplemental Poverty Measure, which considers tax credits and non-tax benefits.
Progress on health coverage was a much brighter spot in 2022. The share of people who lack health coverage matched its record low of 7.9 percent, thanks chiefly to pandemic-related Medicaid protections and the Rescue Plan’s enhanced premium tax credits helping people afford coverage, along with expanded marketplace enrollment periods and increased outreach and enrollment assistance.
But some of that progress is now at risk, as Medicaid protections expire. State government data show that about 6 million people have already lost coverage, including many who have not been able to navigate the administrative hurdles required to keep Medicaid. To regain lost ground on coverage, we need to adopt long-term policies and processes that reduce Medicaid coverage disruptions, close the Medicaid coverage gap in states that have not implemented the Affordable Care Act’s Medicaid expansion, eliminate immigration-related barriers to affordable health coverage, and make the enhanced premium tax credits, now slated to expire after 2025, permanent.”
The Census Bureau has released nationwide figures for poverty, income, and health insurance coverage in 2022 from its Current Population Survey. Additional health insurance data from the American Community Survey will follow September 14.
We’ll be posting our analysis of the data here. Bookmark and visit this page for more.
See our paper on what to watch for in the data.

CBPP
Receive the latest news and reports from the Center