TANF Emerging from the Downturn a Weaker Safety Net
Nationally, Temporary Assistance for Needy Families (TANF), which provides basic assistance to families with little or no income, responded only modestly to the severe recession that began in December 2007, and the national TANF caseload began to decline in January 2011. State TANF caseloads varied widely in their responsiveness during the recession, growing substantially in some states but changing little in many others.
The variation among states widened during the recovery that began in June 2009, as some states made significant policy or programmatic changes that led to substantial caseload declines. By December 2011, nearly one-third of all states had lower caseloads than at the start of the recession in December 2007, even though the unemployment rate in December 2011, at 8.5 percent, was far above the December 2007 level of 5.0 percent.
Its key findings are:
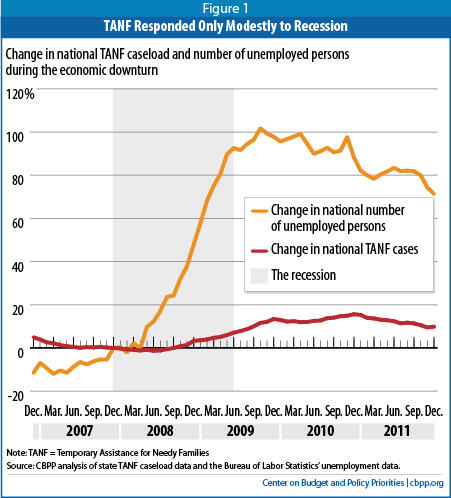
- Nationally, the TANF caseload responded only modestly to the downturn and began to decline while need remained high. The caseload did not begin to grow until seven months after the recession started, and it rose only 16 percent before peaking in December 2010 (see Figure 1). In contrast, the number of unemployed individuals rose 88 percent over this period. Over the course of 2011, the caseload fell 5 percentage points from that peak, while the unemployment rate remained at or above 8.5 percent throughout the year.
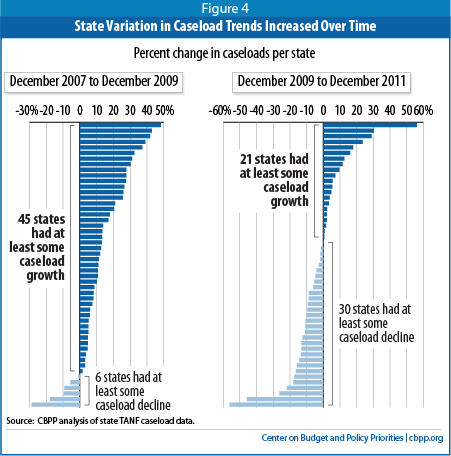
- Changes in states’ caseloads varied widely. Forty-five states’ caseloads grew between December 2007 and December 2009 but by widely differing amounts, ranging from 2 percent to 48 percent; in more than half of these states, the increase was 14 percent or less. After the recovery began, caseloads continued to grow in some states but fell sharply in others. Between December 2009 and December 2011, 21 states’ caseloads rose by amounts ranging from 2 percent to 56 percent; in 30 states, caseloads fell by amounts ranging from 1 percent to 56 percent. Over the four-year period from December 2007 to December 2011, caseload changes ranged from Oregon’s 81 percent increase to Arizona’s 54 percent decline.
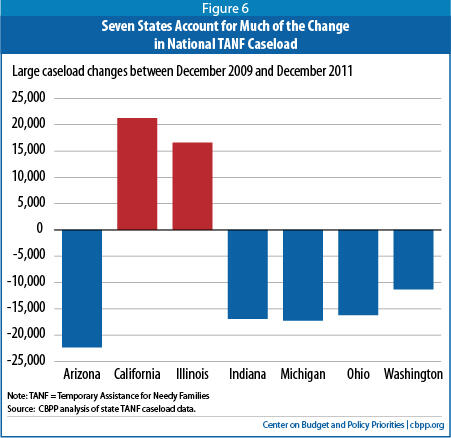
- Variations in unemployment do not fully explain the variation in state caseload changes. There is little overlap between the ten states with the largest percentage increases in the number of unemployed workers and the ten states with the largest percentage increases in TANF caseloads. The three states with the largest TANF caseload increases — Oregon, Colorado and Illinois — ranked 28, 14 and 30, respectively, in the percentage increase in the number of unemployed. Meanwhile, the three states with the largest TANF caseload decreases — Arizona, Indiana, and Rhode Island — ranked 5, 16 and 23, respectively, in the increase in unemployed workers.
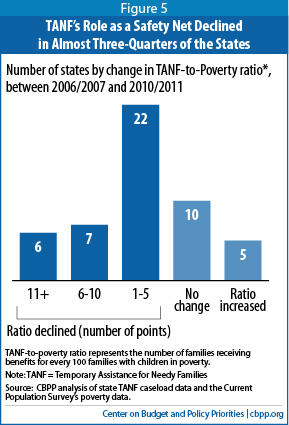
- In most states, TANF provides a weaker safety net now than it did prior to the recession. The number of families with children served by TANF for every 100 such families living in poverty fell in 35 states between 2006/2007 and 2010/2011, while rising in just five states.
- State actions had a significant impact on TANF caseloads. In response to budget pressures, several states cut TANF benefit levels, shortened or tightened time limits, or made other cutbacks during the recession, contributing to substantial caseload declines. Conversely, Illinois, which made an explicit choice to improve access to the program, saw its TANF caseload increase by 73 percent between December 2007 and December 2011, although it still serves relatively few families in need. (In 1996, in Illinois, there were 86 families with children receiving TANF for every 100 families in poverty. By 2008, this ratio had plummeted to just 9 families with children receiving TANF for every 100 in poverty. After increasing for three years from 2009 through 2011, the ratio reached a very modest 15 families out of 100 in 2011.)
Although the 1996 welfare law shifted the focus of TANF to work, Congress still intended the program to provide a safety net for poor families with children when they could not find work. The lackluster performance of TANF during the downturn has exposed its inadequacy as a safety net. The program that once provided at least minimal basic assistance to the majority of eligible poor families with nowhere else to turn failed to address the significant increase in need, leaving many families with children who couldn’t find work or qualify for unemployment insurance with no regular source of income.
The Context: Sustained High Unemployment Created Widespread Hardship
The Great Recession of 2007-2009 was characterized not only by high unemployment, but also by the speed at which the ranks of the unemployed swelled and the long periods of time for which many people have remained unemployed. From the start of the recession in December 2007 through December 2009, the unemployment rate more than doubled, from 4.9 percent to 10 percent. (It peaked at 10.1 percent in October 2009.) Over these two years, the number of unemployed persons also more than doubled, from 7.4 million to 15.0 million.
The unemployment rate subsequently declined somewhat but remained very high, at 8.5 percent as of December 2011; there were still 71 percent more unemployed individuals that month than at the start of the recession four years earlier. Long-term unemployment was especially pronounced during the downturn: the number of people who had been unemployed for at least 27 weeks and are still looking for work quadrupled from the start of the recession to December 2011.
The high levels of joblessness during the recession resulted in increased poverty that persisted even after the number of people without jobs started to decline. Between 2007 and 2009, the number of people in poverty increased by 6.3 million to 43.6 million and the official poverty rate rose from 12.5 percent to 14.3 percent. The poverty rate continued rising in 2010, to 15.1 percent, its highest level since 1993, then stayed about the same, at 15.0 percent in 2011.
The percentage of people in deep poverty — that is, with incomes below half the poverty line — rose from 5.2 percent in 2007 to 6.3 percent in 2009 and 6.6 percent in 2011. (Half of the poverty line corresponds to an annual income of about $9,000 for a family of three.) Some 20.4 million Americans lived in deep poverty in 2011.
Downturn Exposed TANF’s Weakness as Safety Net
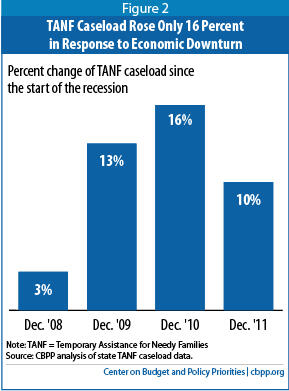
The national TANF caseload responded only modestly to the very large increase in need due to the recession — and with a substantial time lag. The caseload did not begin to grow until July 2008, seven months after the recession started. It peaked in December 2010 at 16 percent above its December 2007 level. The caseload grew fastest in 2008 and 2009, then somewhat more slowly in 2010. In 2011, unemployment remained at or above 8.5 percent for the entire year, but the TANF caseload fell 5 percentage points from its December 2010 peak (see Figure 2).[2]
As a part of the 1996 welfare reform law, Congress created the TANF Contingency Fund for this very purpose, but because of its complex design and requirement that states significantly increase their own state TANF spending to qualify for these funds, fewer than half of the states received any money from the Contingency Fund during the downturn, even though nearly all states met its economic distress triggers.
As part of the 2009 Recovery Act, Congress created the TANF Emergency Fund to provide states with an additional $5 billion that they could use to cover the increased costs of assisting more people. States also could use the extra funds to boost spending on subsidized jobs or provide one-time, non-recurring payments such as emergency food assistance, utility payments, or rent payments to prevent a family from becoming homeless. The funds were available for federal fiscal years 2009 and 2010; the federal government began distributing them in the spring of 2009.
Once the additional ARRA funding was no longer available, states were left on their own to figure out how to cover the costs of their expanded caseloads. A number responded by taking actions to reduce benefits or caseloads, thus providing less assistance to families when more was needed.
Caseload Trends Varied Widely Across States
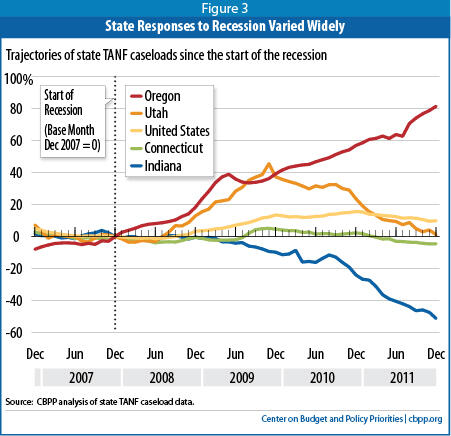
Trends in state TANF caseload trends varied widely, as the examples in Figure 3 show. Caseloads in some states (like Oregon) responded quickly to the increase in need and continued to respond throughout the downturn and as the economy began to recover. Caseloads in other states (like Utah) grew initially but began to return to pre-recession levels soon after — or, in some cases, even before — the official end of the recession. Caseloads in other states responded modestly, steadily declined, or did not respond at all.
Most states’ caseloads grew during the first two years after the start of the recession (from December 2007 to December 2009) but by widely differing amounts. Among the 45 states with increases, TANF caseloads grew by as little as 2 percent and by as much as 48 percent; in more than half of the states with an increase, caseloads grew by 13 percent or less.
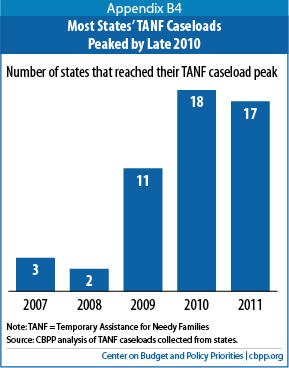
After the recovery began, caseloads continued to grow in some states but fell sharply in others. Between December 2009 and December 2011, 21 states’ caseloads rose by amounts ranging from 2 percent to 56 percent. In 30 states, caseloads fell by amounts ranging from 1 percent to 56 percent. (See Figure 4.) Although the recession officially ended in June 2009, the number of unemployed individuals continued to grow after that date in all except 7 states. Nearly one-third of the states reached their recession TANF caseload peak before the number of unemployed peaked.
Many states experienced only modest growth in caseloads from the start of the recession until their caseload peaked. In half of the states, caseloads grew by less than 20 percent, and in 14 of those states they grew by less than 10 percent. In three states, TANF caseloads never increased during the downturn.
State TANF caseloads started to decline shortly after the official end of the recession. Still, with the unemployment remaining at 8.5 percent nationally at the end of 2011, 35 states had larger caseloads in December 2011 than in December 2007. In Colorado, Illinois, and Oregon, the December 2011 caseloads were more than 50 percent above the December 2007 levels.
About one third of the states, however, had lower caseloads in December 2011 than at the start of the recession — and in some cases, the caseloads were much lower (see Appendix B5). Even though the unemployment situation was improving, the unemployment rate in all of the states with lower caseloads was higher in December 2011 than at the start of the recession. For example, in Arizona and Indiana, caseloads at the end of 2011 were less than half their December 2007 levels. However, the unemployment rates in both states were substantially higher in December 2011 than in December 2007. Arizona’s unemployment rate was 4.2 percent in December 2007 and 9.0 percent in December 2011; Indiana’s unemployment was 4.7 percent in December 2007 and 8.9 percent in December 2011.
Differences in Economic Conditions Don’t Fully Account for Caseload Variation
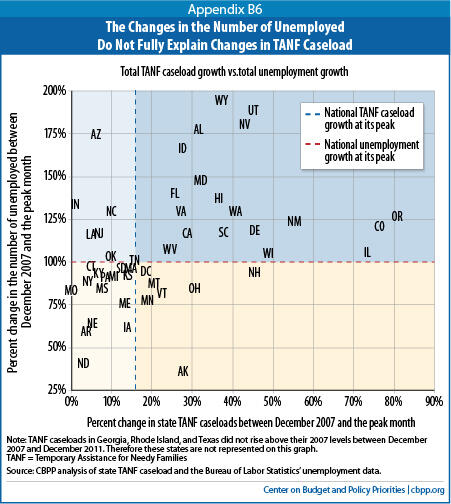
The recession did not affect all states equally; the increase in the number of unemployed individuals from the start of the recession to its peak in the state ranged from 35 percent to 194 percent. But this variation doesn’t fully explain differences in the responsiveness of states’ TANF caseloads.
The states with the greatest increases in the number of unemployed were not always the states with the greatest increases in their TANF caseload — and the responsiveness of states’ TANF caseloads differed greatly across states that experienced similar increases in the number or percentage of unemployed workers (see Appendix B6). In fact, there is little overlap between the ten states with the largest increases in the number of unemployed workers and the ten states with the largest increases in their TANF caseloads. The three states with the largest TANF caseload increases between December 2007 and December 2011 — Oregon, Colorado and Illinois — ranked 28, 14, and 30, respectively, among the states in the percentage increase in the number of unemployed.[4]
TANF Caseloads Didn’t Keep Pace with Increase in Poverty
One measure of the extent to which TANF provides a safety net for poor families in need is the TANF-to-poverty ratio, or the ratio of the number of families receiving TANF for every 100 families with children in poverty; the lower the ratio, the more limited is TANF’s reach in helping families in poverty. The number of families that receive TANF reflects two factors: (1) whether families are eligible based on state policies; and (2) whether eligible families participate. The TANF-to-poverty ratio captures both so it is a good measure of TANF’s reach.[5]
Changes in the ratio over time indicate whether TANF is growing stronger or weaker as a safety net. If TANF caseloads increase at roughly the same rate as poverty, the ratio will remain stable. As Figure 5 shows, however, TANF emerged from the recession significantly weaker than it was before. Between 2006/2007 and 2010/2011 (we use two-year averages to improve their reliability), the TANF-to-poverty ratio fell in almost three-quarters of the states. In many cases the decline was moderate to substantial: the ratio fell by more than 10 points in six states and by 6 to 10 points in seven states (see Figure 5). This is part of a longer 16-year trend of the diminishing role of TANF as a safety net. Since enactment of the 1996 welfare law, the national TANF-to-poverty ratio declined from 68 families receiving TANF for every 100 in poverty in 1996 to 32 out of 100 in 2006 and 27 out of 100 in 2011.
Understanding State Variation: State Choices Matter
While it is not possible to fully account for all factors that may have affected the responsiveness of state TANF caseloads to increased need, state policy choices clearly have been an important factor, especially among some of the larger states.
Marked caseload declines (or even blunted caseload increases) in many states generally did not represent improved economic prospects for families and reduced need for help. Rather, they resulted primarily from policy or implementation changes that reduced or ended benefits for families regardless of ongoing need. Many states faced both higher demand for basic assistance and significant budget shortfalls; they had been using TANF dollars to fill other budget holes before the start of the recession and were unable to pull this funding back to meet basic assistance needs when such needs increased as the economy contracted. Thus, a number of states responded to increased need by reducing cash assistance or ending it altogether for tens of thousands of families.
One of the most common ways that states contained caseload increases and reduced the amount of TANF funds needed to provide basic assistance was by shortening or otherwise narrowing time limits on receipt of TANF assistance. In most cases, these time-limit changes were retroactive, so they removed a substantial number of people from the TANF rolls almost immediately. Some states accompanied time-limit changes with other policies that helped shrink caseloads, such as counting income not previously counted toward TANF eligibility.
- Arizona made a number of policy changes in 2010 and 2011 that led to substantial caseload decline. In July 2010, the state shortened its time limit from 60 months to 36 months and imposed the time limit on most child-only cases for the first time; in July 2011, the state shortened the time limit further to 24 months, among the shortest in the country. The time-limit changes were retroactive, and some families that had not been subject to time limits faced an immediate cutoff of assistance. Also in 2010, Arizona cut off many child-only cases because it began to count the income of the relatives taking care of children (even though these relatives were not seeking assistance for themselves). Arizona also cut its benefit level by 20 percent in 2010. Between May 2010 and December 2011, Arizona’s TANF caseload fell by 50 percent — or by more than 17,000 families.
- Washington State made its time-limit policies more restrictive, starting in February 2011 (by narrowing the policies under which extensions from the time limits can be granted), which cut off over 5,000 families immediately and more families each month thereafter. The state also made other TANF cuts in 2011, including imposing time limits on child-only cases where the child resides with parents who aren’t eligible for TANF themselves (for example, because they are ineligible immigrants), cutting benefit levels by 15 percent, and counting the income of relatives who are taking care of the children in child-only cases but are not seeking assistance for themselves. Between January and December 2011, Washington’s TANF caseload fell by nearly 16,000 families, or 23 percent.
- Michigan made several retroactive time-limit changes in 2011. It tightened its 48-month time limit by eliminating certain bases for exemptions or extensions. It also applied a 60-month time limit retroactively to many families who had been exempt from the state’s 48-month time limit. This latter action caused 11,000 families to lose benefits immediately and another 3,600 families to be denied benefits between November 2011 and April 2012, when a court halted the new policy.[6] From January 2011 to December 2011, Michigan’s caseload declined by 25 percent, or 20,000 families. Even with the benefit reinstatements resulting from the court decision, in 2012 the TANF caseload remained below what it was in December 2011.
In some cases, large declines in TANF caseloads may reflect administrative acts rather than (or in addition to) legislative policy changes, especially around stricter work requirements. For example, Ohio’s caseload decline appears largely to flow from efforts to increase the state’s “work participation rate.”[7] The caseload fell by more than 16,000 families (or 16 percent) from December 2009 to December 2011 and continued to fall into 2012. The extent of the caseload decline does not correspond to explicit changes in eligibility; instead, it appears to result from increased emphasis on work requirements and associated penalties. Indiana, like Ohio, experienced substantial caseload declines during a time in which the state made a number of changes in policies and procedures around work requirements, including changes in sanction penalties and a new requirement that applicants complete 20 days of job search before benefits can be approved. Indiana’s caseload declined by more than 11,000 families (or 33 percent) between December 2010 and December 2011, even though its unemployment rate remained above 9 percent for most of 2011.
In sharp contrast, the example of Illinois shows that a state can reverse years of caseload decline through policy and programmatic changes aimed at improving access for families. In June 2010, Illinois made modest but significant changes in eligibility standards for applicants and in application procedures; perhaps even more important, it made a culture shift in program administration to deliver a new message — to allow eligible families to get benefits. Between June 2010 (the month before the new policies took effect) and December 2011, TANF caseloads rose 52 percent.
While these changes enabled more needy families to receive assistance, Illinois’ TANF program still provides a safety net for very few families. In 2011, the state’s TANF-to-poverty ratio was just 15 families with children receiving TANF assistance for every 100 such families living in poverty — up from a low of 9 in 2008, but well below the national average of 27.
Policy Changes to Improve TANF’s Responsiveness
The economic downturn has exposed serious weaknesses in TANF’s ability to respond to significant swings in the economy. TANF is often the safety net of last resort for parents who cannot find work and do not qualify for unemployment insurance. Thus, TANF has an important role to play in helping families with children weather the crises that result when jobs are not available. The program is due for reauthorization, which provides an opportunity to make it more responsive in such situations. Potential changes that policymakers should consider include:
-
Redesigning the Contingency Fund. When Congress created the TANF block grant in 1996, it created the TANF Contingency Fund for states to draw upon during periods of economic distress. This permanent fund (not to be confused with the temporary TANF Emergency Fund, discussed above) was intended to address some of the risks and hardships states would face as a result of the conversion of Aid to Families with Dependent Children — an entitlement whose funding rose automatically in recessions — to a block grant with a fixed federal funding level. However, because of its complex design, the Contingency Fund was not effective in helping many states respond to the recent economic downturn. Moreover, the fund’s design does not require states to use the resources to fund programs or services that explicitly respond to families’ needs during a downturn such as covering the costs of increased caseloads, providing more assistance to help recipients find work or helping families to avert a crisis caused by the loss of a job. Instead, they can use the funds for any TANF purpose.
A redesigned Contingency Fund should target funding to meet families’ needs during difficult economic times. States’ eligibility for the funds should be based on the extent to which they are devoting more resources to help families meet their basic needs through an increase in expenditures for basic assistance, subsidized employment programs, or other supports for families facing hard times (such as one-time emergency assistance to avert homelessness).
-
Requiring states to spend a minimum share of their block grant on direct assistance or work activities for poor families. As TANF’s current block-grant structure allows, states use a significant and growing share of TANF block grant and state maintenance of effort (MOE) funds to support state services other than the core welfare-reform functions of providing a safety net and promoting work opportunities for low-income families. After initially using the flexibility under TANF to invest more in work activities and supports in the early years of TANF, many states have reduced their spending for work activities and supports such as child care over the last decade.
One way to strike a balance between maintaining broad state flexibility and encouraging states to provide adequate assistance to families would be to require states to spend a specific share of their TANF block grant and MOE funds to provide assistance directly to families in need (through cash grants or subsidized employment) or to help them find employment (through job search assistance or participation in education and training programs to increase their skill levels).
-
Expanding TANF’s performance measures to include a measure of access. TANF’s role in providing a safety net for very poor families with children has declined sharply since its creation. To begin to reverse this trend, the Department of Health and Human Services should report annually on access to the program. The TANF-to-poverty ratio is one option for measuring access; the data to calculate it are readily available for all states, and it provides valid comparisons across states and over time.
In addition, Congress should consider ways to address the access disincentives built into TANF’s performance measurement system. For example, one of the easiest ways for states to meet their federal work participation rate is to serve fewer families over time and to avoid serving families with significant employment barriers, even though these are the very families that have the most to gain from employment assistance. States that serve a greater share of eligible families in need should be rewarded, not penalized, for providing a safety net and employment assistance to families who have nowhere else to turn for basic support for themselves and their children.
Appendix A: Methodology
This paper looks to national and state trends — over time and across states — in caseloads for cash assistance to families with children, often referred to as state welfare caseloads or state TANF caseloads. The analysis uses caseload data collected directly from the states rather than the official data reported by the Department of Health and Human Services (HHS) in order to more consistently reflect the number of families with children receiving cash welfare in each state over time and across states, for reasons explained below.
The Deficit Reduction Act of 2005 and its implementing rules made it more difficult for states to meet the TANF work participation rates. Since states that fail to meet these rates face a potential fiscal penalty, many states responded by changing the configuration of funding in their TANF programs. Two of these changes significantly affect the caseload data that states report to HHS.[8]
- Solely state-funded programs: over half the states serve some groups of families outside of the TANF or MOE funding structure.[9] Often these are families whose needs cannot be met through the narrowly defined set of “countable” TANF work activities — for example, families needing extended time in activities designed to help them address personal and family challenges that limit their employability, or families participating in post-secondary education for more than a year. Many states also serve two-parent families in solely state-funded programs, since these families are subject to a higher (and difficult to achieve) work participation rate. Failure to account for these programs could lead one to underestimate the TANF program’s responsiveness to the recession if these families were removed from the state’s TANF caseload near the start of the recession and to overestimate the program’s responsiveness if they were added back during the recession (as some states did as a result of state budget shortfalls).
- Worker supplement programs: over one-third of states provide some type of supplemental “assistance” payment to low-income working families outside of their regular TANF or welfare caseload in order to provide additional work support and better achieve state policy goals.[10] Most states provide these as transitional benefits to families that work their way off of TANF. A few states also serve a broader group of low-income working families that receive other benefits such as SNAP. Because these supplemental payments are supported by TANF or MOE funds, the recipients are included in caseload data reported to HHS, but they are not eligible for cash assistance under the state’s regular eligibility rules. Depending in part on when a state began providing these payments to working families, including these cases as a part of the TANF caseload could overestimate a state’s TANF responsiveness to the economic downturn because these programs include families that are not really considered part of the state’s basic cash assistance caseload.
The methodology we employed treats TANF caseload numbers differently from HHS with respect to these two populations. Families served in solely state-funded programs are not included in the HHS data but are included in our data; working families that receive monthly cash assistance supplements are included in the HHS data but not in our data. These two methodological decisions ensure that we are comparing a consistent cash assistance caseload over time and across states. While the HHS data accurately reflect the number of families that states have chosen to serve with their TANF block grant and MOE funds over time, they do not always reflect the state’s caseload of families with children receiving cash assistance. Moreover, because state choices have changed over time, the HHS data are not well suited to monitoring changes in the number of individuals or families serviced over time even within a state.
We collected data from state websites and contacted state officials for data when the website data were not available, incomplete, or unclear. Because states post their caseload data in different ways — some states separately identify separate state programs, solely state-funded programs, or worker supplement programs, while others do not — we used data that correspond to the definition of caseload that we are using in this analysis. Some states also report their TANF-funded child-only or kinship care assistance caseload separately; we included these data as part of state caseloads to ensure that the caseload data are comparable across states.[11]
Even if a state does not have a solely state-funded program or a worker supplement program, the caseload data obtained from the states may differ somewhat from the data submitted to HHS. (For some states, the data exactly match the HHS data.) This is because state caseload data are often more immediate and represent all benefits issued in a particular month, while the data provided to HHS are submitted some months later and thus include any adjustments that may have been made for cash payments issued late or in error. While there may be some small differences between the state caseload data and the data reported to HHS that go beyond the modifications for solely state-funded or worker supplement programs, our consistent use of the state caseload means that the data used for each state are comparable over the analysis period and that the trends within a state should represent real changes — not changes in the way the data is collected or reported.
Appendix B: Data Tables and Graphs
| Appendix B1 State TANF Caseloads from December 2007 to December 2011 | ||||
| State | Caseload in December 2007 | Caseload in December 2009 | Caseload in December 2011 | Percent Change 2007-2011 |
| Alabama | 18,830 | 21,330 | 23,404 | 24.3% |
| Alaska | 2,989 | 3,082 | 3,810 | 27.5% |
| Arizona | 37,887 | 39,858 | 17,512 | -53.8% |
| Arkansas | 7,684 | 7,957 | 7,100 | -7.6% |
| California | 466,853 | 561,909 | 583,153 | 24.9% |
| Colorado | 9,226 | 13,681 | 16,116 | 74.7% |
| Connecticut | 18,736 | 19,595 | 17,883 | -4.6% |
| Delaware | 4,628 | 5,833 | 6,574 | 42.0% |
| Dist. of Columbia | 14,853 | 16,453 | 17,640 | 18.8% |
| Florida | 48,608 | 61,097 | 53,041 | 9.1% |
| Georgia | 22,719 | 21,444 | 19,472 | -14.3% |
| Hawaii | 7,676 | 8,984 | 10,424 | 35.8% |
| Idaho | 1,537 | 1,738 | 1,940 | 26.2% |
| Illinois | 26,621 | 29,582 | 46,175 | 73.5% |
| Indiana | 40,985 | 36,989 | 20,046 | -51.1% |
| Iowa | 16,459 | 17,781 | 15,893 | -3.4% |
| Kansas | 12,837 | 13,599 | 11,809 | -8.0% |
| Kentucky | 29,323 | 30,243 | 30,876 | 5.3% |
| Louisiana | 11,178 | 11,740 | 10,706 | -4.2% |
| Maine | 13,169 | 14,302 | 14,101 | 7.1% |
| Maryland | 22,338 | 28,486 | 29,446 | 31.8% |
| Massachusetts | 45,915 | 50,822 | 51,985 | 13.2% |
| Michigan | 74,666 | 79,203 | 61,959 | -17.0% |
| Minnesota | 28,851 | 32,349 | 33,062 | 14.6% |
| Mississippi | 11,641 | 12,598 | 12,259 | 5.3% |
| Missouri | 42,951 | 42,589 | 41,777 | -2.7% |
| Montana | 3,189 | 3,859 | 3,437 | 7.8% |
| Nebraska | 9,849 | 10,309 | 8,623 | -12.4% |
| Nevada | 8,732 | 11,377 | 11,926 | 36.6% |
| New Hampshire | 4,584 | 6,505 | 5,848 | 27.6% |
| New Jersey | 38,615 | 39,233 | 41,428 | 7.3% |
| New Mexico | 14,060 | 20,103 | 19,768 | 40.6% |
| New York | 153,949 | 161,179 | 162,523 | 6.0% |
| North Carolina | 25,634 | 27,562 | 24,135 | -5.8% |
| North Dakota | 2,423 | 1,991 | 1,632 | -32.6% |
| Ohio | 80,212 | 102,489 | 86,283 | 7.6% |
| Oklahoma | 9,238 | 10,179 | 9,212 | -0.3% |
| Oregon | 19,126 | 26,599 | 34,654 | 81.2% |
| Pennsylvania | 81,420 | 85,534 | 85,508 | 5.0% |
| Rhode Island | 10,929 | 7,784 | 6,668 | -39.0% |
| South Carolina | 15,736 | 20,854 | 18,046 | 14.7% |
| South Dakota | 2,918 | 3,250 | 3,306 | 13.3% |
| Tennessee | 55,161 | 62,760 | 60,203 | 9.1% |
| Texas | 54,858 | 49,764 | 46,762 | -14.8% |
| Utah | 5,390 | 7,397 | 5,452 | 1.2% |
| Vermont | 4,884 | 5,759 | 6,076 | 24.4% |
| Virginia | 29,680 | 37,545 | 35,573 | 19.9% |
| Washington | 49,908 | 65,421 | 54,134 | 8.5% |
| West Virginia | 9,689 | 10,924 | 10,999 | 13.5% |
| Wisconsin | 18,327 | 20,777 | 26,790 | 46.2% |
| Wyoming | 278 | 355 | 338 | 21.6% |
| United States | 1,747,949 | 1,982,753 | 1,927,487 | 10.3% |
| Note: TANF = Temporary Assistance for Needy Families Source: CBPP analysis of TANF caseloads collected from states. | ||||
| Appendix B2 State TANF Caseloads and Number of Unemployed Persons December 2007 to December 2011 | ||||||
| State | TANF Caseload | Number of Unemployed | ||||
| Dec-07 | Dec-11 | Percent Change | Dec-07 | Dec-11 | Percent Change | |
| Alabama | 18,830 | 23,404 | 24.3% | 81,588 | 174,443 | 113.8% |
| Alaska | 2,989 | 3,810 | 27.5% | 21,848 | 27,246 | 24.7% |
| Arizona | 37,887 | 17,512 | -53.8% | 123,356 | 270,287 | 119.1% |
| Arkansas | 7,684 | 7,100 | -7.6% | 70,066 | 107,128 | 52.9% |
| California | 466,853 | 583,153 | 24.9% | 1,050,241 | 2,060,109 | 96.2% |
| Colorado | 9,226 | 16,116 | 74.7% | 111,121 | 215,071 | 93.5% |
| Connecticut | 18,736 | 17,883 | -4.6% | 91,883 | 155,815 | 69.6% |
| Delaware | 4,628 | 6,574 | 42.0% | 16,948 | 31,807 | 87.7% |
| Dist. of Col. | 14,853 | 17,640 | 18.8% | 18,456 | 34,771 | 88.4% |
| Florida | 48,608 | 53,041 | 9.1% | 431,870 | 922,456 | 113.6% |
| Georgia | 22,719 | 19,472 | -14.3% | 248,606 | 445,355 | 79.1% |
| Hawaii | 7,676 | 10,424 | 35.8% | 19,254 | 44,057 | 128.8% |
| Idaho | 1,537 | 1,940 | 26.2% | 25,725 | 64,612 | 151.2% |
| Illinois | 26,621 | 46,175 | 73.5% | 367,122 | 638,359 | 73.9% |
| Indiana | 40,985 | 20,046 | -51.1% | 149,156 | 286,509 | 92.1% |
| Iowa | 16,459 | 15,893 | -3.4% | 65,634 | 93,391 | 42.3% |
| Kansas | 12,837 | 11,809 | -8.0% | 59,757 | 96,314 | 61.2% |
| Kentucky | 29,323 | 30,876 | 5.3% | 113,930 | 185,857 | 63.1% |
| Louisiana | 11,178 | 10,706 | -4.2% | 76,146 | 144,220 | 89.4% |
| Maine | 13,169 | 14,101 | 7.1% | 33,601 | 49,797 | 48.2% |
| Maryland | 22,338 | 29,446 | 31.8% | 98,581 | 203,266 | 106.2% |
| Massachusetts | 45,915 | 51,985 | 13.2% | 154,386 | 237,718 | 54.0% |
| Michigan | 74,666 | 61,959 | -17.0% | 358,807 | 431,033 | 20.1% |
| Minnesota | 28,851 | 33,062 | 14.6% | 139,099 | 170,965 | 22.9% |
| Mississippi | 11,641 | 12,259 | 5.3% | 80,041 | 140,674 | 75.8% |
| Missouri | 42,951 | 41,777 | -2.7% | 162,037 | 244,045 | 50.6% |
| Montana | 3,189 | 3,437 | 7.8% | 18,799 | 33,368 | 77.5% |
| Nebraska | 9,849 | 8,623 | -12.4% | 29,247 | 42,947 | 46.8% |
| Nevada | 8,732 | 11,926 | 36.6% | 69,110 | 179,705 | 160.0% |
| New Hampshire | 4,584 | 5,848 | 27.6% | 25,594 | 38,512 | 50.5% |
| New Jersey | 38,615 | 41,428 | 7.3% | 205,053 | 416,178 | 103.0% |
| New Mexico | 14,060 | 19,768 | 40.6% | 33,437 | 64,620 | 93.3% |
| New York | 153,949 | 162,523 | 5.6% | 452,495 | 776,815 | 71.7% |
| North Carolina | 25,634 | 24,135 | -5.8% | 228,720 | 484,244 | 111.7% |
| North Dakota | 2,423 | 1,632 | -32.6% | 11,176 | 12,993 | 16.3% |
| Ohio | 80,212 | 86,283 | 7.6% | 338,967 | 457,728 | 35.0% |
| Oklahoma | 9,238 | 9,212 | -0.3% | 62,626 | 112,714 | 80.0% |
| Oregon | 19,126 | 34,654 | 81.2% | 101,680 | 179,114 | 76.2% |
| Pennsylvania | 81,420 | 85,508 | 5.0% | 291,906 | 489,246 | 67.6% |
| Rhode Island | 10,929 | 6,668 | -39.0% | 34,256 | 62,080 | 81.2% |
| South Carolina | 15,736 | 18,046 | 14.7% | 117,705 | 208,079 | 76.8% |
| South Dakota | 2,918 | 3,306 | 13.3% | 11,976 | 19,369 | 61.7% |
| Tennessee | 55,161 | 60,203 | 9.1% | 166,117 | 266,164 | 60.2% |
| Texas | 54,858 | 46,762 | -14.8% | 511,509 | 930,766 | 82.0% |
| Utah | 5,390 | 5,452 | 1.2% | 39,212 | 77,375 | 97.3% |
| Vermont | 4,884 | 6,076 | 24.4% | 14,450 | 18,755 | 29.8% |
| Virginia | 29,680 | 35,573 | 19.9% | 133,894 | 263,722 | 97.0% |
| Washington | 49,908 | 54,134 | 8.5% | 157,278 | 300,049 | 90.8% |
| West Virginia | 9,689 | 10,999 | 13.5% | 33,098 | 62,268 | 88.1% |
| Wisconsin | 18,327 | 26,790 | 46.2% | 140,355 | 213,168 | 51.9% |
| Wyoming | 278 | 338 | 21.6% | 7,743 | 17,202 | 122.2% |
| United States | 1,747,949 | 1,927,487 | 10.3% | 7,645,000 | 13,097,000 | 71.3% |
| Note: TANF = Temporary Assistance for Needy Families Source: CBPP analysis of TANF caseloads collected from states and the Bureau of Labor Statistics’ unemployment data. | ||||||
| Appendix B3 TANF Caseload Change from the Start of the Recession to the State's Caseload Peak | ||||
| State | TANF Caseload at Dec 2007 | Month of Caseload Peak | TANF Caseload Peak | Change from Dec 2007 to Caseload Peak |
| Alabama | 18,830 | Dec-10 | 24,792 | 31.7% |
| Alaska | 2,989 | Aug-11 | 3,811 | 27.5% |
| Arizona | 37,887 | Oct-09 | 40,235 | 6.2% |
| Arkansas | 7,684 | Dec-09 | 7,957 | 3.6% |
| California | 466,853 | Jun-11 | 601,846 | 28.9% |
| Colorado | 9,226 | Oct-11 | 16,312 | 76.8% |
| Connecticut | 18,736 | Nov-09 | 19,689 | 5.1% |
| Delaware | 4,628 | Dec-10 | 6,747 | 45.8% |
| Dist. of Columbia | 14,853 | Dec-11 | 17,640 | 18.8% |
| Florida | 48,608 | Dec-09 | 61,097 | 25.7% |
| Georgia | 22,719 | Dec-07 | 22,719 | 0.0% |
| Hawaii | 7,676 | Nov-11 | 10,478 | 36.5% |
| Idaho | 1,537 | Jun-11 | 1,959 | 27.5% |
| Illinois | 26,621 | Dec-11 | 46,175 | 73.5% |
| Indiana | 40,985 | Aug-08 | 41,271 | 0.7% |
| Iowa | 16,459 | Feb-10 | 18,774 | 14.1% |
| Kansas | 12,837 | Oct-10 | 14,639 | 14.0% |
| Kentucky | 29,323 | Dec-10 | 31,336 | 6.9% |
| Louisiana | 11,178 | Dec-09 | 11,740 | 5.0% |
| Maine | 13,169 | Mar-11 | 14,984 | 13.8% |
| Maryland | 22,338 | Dec-10 | 29,637 | 32.7% |
| Massachusetts | 45,915 | Dec-10 | 52,463 | 14.3% |
| Michigan | 74,666 | Oct-10 | 82,563 | 10.6% |
| Minnesota | 28,851 | Mar-11 | 34,485 | 19.5% |
| Mississippi | 11,641 | Dec-09 | 12,598 | 8.2% |
| Missouri | 42,951 | Jan-11 | 42,979 | 0.1% |
| Montana | 3,189 | Dec-09 | 3,859 | 21.0% |
| Nebraska | 9,849 | Dec-09 | 10,309 | 4.7% |
| Nevada | 8,732 | Dec-10 | 12,526 | 43.4% |
| New Hampshire | 4,584 | Apr-10 | 6,681 | 45.7% |
| New Jersey | 38,615 | Dec-11 | 41,428 | 7.3% |
| New Mexico | 14,060 | Dec-10 | 21,857 | 55.5% |
| New York | 153,949 | Dec-11 | 162,523 | 5.6% |
| North Carolina | 25,634 | Oct-09 | 28,184 | 9.9% |
| North Dakota | 2,423 | Jun-08 | 2,504 | 3.3% |
| Ohio | 80,212 | Jun-10 | 105,098 | 31.0% |
| Oklahoma | 9,238 | Dec-09 | 10,179 | 10.2% |
| Oregon | 19,126 | Dec-11 | 34,654 | 81.2% |
| Pennsylvania | 81,420 | Aug-10 | 88,554 | 8.8% |
| Rhode Island | 10,929 | Dec-07 | 10,929 | 0.0% |
| South Carolina | 15,736 | Oct-10 | 21,691 | 37.8% |
| South Dakota | 2,918 | Dec-11 | 3,306 | 13.3% |
| Tennessee | 55,161 | Nov-10 | 63,925 | 15.9% |
| Texas | 54,858 | Dec-07 | 54,858 | 0.0% |
| Utah | 5,390 | Nov-09 | 7,837 | 45.4% |
| Vermont | 4,884 | May-11 | 6,077 | 24.4% |
| Virginia | 29,680 | Oct-10 | 37,846 | 27.5% |
| Washington | 49,908 | Jan-11 | 70,318 | 40.9% |
| West Virginia | 9,689 | Nov-10 | 12,052 | 24.4% |
| Wisconsin | 18,327 | Aug-11 | 27,366 | 49.3% |
| Wyoming | 278 | Mar-10 | 382 | 37.4% |
| United States | 1,747,949 | Dec-10 | 2,020,926 | 15.6% |
| Note: TANF = Temporary Assistance for Needy Families Source: CBPP analysis of TANF caseloads collected from states. | ||||
| Appendix B5 States with Lower TANF Caseloads in December 2011 Than at the Beginning of the Recession | ||||||||
| State | TANF Caseload | Number of Unemployed | Unemployment Rate | |||||
| Dec-07 | Dec-11 | Percent Change | Dec-07 | Dec-11 | Percent Change | Dec-07 | Dec-11 | |
| Arizona | 37,887 | 17,512 | -53.8% | 123,356 | 270,287 | 119.1% | 4.1% | 9.0% |
| Arkansas | 7,684 | 7,100 | -7.6% | 70,066 | 107,128 | 52.9% | 5.1% | 7.8% |
| Connecticut | 18,736 | 17,883 | -4.6% | 91,883 | 155,815 | 69.6% | 4.9% | 8.1% |
| Georgia | 22,719 | 19,472 | -14.3% | 248,606 | 445,355 | 79.1% | 5.1% | 9.4% |
| Indiana | 40,985 | 20,046 | -51.1% | 149,156 | 286,509 | 92.1% | 4.6% | 8.9% |
| Iowa | 16,459 | 15,893 | -3.4% | 65,634 | 93,391 | 42.3% | 3.9% | 5.6% |
| Kansas | 12,837 | 11,809 | -8.0% | 59,757 | 96,314 | 61.2% | 4.0% | 6.4% |
| Louisiana | 11,178 | 10,706 | -4.2% | 76,146 | 144,220 | 89.4% | 3.7% | 7.0% |
| Michigan | 74,666 | 61,959 | -17.0% | 358,807 | 431,033 | 20.1% | 7.2% | 9.3% |
| Missouri | 42,951 | 41,777 | -2.7% | 162,037 | 244,045 | 50.6% | 5.3% | 8.0% |
| Nebraska | 9,849 | 8,623 | -12.4% | 29,247 | 42,947 | 46.8% | 3.0% | 4.2% |
| North Carolina | 25,634 | 24,135 | -5.8% | 228,720 | 484,244 | 111.7% | 5.0% | 10.4% |
| North Dakota | 2,423 | 1,632 | -32.6% | 11,176 | 12,993 | 16.3% | 3.0% | 3.3% |
| Oklahoma | 9,238 | 9,212 | -0.3% | 62,626 | 112,714 | 80.0% | 3.6% | 6.3% |
| Rhode Island | 10,929 | 6,668 | -39.0% | 34,256 | 62,080 | 81.2% | 6.0% | 11.0% |
| Texas | 54,858 | 46,762 | -14.8% | 511,509 | 930,766 | 82.0% | 4.4% | 7.4% |
| Note: TANF = Temporary Assistance for Needy Families Source: CBPP analysis of state TANF caseload and the Bureau of Labor Statistics’ unemployment data. | ||||||||
| Appendix B7 States’ TANF-to-Poverty Ratio from 2006/2007 to 2010/2011 (The ratio is the number of families with children receiving TANF for every 100 such families living in poverty) | |||||
| State | 2006/2007 | 2007/2008 | 2008/2009 | 2009/2010 | 2010/2011 |
| Alabama | 15.7 | 14.8 | 15.4 | 16.9 | 17.8 |
| Alaska | 35.2 | 40.3 | 30.0 | 25.4 | 26.8 |
| Arizona | 25.5 | 21.9 | 19.9 | 17.7 | 13.4 |
| Arkansas | 9.8 | 9.7 | 8.7 | 9.7 | 9.5 |
| California | 64.6 | 63.4 | 64.9 | 65.5 | 61.0 |
| Colorado | 15.3 | 12.3 | 11.3 | 12.5 | 14.7 |
| Connecticut | 42.0 | 38.1 | 45.0 | 42.0 | 35.3 |
| Delaware | 40.9 | 36.2 | 33.1 | 34.7 | 34.1 |
| Florida | 16.8 | 15.7 | 15.3 | 14.0 | 13.0 |
| Georgia | 11.4 | 9.1 | 8.1 | 7.6 | 7.3 |
| Hawaii | 65.1 | 52.7 | 42.2 | 41.4 | 43.7 |
| Idaho | 6.8 | 5.1 | 4.4 | 4.6 | 4.4 |
| Illinois | 14.9 | 11.1 | 9.4 | 10.6 | 13.3 |
| Indiana | 33.8 | 27.2 | 22.1 | 18.9 | 15.0 |
| Iowa | 37.0 | 36.4 | 34.1 | 34.9 | 36.0 |
| Kansas | 25.4 | 21.3 | 22.7 | 21.4 | 19.5 |
| Kentucky | 25.9 | 25.3 | 24.8 | 23.8 | 25.5 |
| Louisiana | 8.9 | 8.6 | 9.3 | 8.5 | 7.2 |
| Maine | 61.0 | 59.9 | 61.0 | 65.7 | 60.1 |
| Maryland | 32.9 | 33.6 | 35.8 | 32.5 | 33.7 |
| Massachusetts | 40.9 | 39.8 | 41.4 | 44.7 | 48.9 |
| Michigan | 38.9 | 37.7 | 32.3 | 34.2 | 33.8 |
| Minnesota | 46.8 | 41.2 | 37.8 | 40.5 | 44.3 |
| Mississippi | 11.5 | 12.2 | 11.5 | 10.0 | 12.0 |
| Missouri | 34.2 | 31.4 | 27.8 | 27.5 | 29.2 |
| Montana | 19.4 | 18.2 | 17.2 | 16.7 | 13.6 |
| Nebraska | 45.5 | 34.2 | 34.2 | 38.8 | 33.2 |
| Nevada | 21.6 | 22.3 | 20.4 | 19.2 | 19.7 |
| New Hampshire | 53.5 | 42.7 | 38.5 | 49.3 | 54.9 |
| New Jersey | 36.0 | 33.8 | 30.6 | 30.0 | 26.2 |
| New Mexico | 31.6 | 26.4 | 24.6 | 28.7 | 28.4 |
| New York | 36.6 | 33.9 | 33.0 | 33.8 | 35.2 |
| North Carolina | 12.3 | 12.0 | 11.2 | 9.6 | 9.2 |
| North Dakota | 22.8 | 22.7 | 20.0 | 17.8 | 16.1 |
| Ohio | 32.3 | 30.8 | 31.9 | 32.8 | 31.9 |
| Oklahoma | 11.7 | 11.6 | 11.3 | 10.3 | 9.9 |
| Oregon | 27.9 | 32.8 | 35.1 | 36.3 | 38.2 |
| Pennsylvania | 42.0 | 40.0 | 40.8 | 39.2 | 36.1 |
| Rhode Island | 67.1 | 52.6 | 39.3 | 32.6 | 28.8 |
| South Carolina | 19.4 | 17.6 | 19.0 | 17.2 | 14.7 |
| South Dakota | 24.8 | 19.7 | 17.6 | 20.7 | 19.3 |
| Tennessee | 44.4 | 41.1 | 37.9 | 37.0 | 36.4 |
| Texas | 9.8 | 8.3 | 7.0 | 6.4 | 6.3 |
| Utah | 15.5 | 15.4 | 15.9 | 14.6 | 13.4 |
| Vermont | 63.0 | 64.2 | 73.1 | 57.8 | 47.5 |
| Virginia | 29.5 | 27.9 | 26.1 | 28.5 | 29.2 |
| Washington | 58.6 | 51.4 | 46.5 | 48.7 | 48.5 |
| West Virginia | 22.7 | 22.2 | 21.9 | 21.3 | 23.0 |
| Wisconsin | 20.7 | 21.6 | 22.3 | 24.5 | 24.4 |
| Wyoming | 3.2 | 3.3 | 4.2 | 4.2 | 3.8 |
| United States | 30.4 | 28.4 | 27.5 | 27.3 | 27.0 |
| Note: TANF = Temporary Assistance for Needy Families Source: CBPP analysis of the Current Population Survey’s poverty data and TANF caseloads collected from states. | |||||
| Appendix B8 Change in States’ TANF-to-Poverty Ratio (TPR) Since 2006/2007 | |||||
| State | 2006/2007 TANF to Poverty Ratio | TPR Change in 2007/2008 | TRP Change in 2008/2009 | TPR Change in 2009/2010 | TPR Change in 2010/2011 |
| Alabama | 15.7 | -1.0 | -0.3 | 1.2 | 2.1 |
| Alaska | 35.2 | 5.1 | -5.1 | -9.8 | -8.3 |
| Arizona | 25.5 | -3.6 | -5.6 | -7.8 | -12.1 |
| Arkansas | 9.8 | -0.2 | -1.1 | -0.1 | -0.4 |
| California | 64.6 | -1.2 | 0.3 | 0.9 | -3.7 |
| Colorado | 15.3 | -3.0 | -3.9 | -2.8 | -0.6 |
| Connecticut | 42.0 | -3.9 | 3.0 | 0.0 | -6.7 |
| Delaware | 40.9 | -4.7 | -7.8 | -6.2 | -6.8 |
| Florida | 16.8 | -1.1 | -1.5 | -2.8 | -3.7 |
| Georgia | 11.4 | -2.3 | -3.3 | -3.9 | -4.1 |
| Hawaii | 65.1 | -12.4 | -22.9 | -23.6 | -21.3 |
| Idaho | 6.8 | -1.7 | -2.4 | -2.2 | -2.4 |
| Illinois | 14.9 | -3.8 | -5.5 | -4.3 | -1.6 |
| Indiana | 33.8 | -6.6 | -11.7 | -14.9 | -18.8 |
| Iowa | 37.0 | -0.7 | -2.9 | -2.2 | -1.1 |
| Kansas | 25.4 | -4.1 | -2.7 | -4.0 | -5.9 |
| Kentucky | 25.9 | -0.6 | -1.1 | -2.0 | -0.4 |
| Louisiana | 8.9 | -0.4 | 0.4 | -0.4 | -1.7 |
| Maine | 61.0 | -1.1 | 0.0 | 4.7 | -0.9 |
| Maryland | 32.9 | 0.7 | 2.9 | -0.4 | 0.9 |
| Massachusetts | 40.9 | -1.1 | 0.4 | 3.7 | 7.9 |
| Michigan | 38.9 | -1.2 | -6.6 | -4.7 | -5.1 |
| Minnesota | 46.8 | -5.6 | -9.0 | -6.4 | -2.5 |
| Mississippi | 11.5 | 0.7 | 0.1 | -1.4 | 0.6 |
| Missouri | 34.2 | -2.8 | -6.4 | -6.7 | -5.0 |
| Montana | 19.4 | -1.3 | -2.3 | -2.8 | -5.9 |
| Nebraska | 45.5 | -11.2 | -11.3 | -6.7 | -12.3 |
| Nevada | 21.6 | 0.7 | -1.2 | -2.4 | -1.9 |
| New Hampshire | 53.5 | -10.8 | -15.0 | -4.2 | 1.4 |
| New Jersey | 36.0 | -2.2 | -5.4 | -6.0 | -9.8 |
| New Mexico | 31.6 | -5.2 | -6.9 | -2.8 | -3.2 |
| New York | 36.6 | -2.7 | -3.6 | -2.8 | -1.4 |
| North Carolina | 12.3 | -0.4 | -1.1 | -2.7 | -3.2 |
| North Dakota | 22.8 | -0.1 | -2.8 | -5.0 | -6.7 |
| Ohio | 32.3 | -1.4 | -0.3 | 0.6 | -0.3 |
| Oklahoma | 11.7 | -0.1 | -0.4 | -1.4 | -1.8 |
| Oregon | 27.9 | 4.9 | 7.2 | 8.4 | 10.2 |
| Pennsylvania | 42.0 | -2.0 | -1.2 | -2.9 | -5.9 |
| Rhode Island | 67.1 | -14.5 | -27.8 | -34.5 | -38.4 |
| South Carolina | 19.4 | -1.7 | -0.4 | -2.1 | -4.7 |
| South Dakota | 24.8 | -5.0 | -7.2 | -4.0 | -5.4 |
| Tennessee | 44.4 | -3.4 | -6.6 | -7.4 | -8.0 |
| Texas | 9.8 | -1.5 | -2.8 | -3.4 | -3.5 |
| Utah | 15.5 | -0.1 | 0.3 | -1.0 | -2.2 |
| Vermont | 63.0 | 1.2 | 10.1 | -5.2 | -15.5 |
| Virginia | 29.5 | -1.6 | -3.4 | -1.0 | -0.3 |
| Washington | 58.6 | -7.2 | -12.0 | -9.9 | -10.1 |
| West Virginia | 22.7 | -0.5 | -0.8 | -1.4 | 0.3 |
| Wisconsin | 20.7 | 0.9 | 1.6 | 3.8 | 3.7 |
| Wyoming | 3.2 | 0.0 | 1.0 | 1.0 | 0.5 |
| United States | 30.4 | -1.9 | -2.8 | -3.0 | -3.4 |
| Note: TANF = Temporary Assistance for Needy Families Source: CBPP analysis of the Current Population Survey’s poverty data and TANF caseloads collected from states. | |||||
End Notes
[1] LaDonna Pavetti, Danilo Trisi, and Liz Schott, “TANF Responded Unevenly to Increase in Need During Downturn,” Center on Budget and Policy Priorities, January 25, 2011, https://www.cbpp.org/cms/index.cfm?fa=view&id=3379.
[2] Note: The numbers in the text and the figure are different due to rounding.
TANF’s response to the economic crisis was concentrated among adult-aided cases, as more needy families that included parents or other adults turned to states for assistance. Between 2007 and 2011, while the caseload rose by 10 percent overall, the number of cases with an aided adult rose by 17 percent; the child-only caseload rose by just 1.5 percent. For more analysis of the separate caseload trends of adult-aided and child-only cases, see Jane Mauldon, Richard Speiglman, Christina Sogar and Matt Stagner, “TANF Child-Only Cases: Who Are They? What Policies Affect Them? What Is Being Done?,”prepared for OPRE and ASPE, December 11, 2012, http://www.cfpic.org/pdfs/TANF-Child-Only-Cases--The-Report-12-19-2012.pdf.
[3] The TANF Emergency Fund is technically known at the TANF Emergency Contingency Fund. We use the shorter name, TANF Emergency Fund, here to avoid confusion with the TANF Contingency Fund, which was created as part of the 1996 welfare reform law.
[4] In the year prior to the recession, caseloads were declining in both Illinois and Colorado, so these states’ caseloads increased from a very low base.`
[5] For more information on the calculation of the TANF-to-poverty ratio, see Danilo Trisi and LaDonna Pavetti, Ph.D., “TANF Weakening as a Safety Net For Poor Families,” Center on Budget and Policy Priorities, March 13, 2012, https://www.cbpp.org/cms/index.cfm?fa=view&id=3700.
[6] As a result of the court order, more than 5,600 of these terminated families reapplied and were reinstated for benefits. Litigation invalidating the administratively imposed 60-month time limit is still pending. Meanwhile, in December 2012, Michigan changed state law to statutorily set the 60-month time limit, which will lead to further terminations.
[7] In federal fiscal year 2011, Ohio was in a corrective compliance period for failure to meet the work participation rate requirement in 2007 (and would have had to pay a federal penalty if it failed to come into compliance for that year). Its efforts to come into compliance relied in part on aggressive use of full-family sanctions aimed both at engaging more families in work activities and eliminating not-participating families entirely from the caseload.
[8] For a fuller discussion of these state changes and the impact on caseloads, see LaDonna Pavetti, Linda Rosenberg, and Michelle K. Derr, “Understanding Temporary Assistance for Needy Families Caseloads After Passage of the Deficit Reduction Act of 2005, Final Report,” Mathematica Policy Research, September 21, 2009, http://www.mathematica-mpr.com/publications/PDFs/family_support/TANF_caseloads.pdf. See also, “Temporary Assistance for Needy Families: Implications of Recent Legislative and Economic Changes for State Programs and Work Participation Rates,” GAO-10-525, May 2010.
[9] For additional information on solely state-funded programs, see Liz Schott and Sharon Parrott, “Designing Solely State-Funded Programs: Implementation Guide for One ‘Win-Win’ Solution for Families and States,” Center on Budget and Policy Priorities, revised January 8 2009, https://www.cbpp.org/cms/index.cfm?fa=view&id=989.
[10] For more information about worker supplement programs, see Liz Schott, “Using TANF or MOE Funds to Provide Supplemental Assistance to Low-Income Working Families,” Center on Budget and Policy Priorities, revised September 2008, https://www.cbpp.org/cms/index.cfm?fa=view&id=312.
[11] The methodology differed slightly for Georgia because the state does not post caseload data online and state officials have not responded to our requests for information. Instead of relying on state data, we used the data the state reports to HHS. We know that Georgia does have a very small solely state-funded program, so we may have slightly underestimated their total caseload in the months after the solely state-funded program was implemented.
More from the Authors

Areas of Expertise

Areas of Expertise