Raising State Income Tax Rates at the Top a Sensible Way to Fund Key Investments
Policymakers in several states are reviewing options to strengthen support for public investments crucial to state economies and residents’ well-being, such as quality early education, affordable college, and modern infrastructure. One way to raise the necessary funds is to raise personal income tax rates on the highest incomes, a policy choice sometimes referred to as a “millionaires’ tax.” This approach makes sense: evidence indicates it can generate substantial revenue for public investments that boost a state’s productivity in the long run, without harming economic growth in the short term.
One way to raise the necessary funds is to raise personal income tax rates on the highest incomes, a policy choice sometimes referred to as a “millionaires’ tax.
- High-income tax increases can generate substantial revenues for investments in people and communities that provide economic and social benefits over the long term. Raising personal income tax rates has allowed states to prevent or minimize harmful budget cuts or invest in ambitious new initiatives such as expanding early education, boosting access to college, improving infrastructure, and strengthening “rainy day” funds to prepare for the next recession. Evidence indicates that sustained support for public building blocks of growth can help states improve their residents’ well-being, expand opportunity and racial equity, and build more prosperous economies over time.
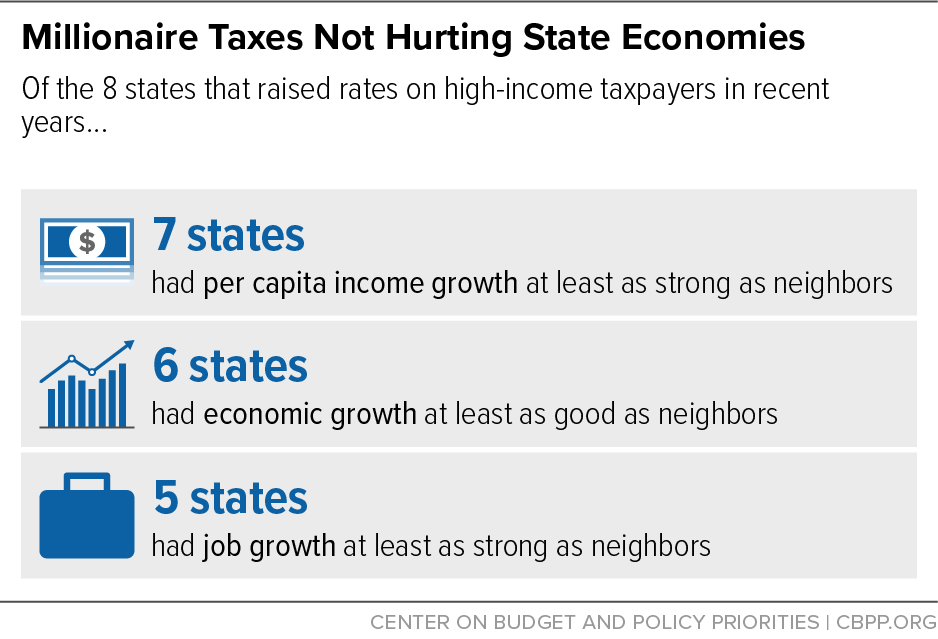
- Real-world experience suggests that raising top income tax rates is unlikely to harm state economies in the short run, contrary to some claims. In six of eight states (including the District of Columbia) that enacted millionaires’ taxes since 2000, private-sector economic growth met or exceeded that of neighboring states since enacting the tax increases.[1] Seven of the eight states had per capita growth in personal incomes at least as strong as nearby states, and five of the eight added jobs at least as quickly as their neighbors. Only one state that raised its state income tax rates, Connecticut, has seen markedly weaker growth than its neighbors, likely for reasons other than state tax levels.
- The bulk of mainstream academic research finds that interstate differences in taxes, including differences in top personal income tax rates, have minimal effects on state economic growth. Fifteen of the 20 major studies published in academic journals since 2000 that examined the broad economic effect of state personal income tax levels found no significant effects and one of the others produced internally inconsistent results.[2] As a pair of university researchers described in a comprehensive literature review in 2018, “The vast majority of the academic studies that examined the relationship between state and local taxes and economic growth found little or no effect.”[3]
Millionaires’ Taxes Increasingly Common
The personal income tax is a major source of revenue for 41 states. Although some states apply a flat rate to all taxable income, most states with a personal income tax maintain a graduated structure that applies increasing rates to increasing levels of income. Prior to the 2000s, however, special brackets or rates targeted specifically to the highest incomes were relatively uncommon. California levied a temporary 11 percent rate on incomes above about $200,000 from 1991 to 1996,[4] and in 1992 Ohio created a new bracket on incomes above that same level.[5] But as of 2000, only five states had top rates kicking in above $100,000.[6]
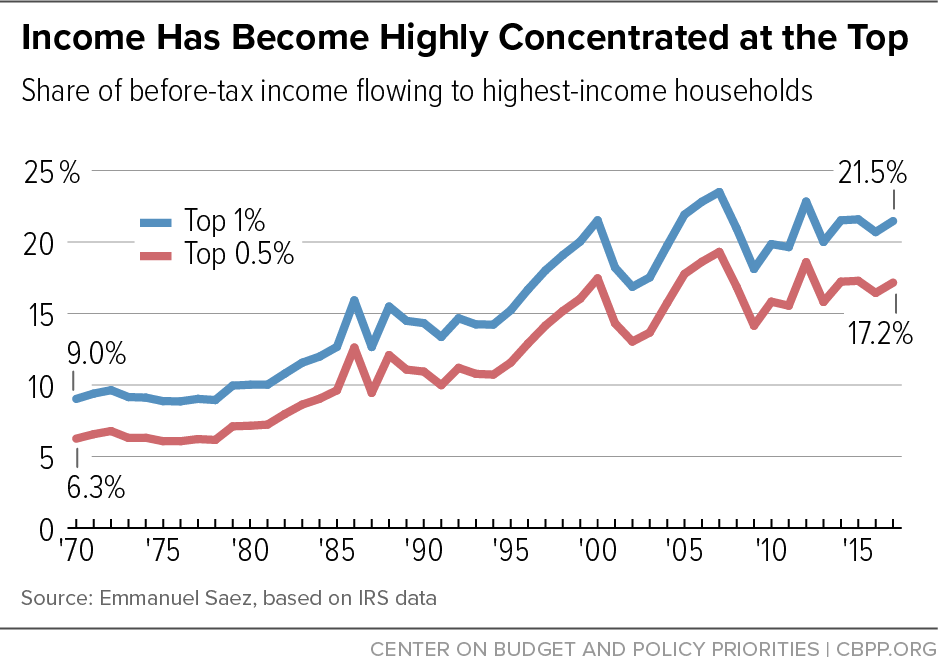
In the early 2000s, policymakers began looking at targeted rate increases for affluent households to help close stubborn budget shortfalls stemming from the 2001 recession, as well as to respond to the increasingly skewed concentration of wealth and income at the top. The top 1 percent of households accounted for 21.5 percent of income in 2017, compared to only 9 percent in 1970.[7] (See Figure 1.)
In 2003, New York launched the trend by enacting a three-year surcharge on incomes above $500,000; California and New Jersey followed suit with millionaires’ taxes in 2004.[8] Overall, 12 states (including the District of Columbia) have enacted rate increases targeted to affluent taxpayers since 2000. Nine of them — California, Connecticut, District of Columbia, Hawaii, Maryland, Minnesota, New Jersey, New York, and Oregon — either still have some form of the policy today or maintained it over a span of several years. The other three (Maine, North Carolina, and Wisconsin) either repealed the policy before implementing it, kept the higher rates for only a short span, or undermined them through later income tax cuts. [9]
In some cases, a so-called “millionaire’s tax” only applies to people with annual incomes of at least $1 million. But the term can also refer to a range of personal income tax increases on the highest incomes, generally starting at about $100,000 or more. For example, California levies top personal income tax rates of 10.3, 11.3, and 12.3 percent on annual individual incomes over $250,000, $300,000, and $500,000, respectively, as well as an additional 1 percent surtax on incomes over $1 million, for a top rate of 13.3 percent on the state’s wealthiest residents. People subject to these top rates still pay the same rates as other state residents on their income below these thresholds, since graduated income tax systems apply different marginal rates to different increments of income, rather than taxing all income at the same rate.[10]
In most cases, states created a new bracket or set of brackets above a higher threshold of income, rather than raise existing tax rates. Minnesota, for example, created a new 9.85 percent bracket for top earners, 2 percentage points above its prior top rate, which applied to incomes over about $250,000 for married couples and $150,000 for single filers (adjusted annually for inflation). Hawaii created three new brackets with rates of 9, 10, and 11 percent — a policy that expired in 2015 but was reauthorized in 2018.[11]
Even modest rate increases on high incomes can generate significant revenue from a relatively small number of taxpayers — namely, the narrow sliver of households at the top of the income distribution, who are most able to afford the cost. In California, just 0.3 percent of taxpayers reported more than $1 million in income when the state’s 2005 millionaires’ tax took effect, yet they accounted for more than 21 percent of all income in the state.[12] When Oregon approved an increase on high-income earners in 2009, the state’s legislative office projected that it would raise nearly $472 million over two years from 2.5 percent of tax filers.[13] And in Maine, a 3 percent surcharge on household incomes above $200,000 that voters approved in 2016 but the legislature repealed and was never implemented would have raised over $320 million a year from fewer than 1 in 40 state taxpayers, according to one estimate.[14]
This report focuses on the eight states that substantially raised top income tax rates since 2000 and have characteristics allowing for reasonable comparisons to other states: California, Connecticut, the District of Columbia, Maryland, Minnesota, New Jersey, New York, and Oregon. It excludes Hawaii, as is done in some academic studies, since its unique geography complicates comparisons to other states.[15]
Track Record of Tax-Raising States Rebuts Dire Predictions
Proposals to raise state income tax rates often spark contentious debate, with anti-tax activists and commentators predicting widespread economic harm. Yet the actual experience of the eight states that have adopted this approach over the past decade belies such claims.
Available data on common measures of economic health, like job creation and per-person income growth, reveal that these tax-raising states have performed comparably to other states in their region after raising taxes. Some states have exceeded their peers across multiple measures, while others have done so only on some measures. Only Connecticut has consistently underperformed relative to its neighbors, likely for reasons unrelated to the state’s income tax levels (see box, “Connecticut’s Economic Struggles Likely Reflect Non-Tax Factors”).
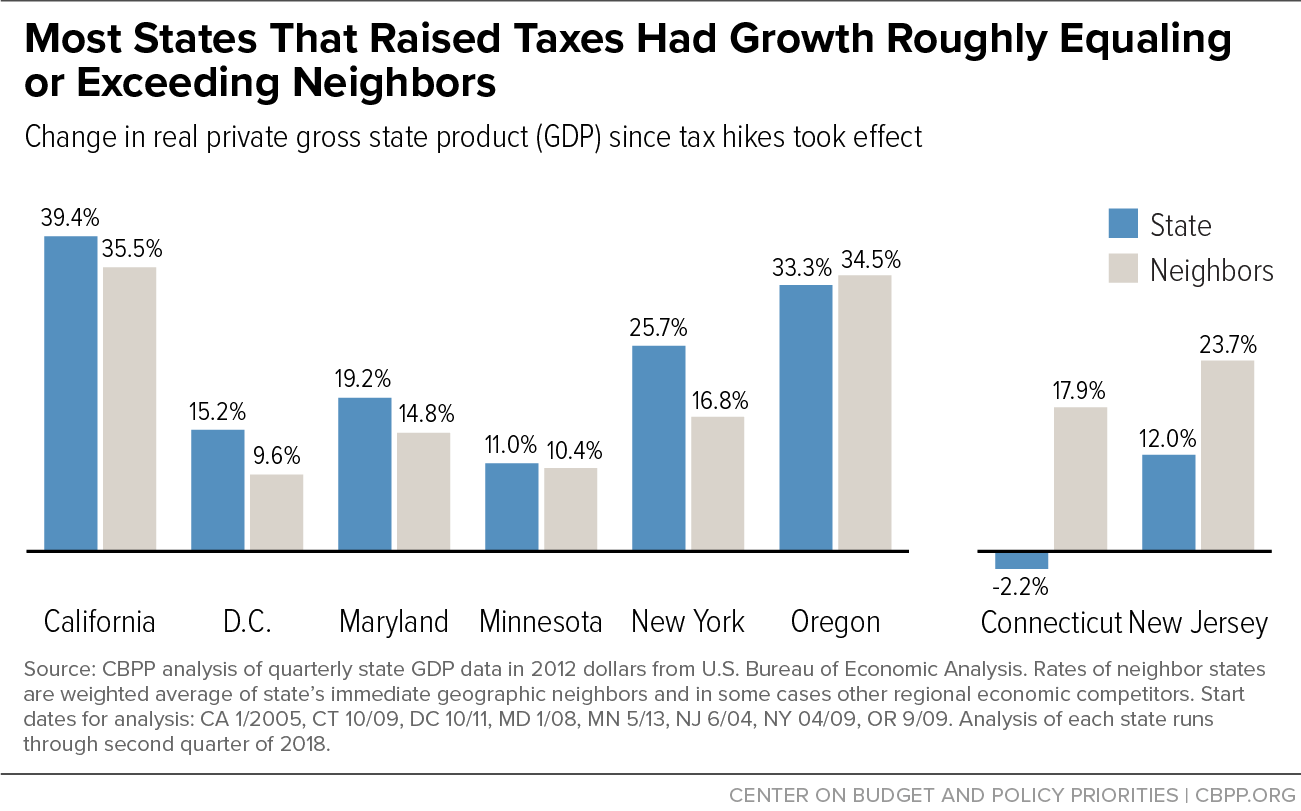
Six of the eight states enacting millionaires’ taxes since 2000 had economic growth about as good or better than neighboring states while the tax cuts were in effect. (See Figure 2.) In four of the eight states (California, the District of Columbia, Maryland, and New York), growth in private-sector gross domestic product (GDP) exceeded other states in the region. Two other states (Minnesota and Oregon) had about the same growth as their neighbors, while in Connecticut and New Jersey, economic growth fell below that of nearby states.
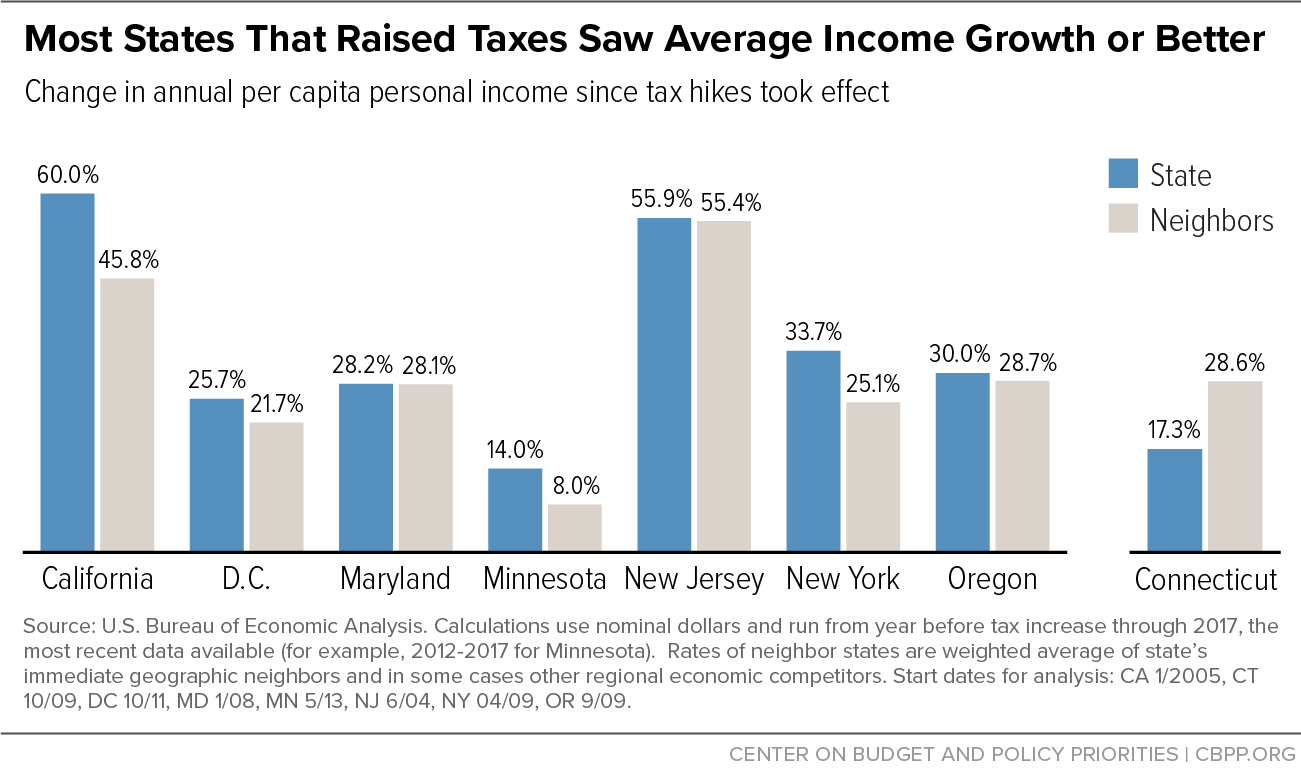
Seven of the eight states had per capita income growth as least as good as their neighbors after enacting a millionaires’ tax. California, Minnesota, and New York exceeded their neighbors’ average by at least 5 percentage points, while the District of Columbia, Maryland, New Jersey, and Oregon met or slightly surpassed it. Connecticut fell behind on this measure, as it did on private-sector GDP growth. (See Figure 3.)
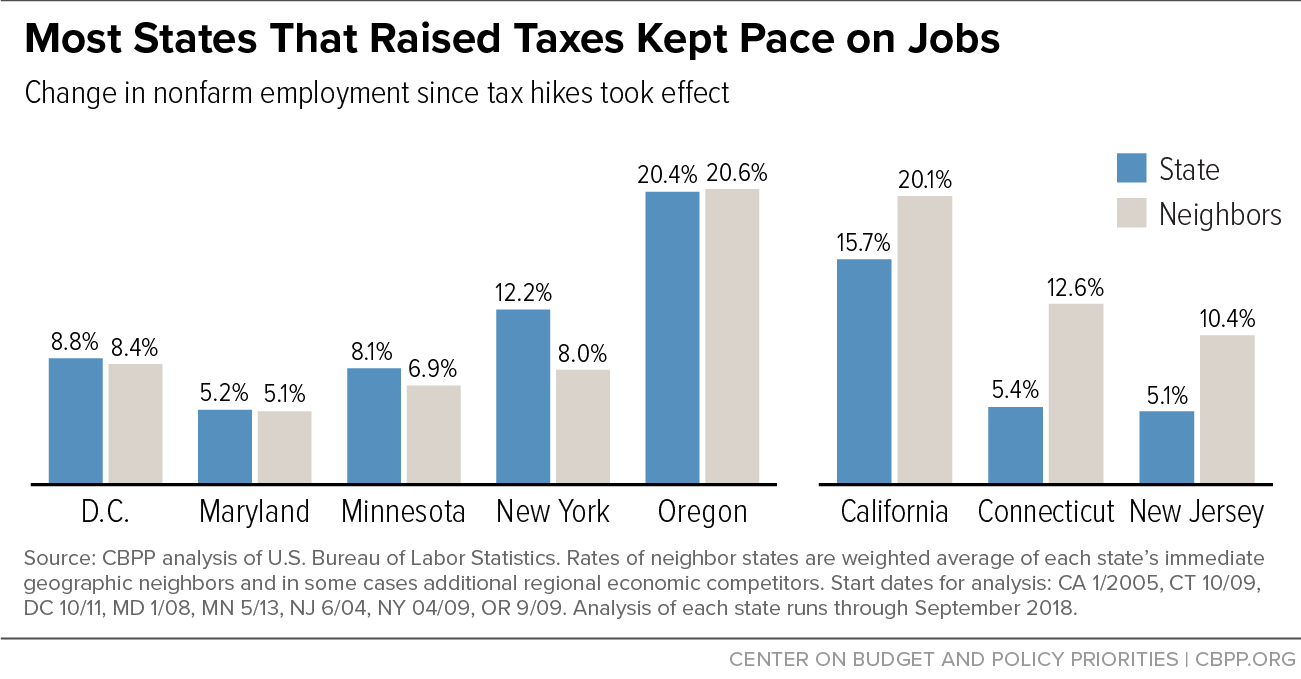
Five of the eight states added jobs at least as quickly as their neighbors. New York added jobs at a significantly higher rate than its neighbors; Minnesota slightly exceeded its neighbors; and the District of Columbia, Maryland, and Oregon kept pace with their neighbors. California, despite strong growth in its overall economy, fell slightly below the regional average on jobs due to above-average employment growth in neighboring states such as Arizona and Nevada, though it exceeded the U.S. average.[16] Connecticut and New Jersey trailed behind on job creation after raising tax rates. (See Figure 4.)
These trends closely resemble these states’ relative economic performance before they raised income tax rates at the top. Six of the eight states had job growth about as good or better than their neighbors in the three years preceding their income tax hike, for example. In the three years before raising taxes in May 2013, for example, Minnesota added jobs at a rate of 4.9 percent, compared to a 5.1 percent average in neighboring states. Since that time, its rate of job growth equals 8.1 percent, versus 6.9 percent in adjacent states. Similar trends play out across the other states and on other economic measures as well.
Connecticut’s Economic Struggles Likely Reflect Non-Tax Factors
Connecticut’s economy has struggled for many years on several measures of state economic health. The state raised personal income tax rates three times in the past decade, in 2009, 2011, and 2015. Because these increases coincide with a period of subpar growth, critics often argue that the tax policies are to blame. But a larger set of factors are likely at play.
- Connecticut relied on outdated economic growth model. Connecticut has relied for many years on a “bedroom community” approach of developing high-end suburban communities as havens for New York City dwellers and company headquarters. But tastes appear to have changed, as young professionals, entrepreneurs, and high-growth startups have increasingly clustered in large metros and other revitalizing urban areas.aConnecticut lacks a city with more than 150,000 people, which makes it challenging to compete for talent with neighboring metros like Boston or New York or with rapidly growing destinations in the Sunbelt.b The head of General Electric, for example, cited the lack of technology centers and communities that appealed to young executives — rather than taxes — as the company’s reason for moving its headquarters to Massachusetts.c
- Connecticut’s high concentration of investors and financial companies has complicated the state’s recovery from the Great Recession. The state’s finance sector took off in the 1980s, as venture capital companies and investors gravitated to its wealthy suburban communities from places like Boston and New York City. Though a significant source of wealth and tax revenue for many years, this tight connection to stock market fortunes became problematic after the financial crash and Great Recession. Evidence suggests that some investment companies and hedge fund managers have relocated in the years since the crash, to both high- and low-tax destinations.d And while the state is home to the third-largest number of hedge funds (behind only California and New York), that number has shrunk by 9 percent in the past three years, according to one estimate, and fund liquidations have exceeded fund launches in five of the past six years.e
- Connecticut has had to devote most new revenues to addressing past fiscal mistakes, rather than to pro-growth investments like schools and public transportation. In the early 1990s, when Connecticut adopted a personal income tax, it used much of the resulting revenue to address debt that had built up over many years. And for about the past 15 years, lawmakers have used much of Connecticut’s revenue growth to pay down pension debt caused largely by their previous shortchanging of required pension payments.f These past decisions have limited the state’s ability to invest adequately in building blocks of growth.g While all states pay for pensions and issue bonds, Connecticut’s pension debt is higher than most states, and Connecticut has relied more on borrowing than other states.h
Most states that pursued a similar path as Connecticut of raising personal income tax rates on affluent taxpayers have had positive economic outcomes, as this paper details. This strongly suggests that other factors, such as those described above, have driven Connecticut’s economic experience far more than income taxes.
a Derek Thompson, “What on Earth Is Wrong With Connecticut?” The Atlantic, July 5, 2017, https://www.theatlantic.com/business/archive/2017/07/connecticut-tax-inequality-cities/532623/.
b Ibid.
c “GE's Leaving Connecticut — Here’s Why You Should Care,” Hartford Courant, January 14, 2016. https://www.courant.com/news/connecticut/hc-why-ge-matters-20160114-story.html.
d Lynnley Browning and Gillian Tan, “Fund Managers are Ditching Wall Street for Florida,” Bloomberg, June 4, 2018, https://www.bloomberg.com/news/articles/2018-06-04/florida-nabs-money-managers-as-property-tax-cap-boosts-its-pitch; “Greenwich: The rich town on the frontline of the U.S. hedge fund fight,” Financial Times, April 24, 2018, https://www.ft.com/content/3bffaf1c-3e35-11e8-b9f9-de94fa33a81e.
e Paul Schott, “Connecticut hedge funds still dominate, but face questions,” Stamford Advocate, updated November 30, 2018, https://www.stamfordadvocate.com/business/article/Connecticut-hedge-funds-still-dominate-but-face-13434256.php.
f As the Connecticut Mirror put it, “the state is divvying up responsibility for paying a historic bill brought on by its own fiscal imprudence over decades: unprecedented pension and other debt costs that already are placing extreme pressure on services and taxpayers.” Keith M. Phaneuf, “Already deep in debt, Connecticut struggles with extremes of wealth and income,” Connecticut Mirror, May 29, 2018, https://ctmirror.org/2018/05/29/already-deep-debt-connecticut-struggles-extremes-wealth-income/.
g Alan Greenblatt, “How Did America's Richest State Become Such a Fiscal Mess?” Governing, September 2017, http://www.governing.com/topics/finance/gov-connecticut-richest-state-fiscal-problems.html.
h Measured as a share of personal income, Connecticut had the third-highest level of general debt from borrowing among the states in 2013, and the eighth-highest unfunded pension liabilities, according to the Pew Charitable Trusts. After accounting for all forms of state long-term obligations — pension liabilities, retiree health care costs, and general debt — Connecticut ranked fifth-highest in 2013, behind Alaska, Hawaii, Illinois, and New Jersey. “Long-Term Obligations Vary as a Share of State Resources,” Pew Charitable Trusts’ Fiscal 50: State Trends and Analysis.
Research Confirms State Personal Income Taxes Don’t Harm Growth
Examining how a state’s tax policies affect its relative economic performance can be difficult, since large-scale trends like job creation and personal income growth depend on many interrelated factors, ranging from local workforce and economic development policies to global forces like trade. Most mainstream academic experts have found that state tax rates may play some role at the margins but likely have little to no impact on states’ overall economic performance. Thus, modest changes to personal income tax rates would be highly unlikely to alter core economic trends.
Empirical studies conducted by economists over the last 40 years find no consensus that lowering state taxes is a good strategy to boost state economic growth and create jobs, or, conversely, that raising taxes dampens economic growth.[17] Studies focusing on narrower issues, such as the impact of state tax levels on entrepreneurship, also find little to no impact. For instance, a rigorous 2012 study commissioned by the U.S. Small Business Administration found “no evidence of an economically significant effect of state tax portfolios on entrepreneurial activity.”[18]
The same is true of research on personal income taxes. Of the 20 major studies published in academic journals since 2000 that examined the effect of state personal income tax levels on broad measures of state economic growth, 15 found little to no significant effect, and one of the others produced internally inconsistent results.[19] (See Appendix II.)
Another recent analysis comes to similar conclusions. A comprehensive literature review by two Oklahoma State University tax experts in 2018 looked at 36 studies, including ten published since 2014. [20] Regarding state tax policies overall, they concluded:
The overall state and local tax burden is not a major driver of economic growth differences across states. The vast majority of the academic studies that examined the relationship between state and local taxes and economic growth found little or no effect. Where [statistically] significant effects were found, they generally were modest at most.
As for state personal income tax taxes in particular, the researchers found evidence suggesting that “states recently reducing their personal income taxes more likely harmed economic growth and states increasing their personal income taxes more likely spurred their economic growth.”
Claims of Widespread Millionaire Migration Appear Unfounded
Opponents of raising income taxes often argue that higher rates will cause affluent residents to flee to lower-tax states, weakening the state’s economy and undercutting revenues. But mainstream research does not support these claims.
A landmark analysis in 2016 by researchers from Stanford University and the U.S. Treasury Department reviewed tax returns for all million-dollar earners nationwide over 13 years and found that millionaires rarely move from one state to another, and when they do, it’s usually not because of taxes.a Of the roughly 500,000 households that report income of $1 million or more, only about 12,000, or 2.4 percent, move to a new state in any given year, compared to 2.9 percent among the general population.b
“The most striking finding of this research is how little elites seem willing to move to exploit tax advantages across state lines,” the researchers note. “Millionaire tax flight is occurring, but only at the margins of statistical and socioeconomic significance.” The primary reasons cited for low migration are family obligations, such as the desire to remain close to grandchildren, and business needs, such as a company’s founder needing to stay close to existing professional networks and customers. As one expert put it following California’s 2013 income tax hikes: “Moving out of state is actually one of the most costly responses [millionaires] could make. . . . Moving to Nevada or Texas or Florida is a very big life change, and means leaving behind family, friends, colleagues and business connections.”c
Another carefully designed study reviewed New Jersey’s 2004 personal income tax increase on high-income households, finding that it “raises nearly $1 billion per year, and tangibly reduces inequality, with little cost in terms of tax flight.”d A later replication of the study by a group of skeptical researchers found that slightly more millionaires may have moved than originally thought, though not nearly enough to sizably reduce the policy’s revenue gains.e
a For example, see Ross Marchand, “Raising Millionaires’ Taxes Will Drive Them Away,” Foundation for Economic Education, January 20, 2018, https://fee.org/articles/raising-millionaires-taxes-will-drive-them-away/; Kari Jahnsen, “Millionaire’s Tax Would Revive ‘Taxachusetts,’” Tax Foundation, June 13, 2017, https://taxfoundation.org/millionaires-tax-massachusetts/.
b Cristobal Young et al., “Millionaire Migration and Taxation of the Elite: Evidence from Administrative Data,” American Sociological Review, Vol. 81 No. 3, 2016, https://web.stanford.edu/~cy10/public/Jun16ASRFeature.pdf.
c Adam Nagourney, “Two-Tax Rise Tests Wealthy in California,” New York Times, February 6, 2013, https://www.nytimes.com/2013/02/07/us/millionaires-consider-leaving-california-over-taxes.html.
d Cristobal Young and Charles Varner, “Millionaire Migration and State Taxation of Top Incomes: Evidence from a Natural Experiment,” National Tax Journal, June 2011.
e See Roger S. Cohen, Andrew E. Lai, and Charles Steindel, “A Replication of “Millionaire Migration and State Taxation of Top Incomes: Evidence from a Natural Experiment,” 2014, https://journals.sagepub.com/doi/abs/10.1177/1091142114537893?journalCode=pfrb; and Cristobal Young and Charles Varner, “A Reply to ‘A Replication of Millionaire Migration and State Taxation of Top Incomes: Evidence from a Natural Experiment,’” 2015, https://web.stanford.edu/~cy10/public/Reply-Public-Finance-Review-2015.pdf.
Millionaires’ Taxes Enabling States to Make Crucial Investments
Targeted income tax increases on high-income households can generate substantial revenues, allowing lawmakers to minimize harmful cuts when budgets are tight as well as to undertake ambitious initiatives such as expanding early education, boosting college access, improving infrastructure, and strengthening “rainy day” funds to prepare for the next recession. For example:
- Minnesota created a new income tax bracket in 2013 for the state’s richest households, along with other changes such as revisions to the state’s tobacco and corporate taxes. The new revenue-raisers prevented more than $600 million in cuts over two years to services such as schools, natural resource protection, and assistance programs for children and seniors,[21] and allowed lawmakers to invest more in residents and communities.[22] In the years following, revenues from the higher taxes and a rising economy enabled the state to make a number of promising investments in education in particular, including making free full-day kindergarten possible in all public school districts,[23] helping more low-income children afford preschool,[24] bolstering financial aid for low- and middle-income college students, and helping stabilize tuition after years of higher education cuts.[25] The state also boosted spending for economic development, affordable housing, and support for local communities.
-
California lawmakers have enacted two millionaires’ taxes since 2000. The first, passed in 2004 and still in effect, levies an additional 1 percent on incomes above $1 million to help local communities fund mental health services such as prevention and early treatment. A rigorous study found that the tax, which raises about $2 billion a year, has helped local governments improve mental health outcomes, minimize unnecessary hospitalizations, and reduce homelessness and incarceration.[26]
In 2012, California voters approved Proposition 30, which added new rates of 10.3, 11.3, and 12.3 percent on varying levels of income starting at $250,000, bringing the state’s top rate to 13.3 percent on incomes above $1 million. The state used the resulting revenues to increase investments in K-12 and college access and to rebuild the state’s “rainy day” fund (see box).
Other states have used targeted personal income tax increases to close stubborn budget shortfalls and stave off harmful budget cuts, especially in the wake of falling state revenues after the Great Recession.
- In Oregon, lawmakers in 2009 approved two new top rates of 10.8 percent and 11 percent on households above $250,000 and $500,000 in income, respectively; the new rates were merged into a single 9.9 percent top bracket in 2012.[27] The policy responded to a pending $4 billion shortfall caused by prior state tax policy choices and declining revenues. The tax increase, which raised an estimated $349 million over the first two years,[28] was part of a balanced approach to the state’s budget that combined new revenues with federal stimulus funds to reduce the harm to core state services.[29]
- Several other states raised personal income tax rates on high earners in the wake of the Great Recession to minimize harmful budget cuts caused by falling revenues.[30] The District of Columbia, for instance, added a top rate of 8.95 percent on income over $350,000 in 2011, after personal income tax revenues had fallen by nearly 20 percent over the prior two years.[31]New York in 2009 enacted a millionaires’ tax estimated at the time to raise $4 billion a year, after projected revenues for the coming fiscal year came in $3.2 billion below original expectations.[32] And in 2012, Maryland approved a package of rate increases on six-figure earners designed to prevent more than $400 million in cuts to schools, police, and other services.[33]
California Using New Revenues for Variety of Investments
California leveraged the substantial revenue it gained from personal income tax increases on high-income earners into sustained pro-growth investments. The 2013 income tax increases, which voters approved through Proposition 30 in November 2012, generated an estimated $8.1 billion in the 2018-19 budget year, or about 6 percent of the state’s personal income tax revenues.a An estimated 98.6 percent of the additional dollars were paid by the highest-income 1 percent of residents.b
The income tax hikes, combined with a rising economy, helped policymakers devote considerable new revenues to public education and other goals. State and local funding for K-12 and community colleges rose from $47 billion in 2011-12 to $72 billion in 2016-17, boosting per-student K-12 spending by 14 percent or about $1,325.c And when voters reauthorized the high-income rates in 2016, the state’s legislative fiscal office estimated that roughly half of the new revenues would support K-12 education and community colleges.d
The revenue influx occurred alongside California’s innovative reform to its K-12 funding formula, which strengthened state funding for districts with many disadvantaged students, particularly English learners, foster youth, and students from low-income families. The revised formula particularly benefits children of color and lays the groundwork for a more equitable economy.e
California also used the added revenues to expand its Earned Income Tax Credit, set up a new retirement saving option for private-sector employees, improve access to affordable health care through California’s Medicaid program (Med-Cal), and shore up the rainy day fund.f When voters renewed the income tax increases in 2016, state experts estimated the revenue would drive at least an extra $60 million a year into the state’s reserves, and perhaps as much as $1.5 billion a year, depending on broader economic trends and stock market performance.g
a California Revenue Estimates, May Revision 2018-2019, http://www.ebudget.ca.gov/2018-19/pdf/Revised/BudgetSummary/RevenueEstimates.pdf.
b William Chen, “What Has Proposition 30 Meant for California?” California Budget & Policy Center, September 2016, https://calbudgetcenter.org/resources/what-has-proposition-30-meant-for-california/.
c Ibid.
d California’s constitution requires state policymakers to spend a minimum amount on K-12 schools and community colleges each year, officially known as the “minimum guarantee.” This funding floor grows over time based on growth in state tax revenues, the economy, and student attendance. “Proposition 55: Tax Extension to Fund Education and Healthcare. Initiative Constitutional Amendment,” California Legislative Analyst’s Office, July 18, 2016, https://lao.ca.gov/ballot/2016/Prop55-110816.pdf.
e So far, the formula appears to be producing substantial benefits for low-income students and students of color. These benefits could have been even greater if all districts had targeted all funding as intended to primarily benefit the targeted populations. “California’s Local Control Funding Formula Is Increasing Student Achievement and Graduation Rates,” Learning Policy Institute, February 2, 2018, https://learningpolicyinstitute.org/press-release/californias-local-control-funding-formula-increasing-student-achievement. See also Julia E. Koppich and Daniel C. Humphrey, “The Local Control Funding Formula (LCCF): What Have We Learned After Four Years of Implementation?” Getting Down to Facts II, September 2018, https://gettingdowntofacts.com/sites/default/files/2018-09/GDTFII_Report_Koppich-Humphrey.pdf.
f Chris Hoene, “Tax Day 2018 Is a Chance to Consider How the California and Federal Paths Differ,” California Budget Project. April 17, 2018, https://calbudgetcenter.org/blog/tax-day-2018-is-a-chance-to-consider-how-the-california-and-federal-paths-differ/.
g “Proposition 55: Tax Extension to Fund Education and Healthcare. Initiative Constitutional Amendment,” California Legislative Analyst’s Office. July 18, 2016.
New Revenues for Public Investments Can Help State Economies Long-Term
Expert research and evidence from other states indicate that sustained support for the kinds of public investments made possible by personal income tax increases can help states improve their residents’ well-being and expand opportunity, especially for people of color and other marginalized communities. That, in turn, can help bolster states’ overall economies over time.[34]
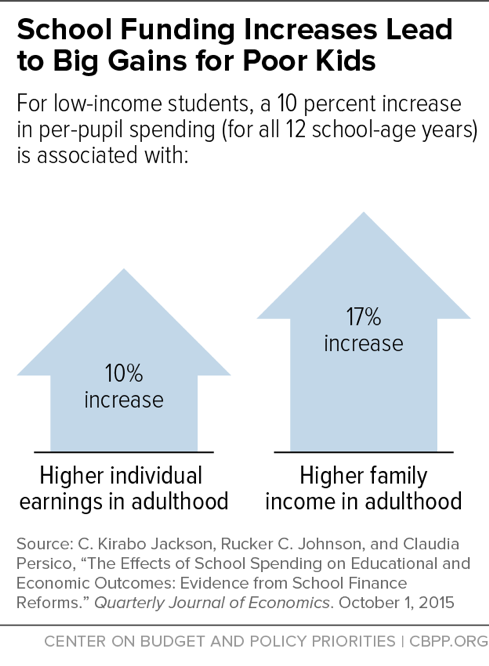
High-quality education. Well-funded public schools help children get a good start in life, especially when funding targets investments shown to produce better outcomes, such as early learning programs, smaller classes, and higher teacher quality.[35] One extensive nationwide study examined the relationship between school funding and student outcomes from the early 1970’s to 2011. It found that low-income children whose school districts received a 10 percent increase in per-pupil spending before they began their 12 years of public school had 10 percent higher earnings — and 17 percent higher family income — in adulthood, were likelier to complete high school, and were less likely as adults to be poor.[36] (See Figure 6.)
Long-term economic benefits also flow from investments beyond the K-12 system, especially early education and affordable access to college. High-quality preschool improves not only children’s academic performance but also recipients’ earnings in adulthood, one landmark study found. The analysis estimated that workers’ increased earnings alone outweigh the cost of preschool by more than five times.[37]
Affordable access to higher education is important as well, but many states have underfunded their public colleges, universities, and financial aid in recent years.[38] When students from low- and high-income families attend the same college, they earn similar salaries post-college; this helps level the playing field for students of different backgrounds, providing an added economic boost down the road.[39] These are among the many reasons why states with a better-educated workforce tend to have higher wages and better productivity in the long run, as one study demonstrated.[40]
Stronger family finances. State economies also thrive when families have enough income to afford the basics, invest in their own well-being, and have enough left over to support local shops, restaurants, and financial institutions. For example, a growing body of research finds that young children in low-income families that get an income boost from policies such as the Earned Income Tax Credit (EITC) tend to do better and go further in school because the additional resources help parents better meet their needs.
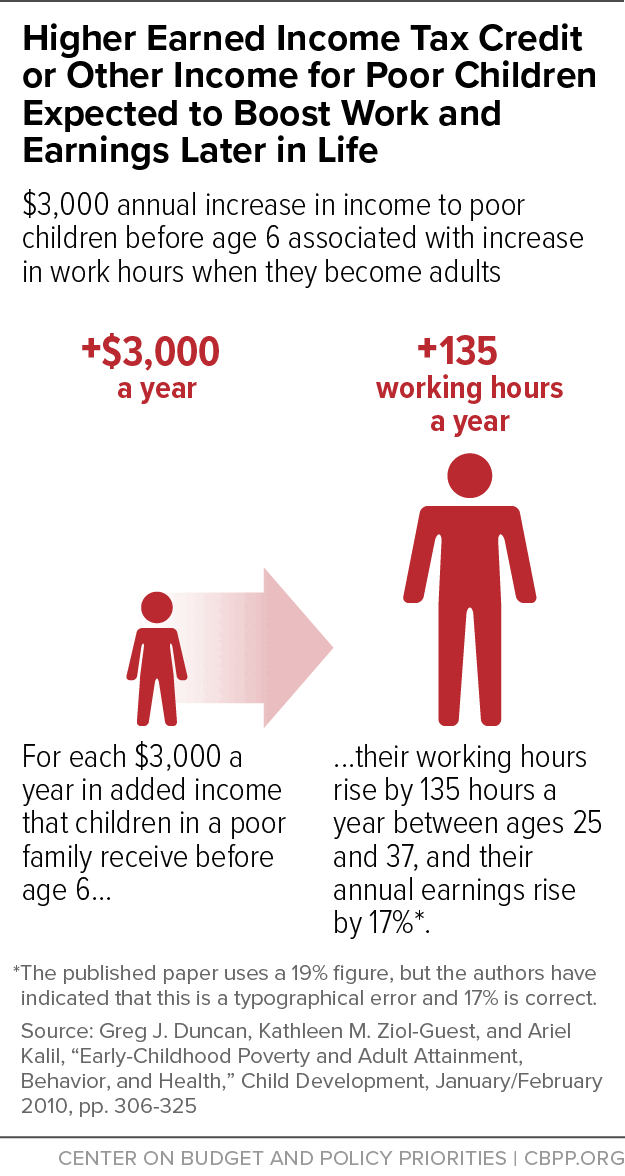
And because children in low-income families that receive income boosts attain more skills and education, they tend to work more and earn more as adults. Each $3,000 a year in added income that children in a poor family receive before age 6 leads to an estimated 135 more working hours a year between ages 25 and 37, plus a 17 percent increase in annual earnings, research has found.[41] (See Figure 7.) This helps communities and the economy because it means more people and families are on solid ground and fewer need help over the long haul.
Better infrastructure and amenities. States that generate new revenues for targeted investments in key infrastructure systems can create jobs now and improve economic growth and job quality in the long run.[42] Businesses need well-maintained roads, rails, and ports to get products to market, and local communities need well-functioning water, sewer, and traffic systems to maintain health and preserve a high quality of life. Expanding and improving a state’s broadband internet infrastructure can especially help smaller towns and rural areas, where unreliable access to high-speed internet poses a steep obstacle to residents looking to start a business or obtain an online credential. [43]
State investment in other public amenities such as greenspace, libraries, and cultural institutions can give communities a competitive edge, too. Both entrepreneurs[44] and well-educated professionals[45] are often drawn to communities with attractive amenities and pleasant neighborhoods, according to research. And larger companies looking to relocate or expand increasingly take the quality and attractiveness of local services and amenities into account. As Amazon noted in its 2017 search for a second headquarters, “We want to invest in a community where our employees will enjoy living, recreational opportunities, educational opportunities, and an overall high quality of life.”[46]
Improved planning and review. States can maximize the value of new tax revenues by making sure they’re spending existing dollars efficiently. For example, a growing number of states are saving money and improving residents’ well-being by reforming outdated criminal justice systems and dramatically reducing overincarceration. High rates of adult incarceration are costly to families, communities, and state budgets, particularly communities of color overly targeted by harsh incarceration policies.[47]
States also can improve their planning practices, such as by strengthening state “rainy day” funds. In hard times, these funds help protect state investments that promote economic growth and provide taxpayers with vital services.
Millionaires’ Taxes Can Help States Advance Racial Equity
Targeted income tax hikes for high-income residents can allow state lawmakers to pursue another crucial goal beyond raising revenue and curbing runaway economic inequality: redressing historic and current racial inequities and building a more inclusive economy.
Although policymakers typically think of tax policy as neutral with respect to race, most state tax structures worsen racial and ethnic inequities because they fall harder on lower-income households, which are disproportionately households of color.[48] Black and Latinx households comprise 22 percent of total U.S. population, for example, yet account for nearly 30 percent of the nation’s poorest households.[49] And in 45 of 50 states, lower-income households pay a larger share of their income in state and local taxes than high-income households.[50] The poorest fifth of U.S. households pay an estimated 11.4 percent of their income in state and local taxes, on average, whereas the top 1 percent of households pay just 7.4 percent.[51]
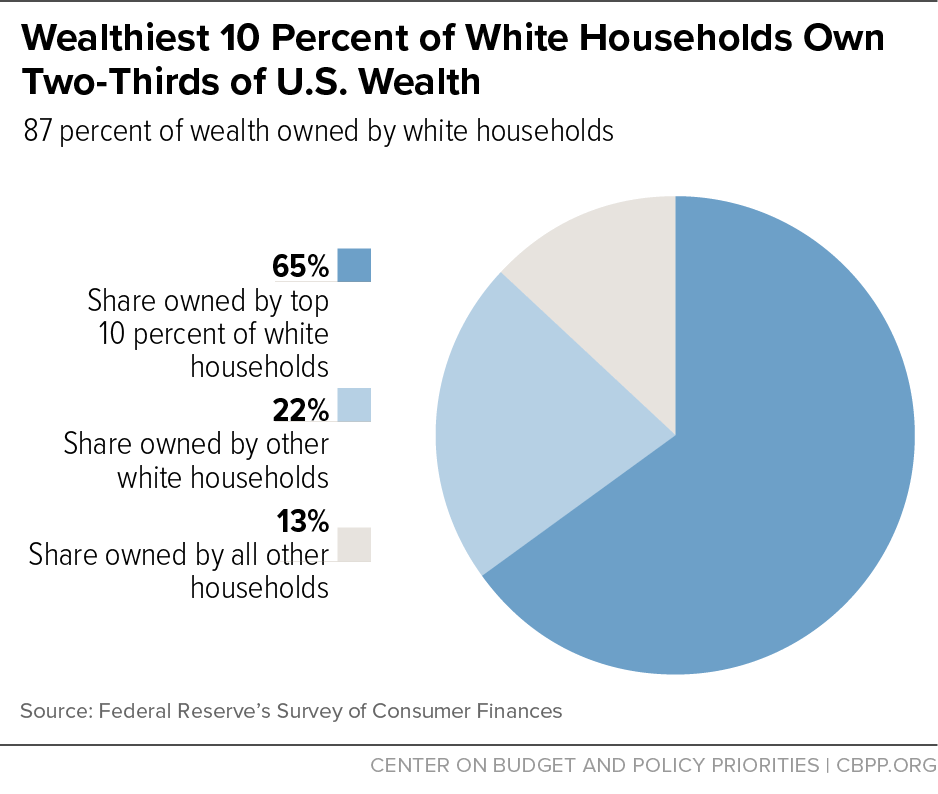
Millionaires’ taxes can be a sound strategy for making state tax systems more equitable, for two reasons. First, they fall exclusively on taxpayers at the very top, who are disproportionately white. White families are about three times more likely than Black and Latinx families to be among the nation’s top 1 percent of earners, according to one estimate.[52] Racial gaps in wealth are also stark: white families comprise 65 percent of U.S. households but own an estimated 87 percent of the nation’s wealth, whereas people of color make up 35 percent of all households but own just 13 percent of the wealth.[53] (See Figure 8.)
Second, targeted income tax increases provide resources that lawmakers can use to improve schools in low-income communities of color, invest in safer water systems and other public infrastructure that supports these communities, expand access to affordable health care, and make other crucial investments that reduce racial and ethnic inequities and help build an economy whose benefits are more widely shared. One example is Minnesota, which in 2013 adopted a new income tax rate on very high incomes and used the revenue in part to help more low-income children attend high-quality preschool programs, providing an outsized benefit to young people of color.[54]
Conclusion
Raising income tax rates on high-income residents can enable states to boost investment in education, infrastructure, and other vital services that strengthen local communities and aid long-term economic growth. Similar policies enacted in the past decade haven’t harmed states’ ability to add jobs or compete with neighboring states, evidence shows. Mainstream experts largely agree: modest shifts in state income tax rates, including rate hikes on high-income residents, are unlikely to affect short-term growth. And the additional revenues may provide economic benefits down the road if they go toward proven, targeted investments like high-quality education and tax credits for working families, which bolster opportunity and help people maximize their economic contributions over time.
Appendix I: States Raising Income Tax Rates at the Top
| APPENDIX TABLE 1 | ||||||
|---|---|---|---|---|---|---|
| Nine States Enacted Long-Lasting Millionaires Taxes Since 2000 | ||||||
| Primary or First Tax Increase Enacted or Effective | New Top Rate | New Top Income Threshold (single; married filing jointly) | Current Top Rate | Current Top Income Threshold (single; married filing jointly) | Important Notes or Context | |
| California | January 2005 | 10.30% | $1 million | 13.30% | $1 million | In 2005, lawmakers enacted a 1% surtax on incomes over $1 million. In 2012, voters approved adding three new brackets (10.3%, 11.3%, and 12.3%), bringing the top rate to 13.3% on incomes above $1 million; they reauthorized the added rates in 2016. |
| Connecticut | Signed October 2009, retroactive to January 2009 | 6.50% | $500,000; $1 million | 6.99% | $500,000; $1 million | Lawmakers passed income tax increases in 2009, 2011, and 2015; the 2011 package was the largest. |
| District of Columbia | October 2011 | 8.95% | $350,000 | 8.95% | $1 million | In 2011, D.C. lawmakers added a new 8.95% top bracket on incomes above $350,000. In 2017, they lowered the rate on incomes of $350,000-$1 million from 8.95% to 8.75%, keeping the 8.95% rate for households above $1 million. |
| Hawaii | Signed May 2009, retroactive to January 2009 (expired end of 2015, reauthorized starting 2018) | 11.00% | $200,000; $400,000 | 11.00% | $200,000; $400,000 | New brackets of 9%, 10%, and 11% that lawmakers enacted in 2009 expired at the end of 2015, dropping the top marginal rate to 8.3%, but they reauthorized those top brackets in 2018. |
| Maryland | January 2008 | 6.25%* (up to 9.45% including local tax) |
$1 million | 5.75% (up to 8.95% including local tax) |
$250,000; $300,000 | In 2008, Maryland added four new income tax brackets, including a top rate of 6.25% on income over $1 million. That top rate expired at the close of 2011 but a broader set of reforms enacted in 2012 remain in place, including a new top rate of 5.75% on incomes above $250,000 (single) and $300,000 (married). Maryland counties also levy local income taxes, ranging from 1.75% to 3.2% in 2018. |
| Minnesota | Signed May 2013 (retroactive to January 2013) | 9.85% | $152,540; $254,240 | 9.85% | $160,020; $266,700 | Minnesota added a new top bracket of 9.85% in 2013 on income over $152,540 (single) and $254,240 (married); these thresholds are adjusted annually for inflation. Additional tax changes enacted in 2017 reduced some prior revenue gains but did not alter the top rate. |
| New Jersey | June 2004 (retroactive to January 2004) | 8.97% | $500,000 | 10.75% | $5 million | Lawmakers enacted an 8.97% top rate in 2004. In 2009 they passed a set of one-year surtaxes of 8%, 10.25%, and 10.75%. In 2018 they approved a new permanent top rate of 10.75% on incomes above $5 million. |
| New York | Signed April 2009 (retroactive to January 2009) | 8.97% | $500,000 | 8.82% | $1 million, $2 million | A 2009 tax boosted New York’s top rate to 8.97% on incomes above $500,000. It expired at the end of 2011 but lawmakers replaced it with a new top rate of 8.82% on incomes above $1 million (single) and $2 million (married). |
| Oregon | Passed Sept. 2009, retroactive to January 2009 (ratified by voters Jan. 2010) | 11.00% | $250,000; $500,000 | 9.90% | $125,000; $250,000 | Measure 66 created new brackets of 10.8% and 11% for tax years 2009-2011 and, starting in 2012, merged them into a single new top rate of 9.9% on incomes above $125,000 (single) and $250,000 (married). |
Appendix II: Experience of States Raising Income Taxes in Line with Academic Research
A 2015 CBPP report reviewed the major studies published from 2000 to 2014 on the relationship between personal income taxes and economic growth.[55] The table below provides additional details on five relevant studies published in academic journals or an equivalent since then. In total, of 20 major studies on the subject published in academic journals since 2000, 15 found no significant effects, and one of the others produced internally inconsistent results.
| APPENDIX TABLE 2 | ||
|---|---|---|
| Most Major Studies Published in Academic Journals Since 2014 Find That State Personal Income Tax Levels Do Not Affect Economic Growth | ||
| Study | Do Personal Income Tax Levels Reliably Affect Economic Growth? | Key Excerpts |
| John E. Anderson and Jennifer Bernard, “Temporal and Spatial Effects of State Taxes on Economic Growth,” Annual Conference on Taxation of the National Tax Association, November 9-11, 2017. | No | “While the work of some previous studies has found strong inverse relationships between state taxes and economic growth, our results indicate that the temporal tax-growth relationship is sensitive to model specification and the time period of analysis. This finding also extends to spatial effects; although tax burden . . . often enters weakly negative into the estimation, it is very fragile to changes in the model.” |
| William G. Gale, Aaron Krupkin, and Kim Rueben, “The Relationship between Taxes and Growth at the State Level: New Evidence,” National Tax Journal, Vol. 68, Issue 4, 2015. | No | “We show that including measures of the marginal tax rate do not affect the results for tax revenues and that marginal tax rates generally do not enter into the growth equations. …Consistent with these aggregate effects, we show that marginal tax rates generally have no impact on employment and statistically significant, but economically small, effects on the rate of firm formation. The overall impression generated by these results is that state-level economic growth is not closely tied to state-level tax policy.” |
| Xavier Giroud and Joshua Rauh, “State Taxation and the Reallocation of Business Activity: Evidence from Establishment-Level Data,” Center for Economic Studies, U.S. Census Bureau, Working Papers 17-02, 2017. | Yes | “Opposite effects of around half of these magnitudes are observed in response to tax changes in the other states in which firms operate, so that around half of the baseline effect is offset by reallocation of activity across states. This lends strong support to the view that tax competition across states is economically relevant. . . . We find evidence consistent with substantial responses of these firms to state tax rates for the relevant tax rules. Corporate entities reduce the number of establishments per state and the number of employees and amount of capital per plant when state tax rates increase. Pass-through entities respond similarly to changes in state-level personal tax rates, although in somewhat smaller magnitude.” |
| Andrew Ojede, Bebonchu Atems, and Steven Yamarik, “The Direct and Indirect (Spillover) Effects of Productive Government Spending on State Economic Growth,” Growth and Change, Vol. 49 No. 1, 2018. | No | “Regardless of the financing source, productive higher education and highway spending have strong positive short- and long-run direct as well as indirect effects on state real income per capita growth. . . . Second, major revenue sources such as individual income tax, corporate tax, deficit financing that are used to finance productive government spending have negative but statistically insignificant short and long-run direct and indirect effects on growth.” [emphasis added] |
| Soledad Artiz Prillaman and Kenneth J. Meier, “Taxes, Incentives, and Economic Growth: Assessing the Impact of Pro-business Taxes on U.S. State Economies,” Journal of Politics, April 2014. | No | “The burden of nonbusiness taxes (especially sales and personal income taxes) is on the consumers so the association between a decrease in nonbusiness taxes and growth of personal income is quite logical. However, a 10% decrease in nonbusiness tax receipts (as a percentage of GSP) only results in a 0.45% increase in the growth rate of per capita personal income. Although this relationship is significant, it is not economically substantial and clearly not a major determinant of personal income growth. Instead, state expenditures on education, public welfare, and health prove to be policy-based determinants with significant and substantively large effects on the growth rate of personal income.” |
End Notes
[1] Overall, 12 states (including the District of Columbia) have enacted rate increases targeted to affluent taxpayers since 2000. But three states (Maine, North Carolina, and Wisconsin) either repealed the policy before implementing it, kept the higher rates for only a short span, or undermined them through later income tax cuts. A fourth state, Hawaii, is excluded from the analysis because its unique geography complicates comparisons to neighboring states.
[2] Michael Leachman and Michael Mazerov, “State Personal Income Tax Cuts: Still a Poor Strategy for Economic Growth,” Center on Budget and Policy Priorities, updated May 14, 2015, https://www.cbpp.org/research/state-budget-and-tax/state-personal-income-tax-cuts-still-a-poor-strategy-for-economic.
[3] Dan S. Rickman and Hongbo Wang, “U.S. State and Local Fiscal Policy and Economic Activity: Do We Know More Now?” August 7, 2018, https://mpra.ub.uni-muenchen.de/88422/1/MPRA_paper_88422.pdf.
[4] “California’s Tax System: A Primer,” California Legislative Analyst Office, January 2001, https://lao.ca.gov/2001/tax_primer/0101_taxprimer_chapter1.html.
[5] “Individual Income Tax: History of Major Tax Changes,” https://www.tax.ohio.gov/portals/0/taxeducation/history/individual_income.pdf.
[6] Three of these states — North Dakota, Rhode Island, and Vermont — effectively had top income thresholds above that level because at the time they still “piggybacked” off of federal tax brackets. Arizona and Ohio were the only two states in 2000 with top income brackets explicitly enacted by state lawmakers to start above $100,000. “State Individual Income Tax Rates 2000-2018,” Tax Policy Center, February 28, 2018, https://www.taxpolicycenter.org/statistics/state-individual-income-tax-rates-2000-2018.
[7] Emmanuel Saez, “Striking it Richer: The Evolution of Top Incomes in the United States (Updated with 2017 preliminary estimates),” October 13, 2018, https://eml.berkeley.edu/~saez/saez-UStopincomes-2017.pdf.
[8] New York’s three-year surcharge, which lasted from 2004 to 2006, applied a 7.7 percent rate to incomes above $500,000 and a slightly lower rate on incomes above $100,000. In 2004, New Jersey lawmakers set a new top rate of 8.97 percent on incomes over $500,000 for single individuals and $1 million for households. And in that same year, California raised its top income tax rate to 10.3 percent on incomes above $1 million, regardless of filing status. Jon Shure, Elizabeth McNichol, and Andrew Nicholas, “Raising State Income Taxes on High-Income Taxpayers,” Center on Budget and Policy Priorities, revised November 11, 2009, https://www.cbpp.org/research/raising-state-income-taxes-on-high-income-taxpayers.
[9] North Carolina, for example, initially responded to the Great Recession with a package of revenue-raisers including a temporary surtax of 2-3 percent on higher earners, which brought the state’s top marginal rate to 10.75 percent in 2009 and 2010. However, policymakers chose not to renew those measures, instead embarking on an aggressive round of tax and spending cuts in later years.
[10] For more details on how marginal rates work in a graduated income tax system, see “Policy Basics: Marginal and Average Tax Rates,” Center on Budget and Policy Priorities, updated April 18, 2018. https://www.cbpp.org/research/federal-tax/policy-basics-marginal-and-average-tax-rates.
[11] “Tax Law Changes from the 2017 Regular Legislative Session,” Hawaii Department of Taxation, August 7, 2017, http://files.hawaii.gov/tax/news/announce/ann17-08.pdf.
[12] Charles Varner, Cristobal Young, and Allen Prohofsky, “Millionaire Migration in California: Administrative Data for Three Waves of Tax Reform,” Stanford Center on Poverty and Inequality, July 2018, https://inequality.stanford.edu/publications/media/details/millionaire-migration-california-impact-top-tax-rates.
[13] “Measures 66 and 67,” Oregon Legislative Revenue Office, November 2009, https://www.oregonlegislature.gov/lro/Documents/11-19-09%20RR%206-09%20Measures%2066-67.pdf.
[14] Christian Milneil, “Map: Where are the higher-income households that would pay 3% education surcharge?” Portland Press Herald, updated June 29, 2017, https://www.pressherald.com/2017/06/28/interactive-map-wholl-pay-3-education-surcharge-stands-mostly-democrats/.
[15] Although Hawaii’s unique geography makes comparison to any “neighboring” states difficult and potentially misleading, a cursory review indicates that the state’s economy mostly kept pace with the United States as a whole during the 2009-2015 span that the state’s tax increases were in effect. Hawaii had 8.5 percent job growth during that span, compared to 9.1 percent nationwide. Its private sector GDP grew by 15.3 percent, compared to a U.S. average of 16 percent. And, its per capita personal incomes grew by 16.9 percent, not far below the nationwide gain of 19.6 percent.
[16] Compared to California’s 15.7 percent job growth over the span (January 2005 to September 2018), rates in neighboring states were 17.7 percent in Arizona, 17.5 percent in Nevada, 18.2 percent in Oregon, and 24.4 percent in Washington. Job growth nationwide during this span was 12.8 percent.
[17] Michael Mazerov, “Academic Research Lacks Consensus on the Impact of State Tax Cuts on Economic Growth.” Center on Budget and Policy Priorities, June 17, 2013, https://www.cbpp.org/research/academic-research-lacks-consensus-on-the-impact-of-state-tax-cuts-on-economic-growth.
[18] Donald Bruce and John Deskins, “Can State Tax Policies Be Used to Promote Entrepreneurial Activity?” Small Business Economics, 2012. A more recent Federal Reserve working paper, under formal review as of 2018, found that while state corporate income tax rates appear to hamper entrepreneurship in some cases, “personal tax rates have no detectable effect on startup activity.” E. Mark Curtis and Ryan A. Decker, “Entrepreneurship and State Taxation,” Board of Governors of the Federal Reserve System, Finance and Economics Discussion Series 2018-003, January 2, 2018, https://doi.org/10.17016/FEDS.2018.003.
[19] The five studies published from 2014 to 2018 are described in Appendix II. The 15 studies published between 2000 and 2014 are described in more detail in Leachman and Mazerov.
[20] Rickman and Wang. Though the paper apparently has not been published in an academic journal, Rickman and Wang authored a rigorous review of state tax policy experiments in Kansas and Wisconsin that was published in Regional Science and Urban Economics in 2018 (https://www.sciencedirect.com/science/article/pii/S0166046217300935). The findings of that study are summarized in Max Ehrenfreund, “Kansas’s conservative experiment may have gone worse than people thought,” Washington Post, June 15, 2017. https://www.washingtonpost.com/news/wonk/wp/2017/06/15/kansas-conservative-experiment-may-have-gone-worse-than-people-thought/?utm_term=.bcbf8b883bd4.
[21] Michael Leachman, “Minnesota’s Tax Plan a Recipe for Future Growth,” Center on Budget and Policy Priorities, May 21, 2013, https://www.cbpp.org/blog/minnesotas-tax-plan-a-recipe-for-future-growth.
[22] The state’s next two-year budget allocated $573 million to new spending, with K-12 education, higher education, and public safety getting the largest shares. “Opportunities Missed and Taken in the 2015 Legislative Session,” Minnesota Budget Project, July 2015, http://www.mnbudgetproject.org/research-analysis/minnesota-budget/proposals-budget-outcomes/opportunities-missed-and-taken-in-the-2015-legislative-session.
[23] Kathryn Baron, “Free, Full-Day Kindergarten Begins for Minnesota Children,” Education Week, September 2, 2014, http://blogs.edweek.org/edweek/time_and_learning/2014/09/free_full-day_kindergarten_in_minnesota.html.
[24] Don Davis, “Minnesota hands out $25 million to launch pre-kindergarten programs,” Duluth News Tribune, August 8, 2016, https://www.duluthnewstribune.com/news/education/4090351-minnesota-hands-out-25-million-launch-pre-kindergarten-programs.
[25] “Legislature’s higher education budget makes some financial aid investments but misses important opportunity,” Minnesota Budget Project, May 16, 2017, http://www.minnesotabudgetbites.org/2017/05/16/legislatures-higher-education-budget-makes-some-financial-aid-investments-but-misses-important-opportunity/.
[26] J. Scott Ashwood et al., “Evaluation of the Mental Health Services Act in Los Angeles County,” RAND Corporation, 2008, https://www.rand.org/pubs/research_reports/RR2327.html.
[27] “Tax Law Changes 1980 to 2014,” https://www.oregon.gov/DOR/programs/gov-research/Documents/14_tax_law_changes.pdf.
[28] “Measures 67 and 66 Analysis,” Oregon Legislative Revenue Office, November 2011, https://www.ocpp.org/media/uploads/documents/2011/20111117_LRO_66and67update.pdf.
[29] Chuck Marr and Michael Leachman, “Oregon Voters’ Approval of Tax Increase Noteworthy as Federal Tax Debate Opens,” Center on Budget and Policy Priorities,” February 17, 2010, https://www.cbpp.org/research/oregon-voters-approval-of-tax-increase-noteworthy-as-federal-tax-debate-opens.
[30] Nicholas Johnson, Catherine Collins, and Ashali Singham, “State Tax Changes in Response to the Recession,” Center on Budget and Policy Priorities, March 9, 2010, https://www.cbpp.org/research/state-tax-changes-in-response-to-the-recession.
[31] “D.C. Tax Facts,” District of Columbia Office of Revenue Analysis, 2017, https://cfo.dc.gov/sites/default/files/dc/sites/ocfo/publication/attachments/Tax%20Facts%202017.pdf.
[32] Nicholas Confessore, “Albany Agrees on a Plan to Raise Taxes on Top Earners,” New York Times, March 28, 2009, https://www.nytimes.com/2009/03/29/nyregion/29tax.html.
[33] Aaron C. Davis, “Md. passes income tax hike on six-figure earners,” Washington Post, May 16, 2012, https://www.washingtonpost.com/local/md-politics/2012/05/16/gIQAfPutUU_story.html.
[34] Erica Williams, “A Four-Point Fiscal Policy Blueprint for Building Thriving State Economies,” Center on Budget and Policy Priorities, updated October 5, 2017, https://www.cbpp.org/research/state-budget-and-tax/a-fiscal-policy-agenda-for-stronger-state-economies.
[35] Bruce Baker, “Does Money Matter in Education?” Albert Shanker Institute, 2016, http://www.shankerinstitute.org/sites/shanker/files/moneymatters_edition2.pdf.
[36] C. Kirabo Jackson, Rucker C. Johnson, and Claudia Persico, “The Effects of School Spending on Educational and Economic Outcomes: Evidence from School Finance Reforms,” Quarterly Journal of Economics, Vol. 131, Issue 1, February 1, 2016, https://doi.org/10.1093/qje/qjv036.
[37] Timothy Bartik, “From Preschool to Prosperity: The Economic Payoff to Early Childhood Education,” W.E. Upjohn Institute for Employment Research, 2014, http://research.upjohn.org/cgi/viewcontent.cgi?article=1246&context=up_press.
[38] Since the 2008 school year, average annual published tuition has risen by $2,651 nationally, or 36 percent. The average sticker price at public four-year institutions has increased by more than 60 percent in seven states, more than 40 percent in 20 states, and more than 20 percent in 40 states. Michael Mitchell et al., “Unkept Promises: State Cuts to Higher Education Threaten Access and Equity,” Center on Budget and Policy Priorities, October 4, 2018, https://www.cbpp.org/research/state-budget-and-tax/unkept-promises-state-cuts-to-higher-education-threaten-access-and.
[39] Raj Chetty et al., “Mobility Report Cards: The Role of Colleges in Intergenerational Mobility,” July 2017, http://www.equality-of-opportunity.org/papers/coll_mrc_paper.pdf.
[40] Noah Berger and Peter Fisher, “A Well-Educated Workforce Is Key to State Prosperity,” Economic Policy Institute, August 22, 2013, http://www.epi.org/publication/states-education-productivity-growth-foundations.
[41] Chuck Marr et al., “EITC and Child Tax Credit Promote Work, Reduce Poverty, and Support Children’s Development, Research Finds,” Center on Budget and Policy Priorities, updated October 1, 2015, https://www.cbpp.org/research/federal-tax/eitc-and-child-tax-credit-promote-work-reduce-poverty-and-support-childrens?fa=view&id=3793.
[42] Elizabeth McNichol, “It’s Time for States to Invest in Infrastructure,” Center on Budget and Policy Priorities, August 10, 2017, https://www.cbpp.org/research/state-budget-and-tax/its-time-for-states-to-invest-in-infrastructure.
[43] “Closing the digital and economic divides in rural America,” Brookings Institution, https://www.brookings.edu/longform/closing-the-digital-and-economic-divides-in-rural-america/.
[44] Endeavor Insight, “What Do the Best Entrepreneurs Want In a City? Lessons from the Founders of America’s Fastest Growing Companies,” February 2014, http://www.ilga.gov/house/committees/98Documents/RevenueAndFinance/SupplementalData/What%20Do%20the%20Best%20Entrepreneurs%20Want%20in%20a%20City_%20-%20FINAL.pdf.
[45] As one review of factors contributing to local economic growth observed: “With human capital becoming an increasingly strong determinant of economic competitiveness, those areas that have or are better able to attract a more highly educated and trained labor force may have a competitive advantage for economic activities requiring more highly skilled labor. Amenities and quality of life are important because there is increasing evidence that highly educated people who are residentially mobile and have a variety of job options favor areas with a high quality of life.” Hal Woman et al., “Economic Competitiveness and the Determinants of Sub-National Area Economic Growth,” report for the Office of Revenue Analysis, District of Columbia Office of the Chief Financial Officer, September 30, 2008.
[46] Amazon HQ2 request for proposals, 2017, https://images-na.ssl-images-amazon.com/images/G/01/Anything/test/images/usa/RFP_3._V516043504_.pdf.
[47] Michael Mitchell and Michael Leachman, “Changing Priorities: State Criminal Justice Reforms and Investments in Education,” Center on Budget and Policy Priorities, October 28, 2014, https://www.cbpp.org/research/changing-priorities-state-criminal-justice-reforms-and-investments-in-education.
[48] Michael Leachman et al., “Advancing Racial Equity With State Tax Policy,” Center on Budget and Policy Priorities, November 15, 2018, https://www.cbpp.org/research/state-budget-and-tax/advancing-racial-equity-with-state-tax-policy.
[49] “Race, Wealth and Taxes: How the Tax Cuts and Jobs Act Supercharges the Racial Wealth Divide,” Institute on Taxation and Economic Policy and Prosperity Now, October 11, 2018, https://itep.org/race-wealth-and-taxes-how-the-tax-cuts-and-jobs-act-supercharges-the-racial-wealth-divide/.
[50] Institute on Taxation and Economic Policy, “Who Pays?” 6th edition, October 2018, https://itep.org/whopays/.
[51] Ibid.
[52] Institute on Taxation and Economic Policy and Prosperity Now, October 2018.
[53] Of special note, the wealthiest 10 percent of white households own 65 percent of the nation’s wealth, whereas the remaining 90 percent of white families own just 22 percent. Leachman et al.
[54] Michael Leachman, “Minnesota’s Tax Plan a Recipe for Future Growth,” Center on Budget and Policy Priorities, May 21, 2013, https://www.cbpp.org/blog/minnesotas-tax-plan-a-recipe-for-future-growth.
[55] Leachman and Mazerov.
More from the Authors