States routinely put at risk some of the country’s highest priorities ― educating children, maintaining a healthy and trained work force, and caring for the elderly, for example ― by failing to employ proven budget methods that would help them plan farther into the future.
improvements to state budget processes would make more information available to policymakers and the public. A few improvements to state budget processes would make considerably more information available to policymakers and the public for budget debates. This would increase states’ ability to plan for the future, boosting the chances they will have the resources to invest in schools and other building blocks of strong economic growth and widespread prosperity. Better planning also can reduce uncertainty about future funding levels and tax rates, improving a state’s business climate.
Improved procedures can help states plan more effectively in these main areas:
-
Getting a stronger grasp of likely revenues:
- Projecting how much revenue the state can expect to collect beyond the next couple of years enables policymakers to anticipate and respond to predictable changes in revenue. Otherwise, policymakers are left blind to predictable declines (or increases) in state revenue and vulnerable to tax-cut proposals that impose large revenue losses several years in the future. Only 11 states forecast revenue at least four years into the future.
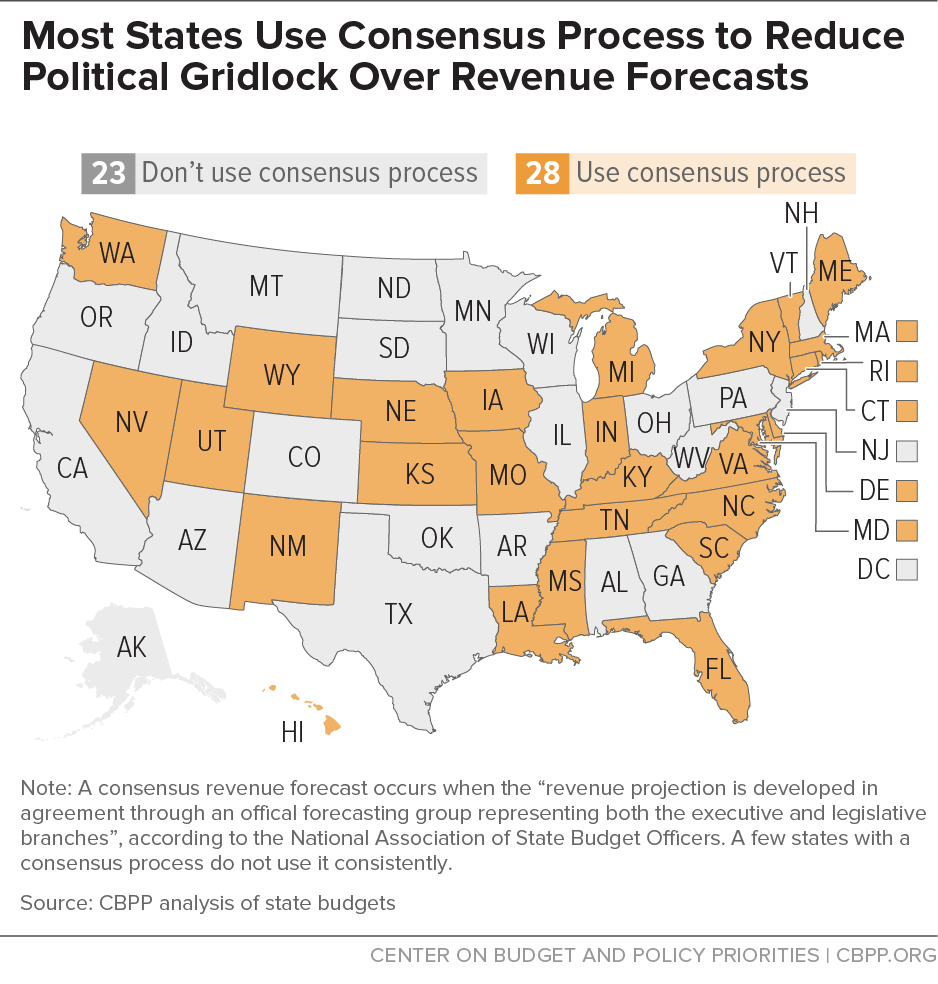
- A revenue estimate produced by the governor and legislature in partnership — rather than competing revenue estimates — reduces the likelihood of a political fight over the correct revenue number that can derail a more productive policy debate. Only about half (28) of the states use a consensus revenue estimating process.
-
Getting a stronger grasp of real costs: Knowing the cost of maintaining the current level of services beyond a single year gives policymakers a heads up when major cost increases are coming before it’s too late to avoid a fiscal emergency. This information (called a current services budget) also shows if states are in danger of chronically taking in less revenue than needed to meet obligations (called a structural deficit). Only five states and the District of Columbia regularly prepare current services budgets extending beyond one budget year.
-
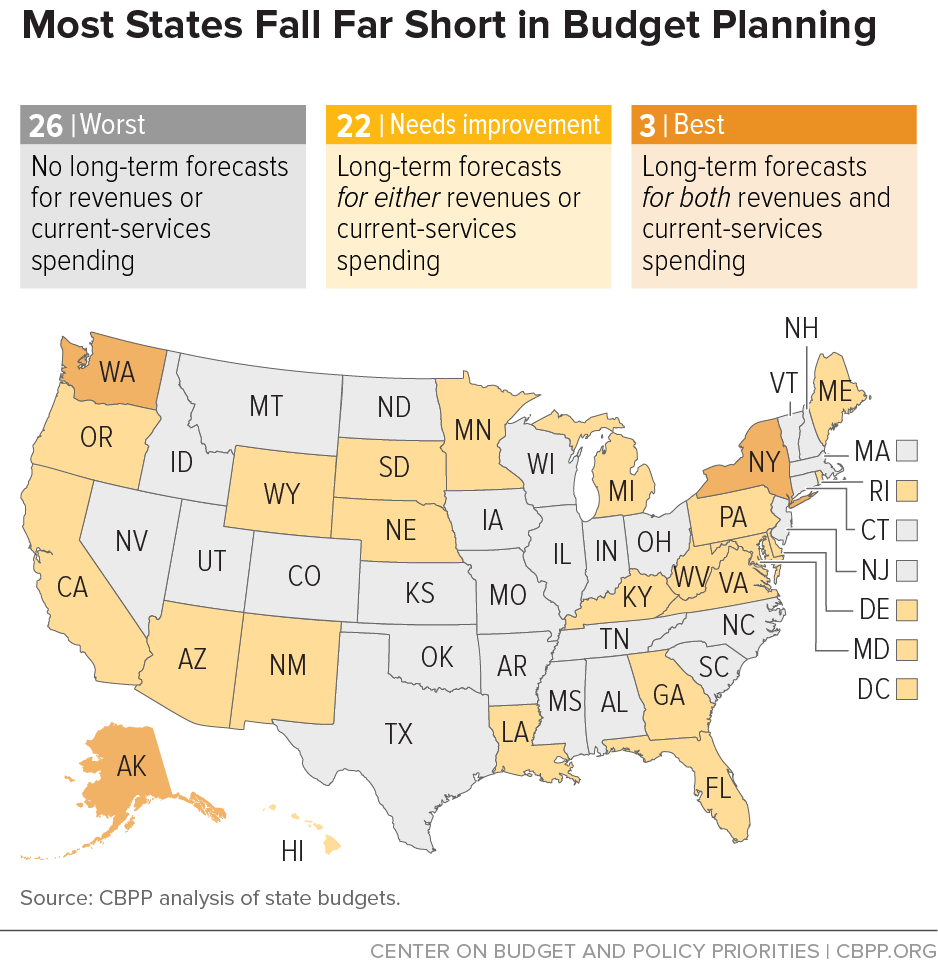
Putting it all together: Any of the above practices would by itself help a state. Even more effective is putting them together and preparing high-quality, multi-year revenue forecasts and multi-year expenditure forecasts on a current-services basis. This gives the best possible information to set up productive debate on potential policies. Three states — Alaska, New York, and Washington — use both multi-year revenue and multi-year current services budget forecasting, at least for broad categories of spending and revenues. Several other states employ some of the best practices in these areas. With modest improvements, they could join the three leading states as models for the rest of the country. (See Figure 1. Also see Table 1 and the interactive map at the end of this report.)
Of course, improving the information available to legislators and the public does not guarantee better policy outcomes. States may still make poor budgeting decisions even when they have information to help them make better choices. But without the information states need to plan, they are blind to the impact of many of their budgeting decisions, making poor choices more likely and putting their futures at risk.
Part I: Improving Revenue Forecasts by Using a Longer Horizon and Reaching Consensus
The first step toward good budget planning is a reliable, widely accepted forecast of the revenues a state expects to receive in the future.
A reliable revenue forecast puts appropriate constraints on the budget process.[1] It tells policymakers what level of programs and services is affordable under current circumstances. If the forecast falls short, policymakers will know they have to decide whether to raise revenues, cut spending, or some combination of the two. Conversely, if the forecast exceeds program needs, policymakers will know that they can choose among options such as strengthening “rainy day” reserves, making new investments, or cutting taxes.[2]
To provide the maximum benefit, a revenue forecast should cover not just the current fiscal year or biennium but at least five future years. Policymakers and the public need to see how this year’s actions would affect future revenues. They need to be able to answer such questions as:
-
If the state cuts taxes permanently this year or enacts a phased-in tax cut that grows gradually in cost, will revenues be sufficient to cover program costs in three to five years?
-
If the state starts a new initiative this year or expands an existing one, will revenues be sufficient to pay for it in future years?
-
If there is a revenue shortfall this budget year, is it temporary — that is, are revenues expected to be sufficient a few years down the road — or is it a structural problem that will persist?
The answers to these questions will have a large impact on the appropriate policy choices.
Basics of Forecasting
State revenue forecasting methods vary in detail but generally follow a basic pattern. Since the vast majority of a state’s revenues are sensitive to the level and types of economic activity, the state begins by making assumptions about changes in gross domestic product, employment, personal income, prices of goods and services, and similar economic data. These assumptions, which underpin the revenue forecast, may be derived from national sources, local economists, forecasting firms, or a combination of these sources. The state then uses the assumptions to project revenues, based on each revenue source’s past performance or past relationship to the economy.[3]
This process generally takes place before the budget cycle begins, so the governor has a forecast to use in finalizing the executive budget and the legislature has it before its deliberation begins. The forecast may be updated during the budget process.
Best Practices for Revenue Forecasting
To make the revenue forecast as understandable and useful as possible to policymakers and the public, states should:
- use a consensus process to forecast revenues;
- provide a clear, transparent statement of assumptions and methodologies;
- base revenue forecasts on current law and distinguish current law from new proposals;
- regularly update the forecast during the budget process; and
- prepare multi-year forecasts.
Consensus Process for Credible and Trusted Forecast
In the best case, all parties to the budget process — the executive and legislative branches, advocates, and the interested public — would view the revenue forecast as credible. This would help ensure that the budget debate focuses on policy choices rather than partisan squabbling over the funding available. One way to accomplish that is through a strong consensus forecasting procedure.
Today, 28 states use a “consensus process” for forecasting revenue, meaning the legislative and executive branches come up with an agreed-upon, official projection of how much revenue will be available.[4] (See Figure 2.) In the other 22 states and the District of Columbia, either the governor and legislature produce competing forecasts — which can be a recipe for gridlock and political infighting — or one branch is left out of the official process. The lack of an inclusive, consensus forecasting method reduces the forecast’s value in setting the parameters of the budget process and encourages some policymakers to ignore it.
After an extensive study of methods of projecting revenues, Indiana University professors John Mikesell and Justin Ross concluded that a joint process results in reliable and trusted revenue predictions that provide the foundation for fiscal discipline and the adoption of a budget that can be adhered to relatively easily in normal times. A consensus-type process creates a sense of ownership and acceptance among competing participants in the budget process. They may struggle to come together without that sense of ownership, Mikesell and other researchers say, which then could prompt them to ignore the revenue estimate as a constraint on spending.[5]
A consensus process can avoid situations in which a state adopts a budget that exceeds the resources the state can reasonably expect to collect or policymakers deliberately underestimate revenues in order to force service cuts.
New Jersey’s recent budget troubles demonstrate the pitfalls of separate revenue estimates. The state’s executive and legislative fiscal offices each prepare revenue estimates. In most years they are similar, but in 2012 and 2013 the governor’s forecasts were significantly higher than the legislature’s. Since in New Jersey the governor has sole authority to determine the official revenue estimate, the budgets for those years were based on the higher numbers. Many saw this as a political decision that allowed the governor to fund his priorities while rejecting tax increases that lawmakers argued were needed to balance the budget. Ultimately, revenues failed to meet the governor’s forecast, and he closed the gaps with one-time measures that led to large budget shortfalls in later years, such as transferring money from special revenue funds and postponing payments to the public employee pension fund.
Transparent Assumptions and Methodologies
In most states, the executive budget details at least some of the economic assumptions that underpin its revenue forecast. But a few states, including Alabama and Tennessee, lack such an explanation, and in others, such as Arizona, the explanation is general rather than specific.
Also, states rarely are transparent with respect to how they incorporate those economic assumptions into their revenue forecast. While this issue might primarily interest a specialized audience, such transparency could bolster the forecast’s credibility with the policymakers and other influential people who review the assumptions. Trust in the forecast brings fiscal discipline.
Distinguishing Baseline Revenue from Revenue under Proposals
In many states the governor’s budget office prepares the revenue forecast as part of the governor’s budget proposal. In such cases, it is important to distinguish clearly between the revenues forecast under current law and those forecast under the governor’s proposals. This should be done in the main portion of the budget, not buried in more detailed parts of the document, to avoid confusion and to make transparent the budgetary impact of the governor’s proposals. For example, the Ohio executive budget for fiscal years 2016 and 2017 clearly distinguishes the base revenue forecast from the impact of the governor’s proposed changes in tax policy and in the allocation of certain tax revenues.[6]
Regular Updates
Revenue forecasts generally are prepared in the fall or early winter preceding a fiscal year or biennium so they are available to start the budget process. But the economic and other circumstances on which forecasts are based often change. That makes it important to update a forecast, ideally before the budget is finalized and perhaps also during the ensuing budget year. Twenty-eight states and the District of Columbia regularly revisit initial revenue estimates during the year, although the timing varies. By contrast, a few states are required to prepare forecasts only once every two years, before the start of a biennium.
Multi-Year Forecasts
Another important feature of a revenue forecast is the number of years it covers. Policymakers can cause a great deal of harm by enacting policy changes whose full fiscal impact occurs “outside the budget window” — that is, beyond the period that revenue forecasts cover.
Consider a state in which the revenue forecast covers only the budget year and the governor’s budget proposes to cut the top personal income tax rate or corporate income tax rate gradually each year for the next five years. Such proposals are common, yet lawmakers cannot make an informed, responsible decision on them without knowing the impact while the proposal phases in, as well as when it is fully in effect. Even if the governor’s office provides an estimate of the cost over the entire five years,[7] the lack of a five-year base revenue forecast for context would make it impossible to evaluate the full implications of the cut. Nor could policymakers understand the proposal’s impact on future spending — specifically, the spending cuts it might require by reducing revenues. (See box on Missouri tax cut.)
Similarly, suppose forecasted revenues in the budget year under discussion are insufficient to cover expected spending. A proposal is made to permanently raise the sales tax rate to close the current-year gap. Will the increased revenue from the sales tax increase be the right amount, too much, or too little to maintain budget balance under current policies in three or five years? Without a five-year base revenue forecast, it is impossible to tell.
The lack of full fiscal information typically leads to competing claims about the affordability of proposed tax cuts or the advisability of tax increases. The issue can become a political tug-of-war, conducted in the absence of credible, impartial information.
Of course, a state could always enact tax changes with “triggers” based on specific criteria, such as economic conditions. There are two types: triggers that allow enacted tax changes to take effect only if certain conditions are met, and triggers that stop a phasing-in tax change if certain conditions (such as a measure of economic growth) are not met. Sometimes triggers are the only way out of a political impasse over the advisability of a change. But triggers introduce uncertainty into a state’s tax policy, something businesses routinely say is problematic. And triggers enacted along with a revenue change may not appropriately fit future circumstances.
For example, Oklahoma in 2014 enacted an income tax cut that would go into effect in 2016 if the state tax commission’s estimate of 2016 revenue exceeded its February 2013 estimate of 2014 revenue. The trigger compared two estimates, not actual revenue, and it said nothing about whether the state can afford the tax cut.[8] As it happens, the tax cut is triggering on at a time when weak oil prices are depressing state revenue. High-quality revenue forecasting could have helped policymakers make a less costly choice.
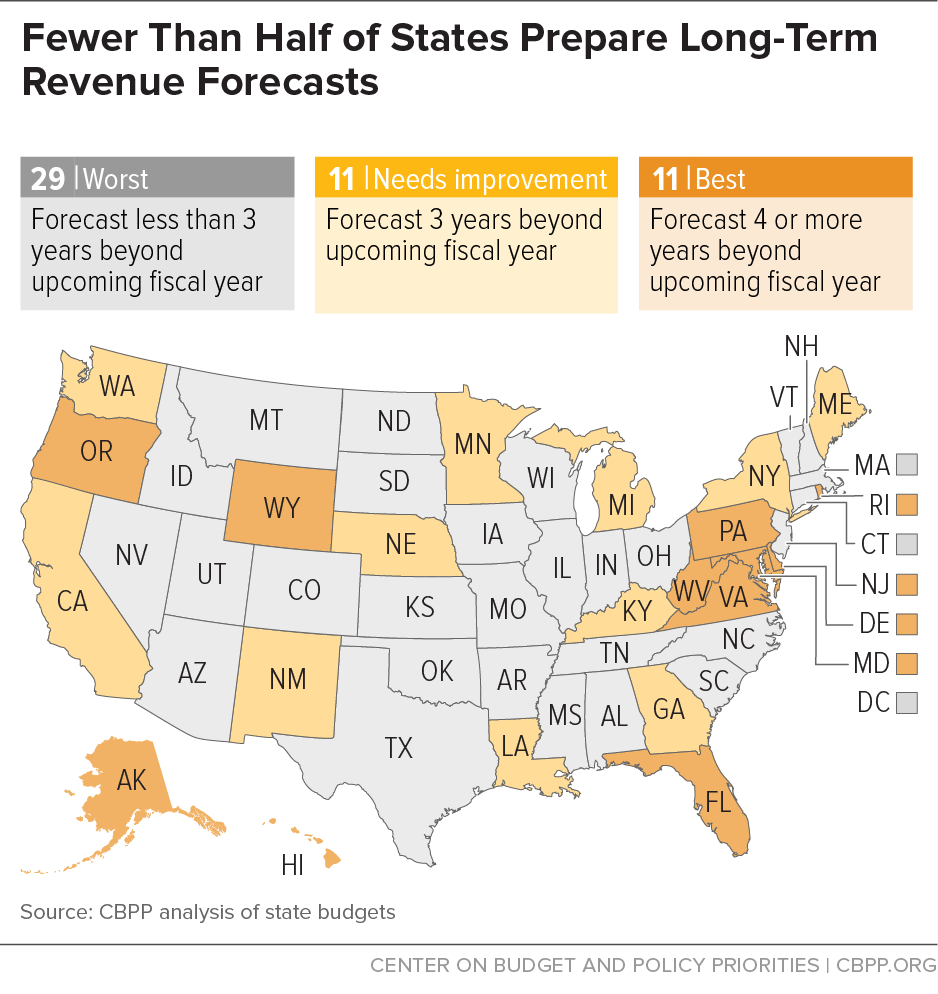
Only 11 states routinely prepare revenue forecasts for five years ahead — that is, at least four years beyond the upcoming fiscal year. Another 11 states prepare revenue forecasts for three years beyond the upcoming fiscal year.[9] (See Figure 3 for a map of these states, and Figure 4 for a long-term forecast included in Pennsylvania’s executive budget.)
Policymakers or technical staff in budget offices or legislative fiscal analysis offices are sometimes reluctant to provide longer-term projections. They may argue that even short-term estimates often prove inaccurate and that foreseeing economic conditions five years out is even harder. To some extent, forecast error does increase farther out in time. For example, recent research found that accuracy worsens by well over a percentage point in the forecast for the second year of a biennium. Research also shows that forecasting errors are greatest when the economy is entering or leaving recessions.[10] Indeed, much revenue forecasting error stems from economic forecasting error, particularly the inability to forecast turns in the business cycle. The start of the Great Recession caused very large errors in state economic and revenue forecasts, for example.
Generally speaking, however, forecasting error is not that great. For example, the Congressional Budget Office (CBO) looked at its errors in five-year economic forecasts since the early 1980s and found that forecast values deviated from actual outcomes by 1.2 percentage points per year for real output growth and by 0.6 percentage points per year for inflation in the consumer price index.[11] In fact, the five-year forecasts were more accurate than the two-year forecasts, which CBO explains by noting that the five-year forecasts are affected less by relatively brief shifts in the economy. Thus, a five-year forecast will not necessarily be significantly off target. And it is worth knowing what revenues will likely be under normal economic conditions in five years, even if conditions turn out differently.
As noted, 22 states make these longer-term projections. This fact suggests that these states find the projections useful despite the modest potential for forecast error, and that other states would not find it an insurmountable task to adopt the practice.
Missouri Example Highlights Perils of Inadequate Information
In May 2014, Missouri enacted a tax cut that phases in over five years, beginning in tax year 2017. The legislation lowers income tax rates, increases the personal exemption for low-income taxpayers, and establishes an income tax deduction of up to 25 percent for business income. The tax cuts can phase in in any year in which the revenue collected in the previous fiscal year was at least $150 million more than the highest amount collected in any of the three years before that. According to the official fiscal note, the changes will reduce revenue by $620 million in 2022, when they were expected to be fully phased in.*
While the fiscal note was available before enactment, policymakers and the public considering the legislation did not have critical information against which to compare this revenue loss or to judge the potential impact of the trigger. There was no baseline for revenues or current services spending that covered the period in which the tax cut would phase in. Missouri prepares a consensus revenue forecast, but it provides information only for the current year and the upcoming (budget) fiscal year. Similarly, the governor’s budget provides spending information only for the previous, current, and upcoming fiscal year. So when the tax cut was enacted, the most forward-looking revenue and spending estimates were for fiscal year 2015 — and therefore useless for evaluating a tax cut that would not even begin taking effect until tax year 2017.
It is worth noting that the $150 million revenue growth needed to trigger the phase-in is just 1.7 percent of forecasted fiscal year 2015 revenue. That is highly unlikely to be sufficient to maintain current services. The fiscal note assumed inflation alone would be 2.3 percent per year during the phase-in period.
After the legislation’s enactment, the independent Missouri Budget Project prepared longer-term revenue and current services estimates. These showed that by 2023, available revenues following full implementation of the tax cuts would fall $1.95 billion short of the amount necessary to fund current services expenditures (the same services provided in fiscal year 2014 plus funding needed under the state’s K-12 school funding formula).** Eliminating that gap would require a spending cut of more than 16 percent below a current services level.
It is always difficult to think about what any situation will be eight years from now. But, as the Missouri example shows, acting without fully understanding the longer-term implications can have a huge cost.
*Beginning in 2015 in Missouri, all fiscal notes prepared for measures that phase in over multiple years will include the cost of the first three years of implementation as well as the cost of the first full year after the measure is fully implemented.
** Tom Kruckemeyer and Amy Blouin, Tax Cuts Fling Missouri Toward Massive Budget Cliff, November 12, 2014, http://www.mobudget.org/wp-content/uploads/2014/11/Off-a-cliff-November-2014.pdf. The report also points out that fiscal year 2014 expenditures were still well below pre-recession levels.
Moreover, as discussed below, even a longer-term forecast that proves too high or too low provides important information for the policy process. For example, consider a five-year phase-in of a tax cut that appeared affordable under the revenue forecasts at the time. If a budget gap emerges in the fourth year, policymakers and the public could easily understand whether this occurred because revenue fell short of the forecast or because spending exceeded expectations, and then consider an appropriate remedy.
Part II: Preparing Multi-Year Forecasts of the Cost of Existing Programs and Services
As with revenues, it is important to forecast spending beyond the current budget or biennium. New spending initiatives, like new tax cuts, might cost much more after three or four years than in the first year.
For example, the Children’s Health Insurance Program phased in over a number of years, covering children at progressively higher income levels (relative to the poverty line) and higher ages. A new property tax rebate may have relatively low participation at first but grow substantially as it becomes better known and more eligible people take advantage of it.
Nineteen states and the District of Columbia project spending beyond the upcoming budget year.[12] But only five states and D.C. do so in a way that presents the cost of continuing current policies in future years and then distinguishes that cost from proposed policy changes. This more useful method is called a baseline or current services basis. (See Figure 5.) Projections that embed proposed policy changes or omit inevitable cost drivers such as inflation are far less useful.
Current Services/Baseline Budgeting
The expenditure side of the budget is more difficult to understand than the revenue side. This is because the purpose of a state budget is to provide programs and services, and the best measure of whether the budget has remained constant in meeting priorities from year to year is not the number of dollars spent but rather the impact on programs and services of changes in the dollars spent.
State budgets differ in many ways from household budgets. For example, states have a much more diverse income stream, including taxes, fees, and federal grants; they don’t ever “die” or go out of business; and they borrow for many more purposes than households. But it sometimes is easier to think in personal terms. Imagine someone — let’s call him Joe — considering buying a home. He anticipates receiving the same “service,” that is, the shelter and enjoyment of his home, each year for the foreseeable future. But he knows that inflation and other factors probably will increase the costs of enjoying his home in future years, so he has to make sure he will be able to afford that home year after year. He calculates an inflation factor for home insurance, utilities, home repairs, appliances and equipment, and so forth. If he plans to obtain a variable-rate mortgage, he makes assumptions about interest rates in future years. And he might consider whether any local rules suggest that his property taxes will likely change. Having done all that, Joe compares the outcome of his calculations to his expected future income and decides whether this is the home for him.
Current services or baseline budgeting does something similar for the entire state budget. A current services baseline projects what the state would have to spend on a given program — such as health care for poor children, property tax reductions for senior citizens, or economic development assistance to businesses — in order to maintain the program in its current form.[13] It takes into account factors such as:
- Inflation and other changes in the per-person cost of providing the programs and services. General inflation is not always the appropriate measure of these cost changes. In health programs, for example, medical cost growth would be more appropriate.
- Any expected changes in the number of people using those services and benefits due to population growth or other factors.
- Any previously enacted rule changes that have not yet phased in, ongoing formula-based adjustments (such as a school funding formula based in part on population growth), and other factors that would require statutory changes to undo.
While the revenue forecast is a constraint on the budget — because the state cannot (in most cases) plan to spend more money than it expects to collect in revenue — a current services budget does not act as a constraint. It does, however, provide important information and make a state’s budget more transparent to policymakers and the public.
A current services budget allows policymakers and the public to readily understand whether a program or service is being increased or decreased. For example, if the program expands and contracts as the number of eligible people (such as schoolchildren or Medicaid recipients) goes up or down, what will it cost to meet the expected need? If the program serves a fixed population, such as recipients of a limited number of economic development grants, what will it cost for the grants to cover the same types of activities as they did the year before? And, if the program requires the heavy use of vehicles (such as highway patrol), what will it cost to continue operating at current levels while accommodating an anticipated increase in fuel costs?
A current services baseline excludes the impact of proposed policy changes, such as changes in school funding formulas or Medicaid eligibility. This approach allows policymakers and the public to compare the baseline to a proposed or enacted budget allotment to see whether the budget reflects a spending cut or increase.
Preparing a current services budget does not obligate policymakers to fund the programs and services at the levels indicated. It simply allows them to understand the impact of the funding decisions they will make as part of the political process.
States should not be deterred from publishing current services estimates — especially for initial efforts — if they lack the resources to calculate all of the potential variables. Some information is better than none.
Figure 6, from Washington state’s 2015-17 budget, illustrates the information that a current services (here called a “maintenance level”) budget can provide. The maintenance level is $3.318 million, or 2.6 percent, below spending in the current biennium, apparently because the state decided that fewer staff members could provide the same services. To this maintenance level, the state adds costs expected in the upcoming biennium, including changes in rent and compensation and some one-time costs.[14] With all of this information as it is laid out, it is possible to judge the total proposed budget. In this case, a 0.8 percent funding cut from the current biennium does not represent a reduction in services; it fully funds the maintenance level and additional expected costs.
Washington state provides this level of detail only for the upcoming biennium, however. It provides a more summary maintenance level presentation for the biennium after that.
California, which refers to its current services analysis as a “workload budget,” clearly distinguishes between the amounts required to maintain current services and to implement proposed policy changes. Figure 7, from the state’s budget for the California Science Center, includes increased public safety staffing at a campus of museums and other attractions called Exposition Park. The proposed staffing increase is considered a “policy adjustment,” presumably because it will enhance services rather than maintain them.
Best Practices for Current Services Budgeting
To make the spending side of the budget as understandable and useful as possible to policymakers and the public, states should:
- include a clear, transparent description of how they derived the current services estimates;
- prepare current services estimates at both the broad summary and detailed program levels;
- provide multi-year current services projections; and
- include current services estimates in the regular budget document to compare with the governor’s proposed spending.
Clear Methodology and Transparent Assumptions
A current services budget should include a clear and complete description of the assumptions used to estimate the current services baseline. This allows analysts and others to decide if the state-defined baseline would be sufficient to maintain programs at current levels.
In Connecticut, for example, the legislature’s Office of Fiscal Analysis publishes current services estimates for the upcoming biennium and one additional year and provides detailed information on how those estimates are derived.[15] (See Figure 8.) It publishes the various inflation factors it uses for different types of spending, as well as its assumptions regarding salary increases for public employees and the factors it uses for other types of adjustments.
Arizona provides another example. Its executive budget calculates “standard adjustments” (changes to fundamental operating costs, such as rent or insurance premiums) and “baseline adjustments” (caseload changes, court mandates, and other necessary funding changes) and specifies the assumptions for each. Together, these two adjustments are equivalent to a current services presentation. It also distinguishes these adjustments from “governor’s initiatives,” or proposed policy changes.[16]
This type of transparency allows analysts and others to decide if a strictly defined baseline is appropriate for current circumstances. For example, baseline spending might be atypically low because of spending cuts due to a recession or atypically high because of responses to a natural disaster. In addition, statutory provisions (such as New York’s cap on school spending growth) may restrict spending below the amount needed to maintain current services. Detailed information on the assumptions used can facilitate decision-making about whether circumstances require additional adjustments.[17]
It should be noted, however, that even less comprehensive methodologies than Connecticut or Arizona employ for calculating current services can provide useful information to policymakers and the interested public.
Both Summary and Detailed Current Services Estimates
Budget-wide (or fund-wide) current services estimates are needed for comparisons with a budget’s overall revenue levels. But detailed current services estimates, provided down to the level of individual programs or line items, are also important. It does not help policymakers or the public very much to know only that proposed funding for a division or department as a whole is above or below the current services level. A major purpose of a current services budget is to reveal the real-world impact of proposed funding changes — impacts on specific programs and specific categories of residents. The more detailed the presentation, the more useful it can be.
Multi-Year Projections
Few states that prepare current services estimates do so for years beyond the upcoming fiscal year or biennium. They are Alaska (which shows nine years beyond the upcoming fiscal year), the District of Columbia and New York (three years),[18]Arizona and South Dakota (two years), and Washington state (an additional biennium).
Some states that provide current services projections for the upcoming fiscal year or biennium switch to a different basis when doing multi-year projections. For example, Connecticut’s executive budget publishes detailed current services analyses by agency for the biennium. However, an additional presentation elsewhere in the budget assumes the governor’s policy recommendations for the biennium and then shows what it calls “current services” by agency for the subsequent three years. Thus, the “current services” analysis for those three years assumes that the governor’s recommendations for the biennium are fully adopted, and so are not true current services projections.[19] Because these types of distinctions may not be immediately obvious to the interested public and policymakers, any state that adopts this approach should clearly explain it.
Published as Part of the Regular Budget Document
Whether a program’s proposed funding level represents a cut or expansion in the program or its level of services should be apparent to anyone reading a state budget document. That is only possible if the detailed current services estimates are published alongside the detailed proposals in the executive budget.
Part III: Putting It All Together: High-Quality, Multi-Year Forecasts of Both Revenues and Spending Provide the Best Information for Planning
By preparing high-quality, multi-year revenue forecasts and multi-year expenditure forecasts on a current services basis, a state can give policymakers and residents the best possible information to debate potential policies.
Since states must balance their budgets, a revenue forecast for the coming year or biennium constrains policy choices in the sense that budgeted spending should not exceed predicted revenues (except when the state uses funds from a reserve account or carryover funds from a prior year). But the forecast does not remove any policy options. Policymakers can choose from a variety of ways to bring the budget into balance, including raising revenues and cutting spending. Similarly, out-year revenue forecasts can identify potential problems from current policy paths, but policymakers always have options to forestall those problems.
Current services budgets do not constrain policy choices on funding levels, either. Policymakers may choose to fund at less than or more than the current services level. But current services budgets allow far better understanding of the consequences of those choices on programs, services, and residents. And, like multi-year revenue forecasts, multi-year current services estimates can avert fiscal crises that result from failure to understand the full impact of policy changes.
High-quality, multi-year forecasting also makes it clear whether budget gaps or related problems stem from the revenue or spending side of the budget — a question that can provoke considerable controversy.
The majority of states have structural deficits, considerable research shows.[20] But most states have not addressed this problem because the short-term revenue and spending forecasts that most of them use cannot identify structural deficits. While states are highly attuned to cyclical deficits caused by recessions, many states do not recognize when their budget gaps are structural in nature. Instead, they plug their structural deficits with revenue increases, spending cuts, or gimmicks such as postponing spending or accelerating revenues. These gimmicks often make future budgets even harder to balance, and they certainly do not fix the underlying structural imbalance between revenues and spending.
By highlighting structural deficits, high-quality, long-term revenue and expenditure forecasting would give policymakers time to forestall deficits. This would allow states to maintain needed investments in human and physical capital that contribute to economic growth without the abrupt funding cuts that often occur when unforeseen deficits appear.
Only Alaska, New York, and Washington state come close to this standard of multi-year revenue forecasting along with multi-year current services projections. But a significant number of states do part of the job well. With modest improvements, they could make this a less exclusive club — and, in the process, improve their ability to invest in economic growth and a better quality of life.
| TABLE 1 | |||
|---|---|---|---|
| State Practices on Revenue and Spending Forecasts | |||
| Forecasts Revenues for 3 or More Years Beyond Upcoming Fiscal Year |
Uses Consensus Revenue Forecasting | Includes Current Services Presentations in Budgets | |
| Alabama | |||
| Alaska | 4 or more | beyond upcoming year/biennium | |
| Arizona | beyond upcoming year/biennium | ||
| Arkansas | |||
| California | 3 | upcoming year/biennium only | |
| Colorado | |||
| Connecticut | X | upcoming year/biennium only | |
| Delaware | 4 or more | X | upcoming year/biennium only |
| District of Columbia | beyond upcoming year/biennium | ||
| Florida | 4 or more | X | |
| Georgia | 3 | ||
| Hawaii | 4 or more | X | |
| Idaho | upcoming year/biennium only | ||
| Illinois | |||
| Indiana | X | ||
| Iowa | X | upcoming year/biennium only | |
| Kansas | X | upcoming year/biennium only | |
| Kentucky | 3 | X | |
| Louisiana | 3 | X | upcoming year/biennium only |
| Maine | 3 | X | |
| Maryland | 4 or more | X | |
| Massachusetts | X | ||
| Michigan | 3 | X | |
| Minnesota | 3 | ||
| Mississippi | X | ||
| Missouri | X | ||
| Montana | upcoming year/biennium only | ||
| Nebraska | 3 | X | |
| Nevada | X | upcoming year/biennium only | |
| New Hampshire | upcoming year/biennium only | ||
| New Jersey | |||
| New Mexico | 3 | X | |
| New York | 3 | X | beyond upcoming year/biennium |
| North Carolina | X | ||
| North Dakota | |||
| Ohio | |||
| Oklahoma | |||
| Oregon | 4 or more | upcoming year/biennium only | |
| Pennsylvania | 4 or more | ||
| Rhode Island | 4 or more | X | |
| South Carolina | X | ||
| South Dakota | beyond upcoming year/biennium | ||
| Tennessee | X | ||
| Texas | |||
| Utah | X | ||
| Vermont | X | upcoming year/biennium only | |
| Virginia | 4 or more | X | |
| Washington | 3 | X | beyond upcoming year/biennium |
| West Virginia | 4 or more | ||
| Wisconsin | |||
| Wyoming | 4 or more | X | upcoming year/biennium only |
End Notes
[1] John L. Mikesell and Justin M. Ross, “State Revenue Forecasts and Political Acceptance: The Value of Consensus Forecasting in the Budget Process,” Public Administration Review, 2014.
[2] According to the National Conference of State Legislatures, the forecast “binds” the budget in 26 states. Arturo Perez, Presentation to the NCSL Fiscal Leaders Seminar, undated. Arguably, however, it acts as a constraint in every state that has to enact a balanced budget.
[3] States use various forecasting techniques, ranging from simple projections to econometric (regression) analysis to microsimulation models. A variety of research has tried to determine whether one method is superior to others but has largely concluded that this is impossible to say definitively. See, for example, Donald J. Boyd, Lucy Dadayan, and Robert B. Ward, States’ Revenue Estimating: Cracks in the Crystal Ball, Pew Center on the States and The Nelson A. Rockefeller Institute of Government, March 2011, pp. 17-19, http://www.rockinst.org/pdf/government_finance/2011-03-01-States_Revenue_Estimating_Report.pdf.
[4] Based on CBPP analysis of state practices. For more information please see Elizabeth C. McNichol, Improving State Revenue Forecasting: Best Practices for a More Trusted and Reliable Revenue Estimate, Center on Budget and Policy Priorities, updated September 4, 2014, https://www.cbpp.org/research/state-budget-and-tax/improving-state-revenue-forecasting-best-practices-for-a-more-trusted. A few of the states with a consensus process do not use it consistently. This report uses the National Association of State Budget Officers definition of a consensus revenue forecast: “revenue projection developed in agreement through an official forecasting group representing both the executive and legislative branches.” National Association of State Budget Officers, “Budget Process in the States,” Summer 2008.
[5] See John L. Mikesell and Justin M. Ross, “State Revenue Forecasts and Political Acceptance: The Value of Consensus Forecasting in the Budget Process,” Public Administration Review, 2014; and William Earl Klay and Joseph A. Vonasek, “Consensus Forecasting for Budgeting in Theory and Practice,” Chapter 16 in Government Budget Forecasting: Theory and Practice, CRC Press, 2008.
[6] See http://blueprint.ohio.gov/doc/budget/State_of_Ohio_Budget_Recommendations_FY-16-17.pdf, pp. B-5 – B-7.
[7] A “fiscal note” is an official state estimate of the savings or costs from proposed legislation. Only ten states regularly produce fiscal notes that project costs and revenues for at least five years. CBPP recommends that fiscal notes also cover at least five years.
[8] Norton Francis, “Oklahoma Pulls the Trigger on an Unaffordable Tax Cut,” TaxVox, Urban-Brookings Tax Policy Center, January 5, 2015.
[9] Based on CBPP analysis of state practices. States with biennial budgets that forecast two biennia ahead are counted as forecasting three years beyond the upcoming fiscal year.
[10] Donald J. Boyd and Lucy Dadayan, State Tax Revenue Forecasting Accuracy: Technical Report, Nelson A. Rockefeller Institute of Government, September 2014.
[11] Congressional Budget Office, CBO’s Economic Forecasting Record: 2013 Update, January 17, 2013.
[12] McNichol, Improving State Revenue Forecasting. The states that prepare multi-year projections (but not necessarily current services projections) are Alaska, Arizona, Colorado, Connecticut, Georgia, Hawaii, Kansas, Maryland, Minnesota, Nebraska, New York, Oregon, Pennsylvania, Rhode Island, South Dakota, Tennessee, Virginia, Washington, and West Virginia. (South Dakota began this practice after Improving State Revenue Forecasting was published.)
[13] The specific name of current services-type analyses can differ by state. These analyses are also called continuation budgets or maintenance budgets, among other things.
[14] As described by the state: “Each agency step table displays a summary line representing the cost of Maintenance Level (i.e., the dollars necessary to carry on the same activities next biennium, as adjusted for rate changes and mandatory caseload or enrollment changes). Proposed changes to this base level of funding are itemized as ‘Performance Changes’ and briefly described.” Note that some states would include wage and benefit increases and previously agreed-upon lease cost increases in their concept of the maintenance level. The most important thing is that the methodology should be clear.
[15] Connecticut Office of Fiscal Analysis, Fiscal Accountability Report to the Appropriations and Finance Committees as required by CGS Sec. 2-36b, November 14, 2014.
[16] http://www.ospb.state.az.us/documents/2015/State%20Agency%20Budgets,%20FINAL,%20Online%20Version,%20With%20Links%201-14-15%204pm.pdf, pp. 3-4.
[17] States can also address this issue by preparing alternative baselines. For example, it could be problematic to establish a current services baseline right after a recession, when spending is well below the level required to adequately serve residents. As an alternative, a state could compare current spending levels with the cost of providing a pre-recession level of services and then provide this “pre-recession services baseline” alongside its current services baseline to further inform decision-making about how best to manage its economic recovery.
[18] New York’s fiscal year 2016 executive budget shows summary current services estimates for the general fund and for all state operating funds for the upcoming budget year and three additional years. The presentation distinguishes between current services costs and the governor’s proposal to hold all spending to a 2 percent annual growth rate. But the distinction is unclear in the agency/program level budgets.
[19] Maryland appears to have a current services presentation for future years (although not for the upcoming budget year). Those projections also embed the governor’s proposed policy recommendations, though, so they are not true current services projections.
[20] See, for example, “State Budget Update, November 2010,” National Conference of State Legislatures, 2010, http://www.ncsl.org/documents/fiscal/november2010sbu_free.pdf.
More from the Authors

Areas of Expertise

Areas of Expertise