

Social Security Lifts More People Above the Poverty Line Than Any Other Program
Social Security benefits play a vital role in reducing poverty in every state, and they lift more people above the poverty line than any other program in the United States. Without Social Security, 23.5 million more adults and children in the United States (including Puerto Rico)[1] would be below the poverty line, according to our analysis of survey data for 2024 using the official poverty measure (OPM). Although most of those whom Social Security keeps out of poverty are age 65 or older, 6.5 million are under age 65, including 1.1 million children. (See Table 1.) Social Security is particularly important for older women and people of color, who have fewer retirement resources outside of Social Security. Depending on their design, reductions in Social Security benefits could significantly increase poverty, particularly among older adults.
| TABLE 1 | |||
|---|---|---|---|
Effect of Social Security on Poverty (Official Poverty Measure): 50 States, District of Columbia, and Puerto Rico, 2024 | |||
| Percent in Poverty | |||
| Age Group | Excluding Social Security | Including Social Security | Number Lifted Above the Poverty Line by Social Security |
| Children Under 18 | 16.0% | 14.5% | 1,057,000 |
| Adults Ages 18-64 | 12.4% | 9.8% | 5,423,000 |
| Adults Age 65 and Over | 37.6% | 10.3% | 16,994,000 |
| Total, All Ages | 17.8% | 10.9% | 23,474,000 |
Note: Figures are rounded to the nearest 1,000 and may not sum to totals due to rounding. Figures include Puerto Rico, so the poverty rates here are higher than comparable figures from the Census Bureau for the 50 states and District of Columbia (D.C.). For just the 50 states and D.C., the poverty rate for all ages including Social Security is 10.6 percent. Individuals in four of the five U.S. Territories — Guam, U.S. Virgin Islands, Northern Mariana Islands, and American Samoa — are not included due to data limitations. Source: CBPP analysis of the U.S. Census Bureau’s March 2025 Current Population Survey (CPS) for the 50 states and D.C. and 2024 Puerto Rico Community Survey for Puerto Rico. | |||
Newer research from the Census Bureau shows that some sources of income — especially retirement income — are underreported in surveys. The experimental measure used shows lower poverty rates, particularly among seniors. Fewer seniors with incomes below the poverty line would mean fewer seniors lifted above the poverty line by Social Security — but even after accounting for underreporting, Social Security’s impact on poverty is still bigger than any other program. (See Appendix 2 for more details.)
Social Security Lifts 17 Million People Age 65 and Older Above the Poverty Line, Survey Data Show
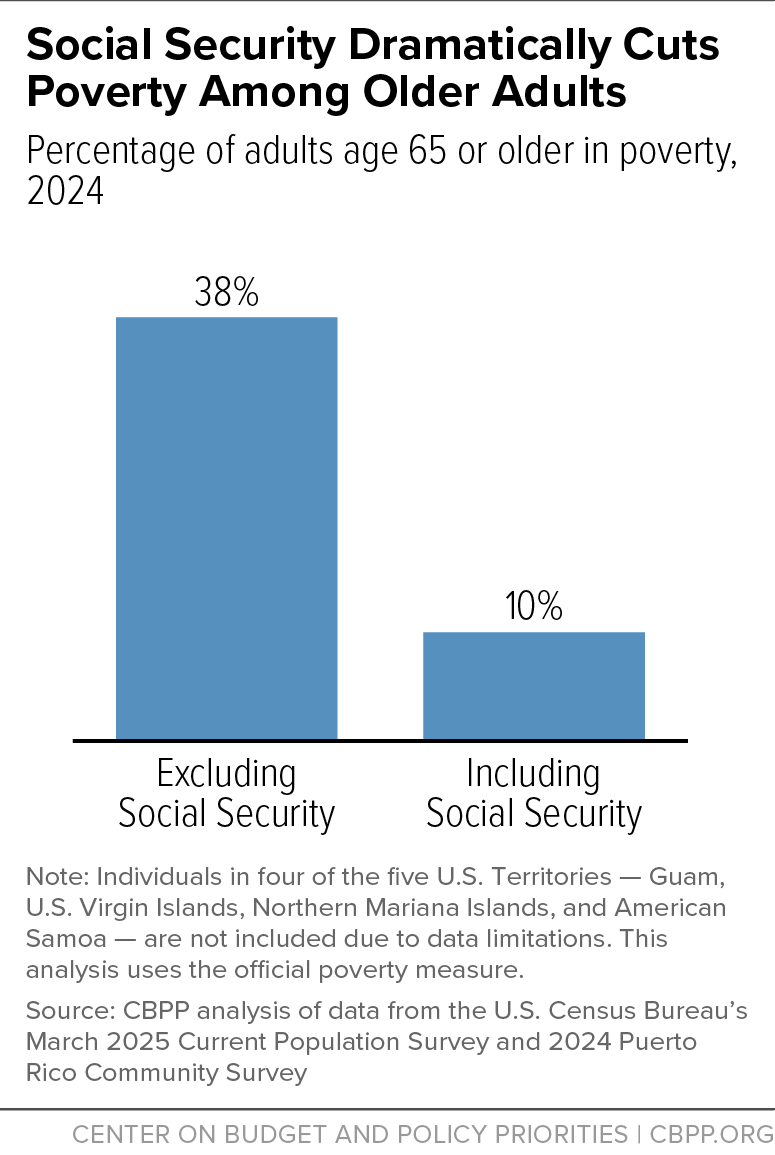
Most people age 65 and older receive the majority of their income from Social Security.[2] Without Social Security benefits, 37.6 percent of older adults would have incomes below the official poverty line, all else equal; with Social Security benefits, only 10.3 percent do. (See Figure 1.) The benefits lift 16.9 million older adults above the poverty line, survey data for the U.S. (including Puerto Rico) show.
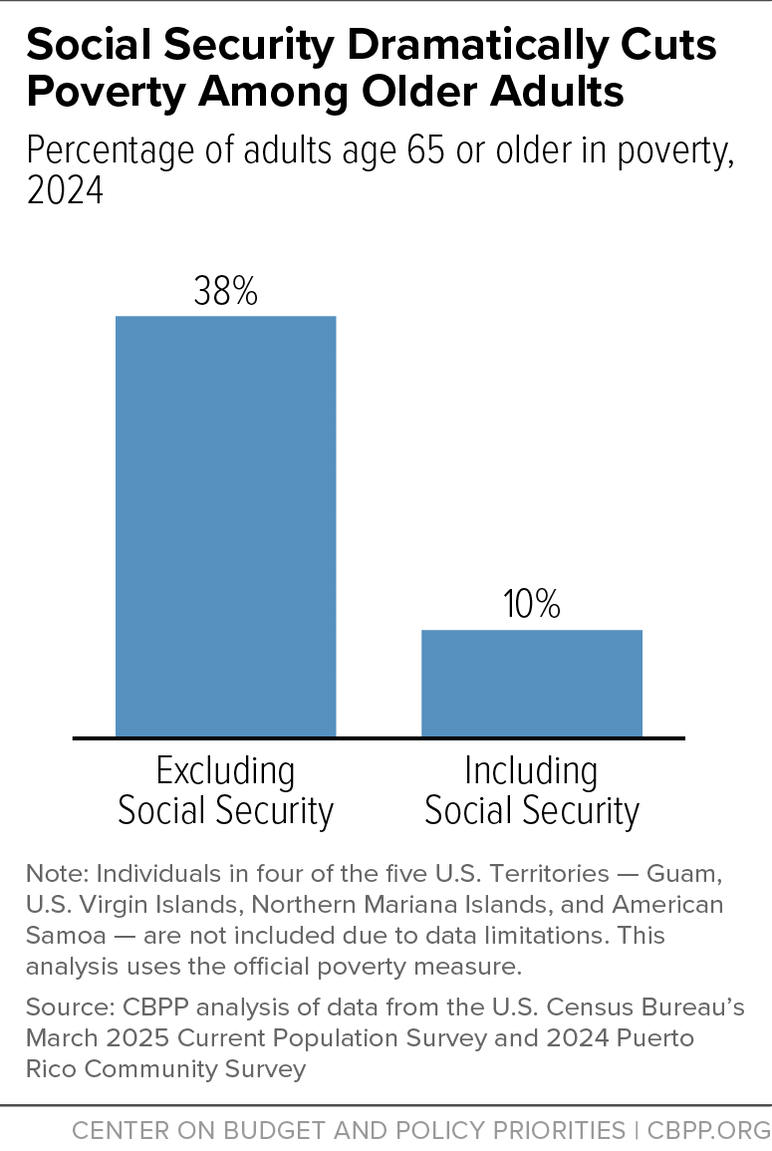
Comprehensive studies that match Census survey data to administrative records confirm that Social Security lifts millions of older adults above the poverty line, reducing the poverty rate among people age 65 and older, though by less than official estimates suggest. However, the estimated poverty rates using more comprehensive data are lower, particularly for older adults. For example, poverty among people age 65 and older was 6.5 percent in 2021, the most recent year in the Census Bureau’s experimental National Experimental Well-Being Statistics (NEWS) series, compared to the official elderly poverty rate of 10.0 percent the same year. (See Appendix 2 for more information.)
Social Security Lifts 1.1 Million Children Above the Poverty Line
Social Security is important for children and their families as well as for older adults. About 6.1 million children under age 18 (9.1 percent of all children in the U.S.) lived in families that received income from Social Security in 2024, according to Census data. This figure includes children who received their own benefits as dependents of retired, disabled, or deceased workers, as well as those who lived with parents or relatives who received Social Security. In all, Social Security lifts 1.1 million children above the poverty line.[3]
Social Security records show that 2.4 million children under age 18 qualified for Social Security payments in December 2024. (See Appendix Table 2.) Of these children, 1.3 million were the survivors of a deceased worker. Another 900,000 received payments because their parent had a severe disability. And about 300,000 children under 18 received payments because their parent was retired.[4]
Social Security Protects Groups That Are Particularly Vulnerable to Poverty
Social Security is especially important for women and people of color. Women tend to be paid less than men and perform more unpaid caregiving, meaning they accumulate less savings and receive smaller pensions on average. Because they have longer life expectancies than men, they must stretch those savings further, which is why Social Security benefits are particularly crucial in ensuring they can afford to meet their basic needs. Social Security brings 9.7 million older women above the poverty line, as Table 2 shows.
| TABLE 2 | |||
|---|---|---|---|
Effect of Social Security on Age 65 or Older Poverty by Sex and Race (Official Poverty Measure): 50 States, District of Columbia, and Puerto Rico, 2024 | |||
| Percent in Poverty | |||
| Demographic Group | Excluding Social Security | Including Social Security | Number Lifted Above the Poverty Line by Social Security |
| Sex | |||
| Men | 34.5% | 9.2% | 7,242,000 |
| Women | 40.2% | 11.2% | 9,752,000 |
| Race/Ethnicity | |||
| White | 35.2% | 7.7% | 12,380,000 |
| Black | 49.8% | 17.7% | 1,919,000 |
| Latino | 45.2% | 20.1% | 1,740,000 |
| Asian | 29.4% | 10.8 % | 605,000 |
| Other | 47.4 % | 13.4% | 348,000 |
| Total, Age 65+ | 37.6% | 10.3% | 16,994,000 |
Note: Figures are rounded to the nearest 1,000 and may not sum to totals due to rounding. Figures include Puerto Rico, so the poverty rates here are higher than comparable figures from the Census Bureau for the 50 states and District of Columbia (D.C.). For just the 50 states and D.C., the poverty rate for people age 65 or older including Social Security is 9.9 percent. Individuals in four of the five U.S. Territories — Guam, U.S. Virgin Islands, Northern Mariana Islands, and American Samoa — are not included due to data limitations. Source: CBPP analysis of the U.S. Census Bureau’s March 2025 CPS for the 50 states and D.C. and 2024 Puerto Rico Community Survey for Puerto Rico. | |||
Due to systemic racial inequities that create barriers to opportunity and employment for people of color, Black and Latino seniors are more likely to face financial insecurity in retirement. They are less likely to have financial assets, retirement accounts, and home equity than white seniors, and when they do, their value is substantially lower. Black and Latino workers are less likely to be offered workplace retirement plans and on average have lower lifetime earnings than white workers. As a result, Social Security makes up a greater portion of retirement income for seniors of color.
In addition, Black workers have higher rates of premature death than white workers, and so their spouses and children are more likely to be eligible for Social Security survivor benefits. Latino workers have longer average life expectancies than white workers, which makes Social Security’s lifelong, inflation-protected benefits particularly valuable for them. Without Social Security, the poverty rate among older Latino adults would be 45.2 percent, and the poverty rate among older Black adults would be 49.8 percent.[5]
Social Security Reduces Poverty in Every State
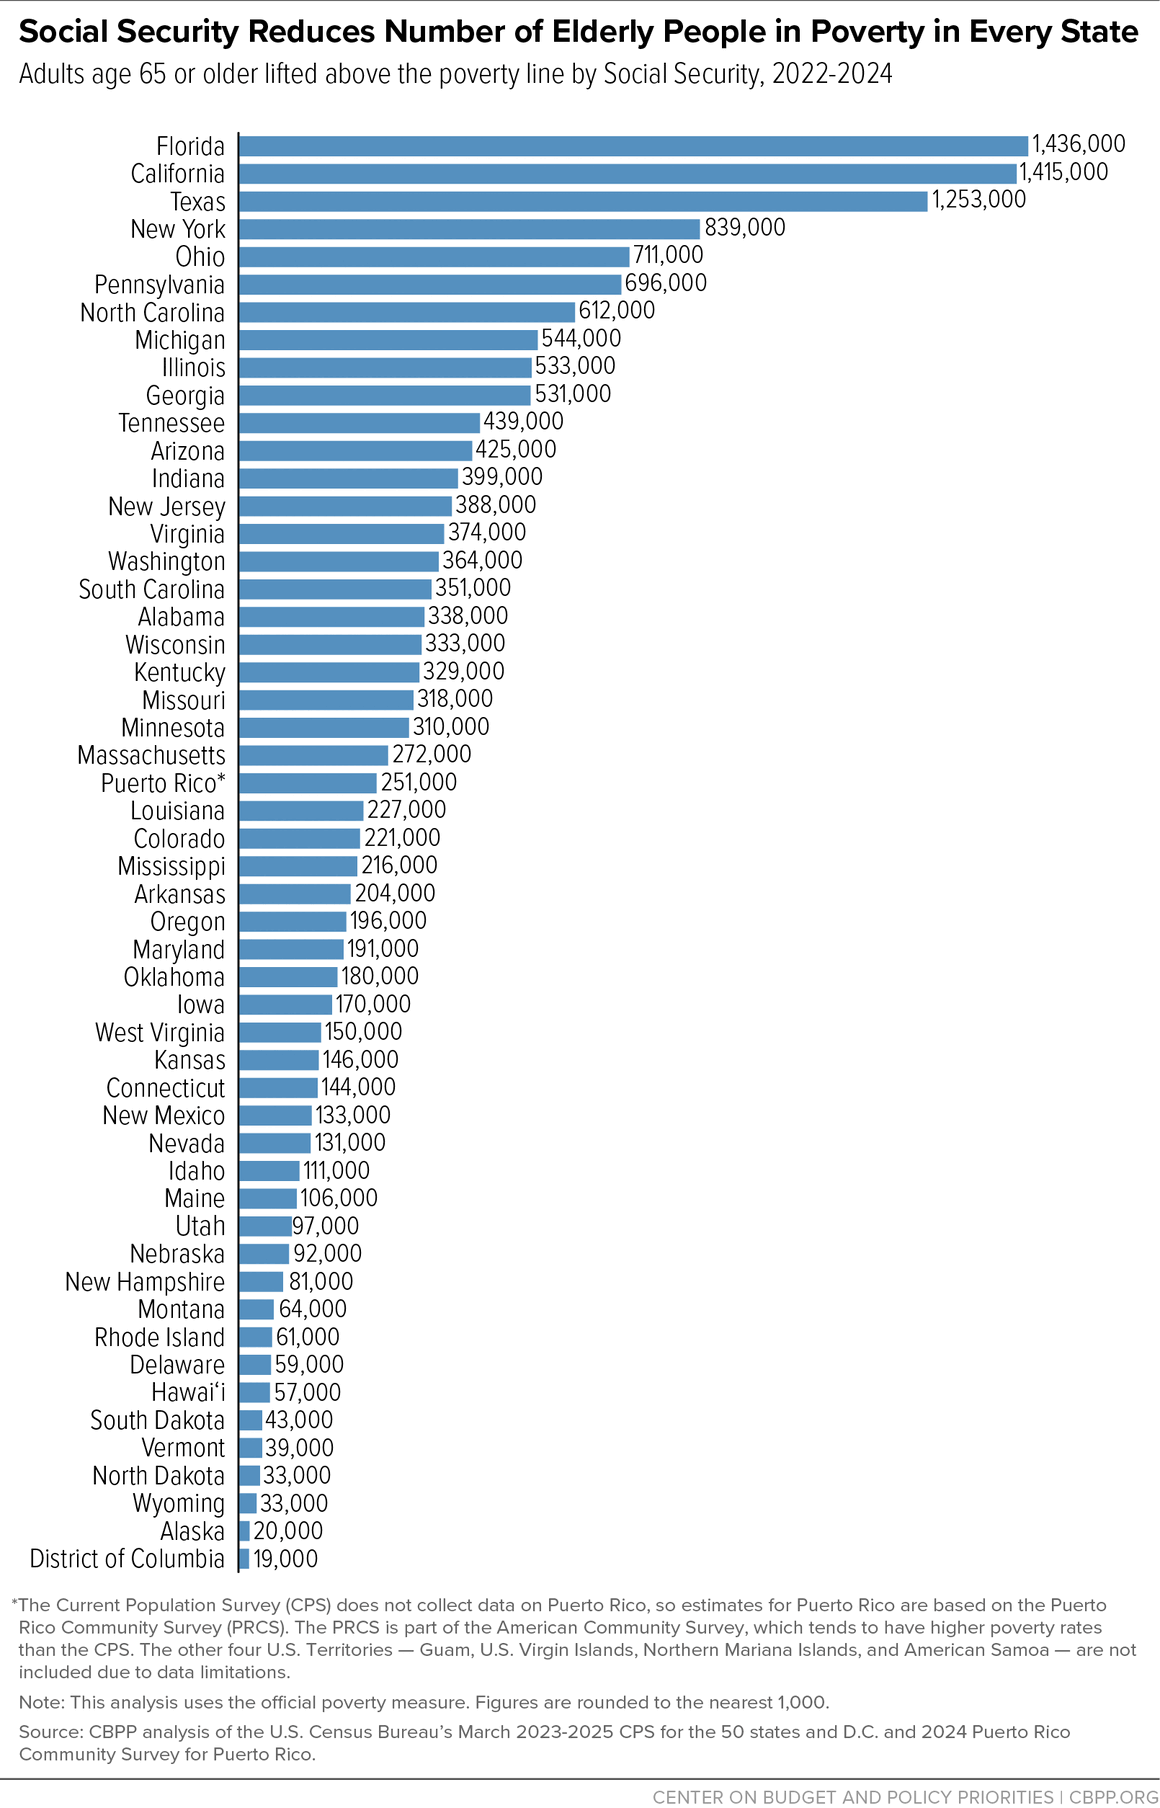
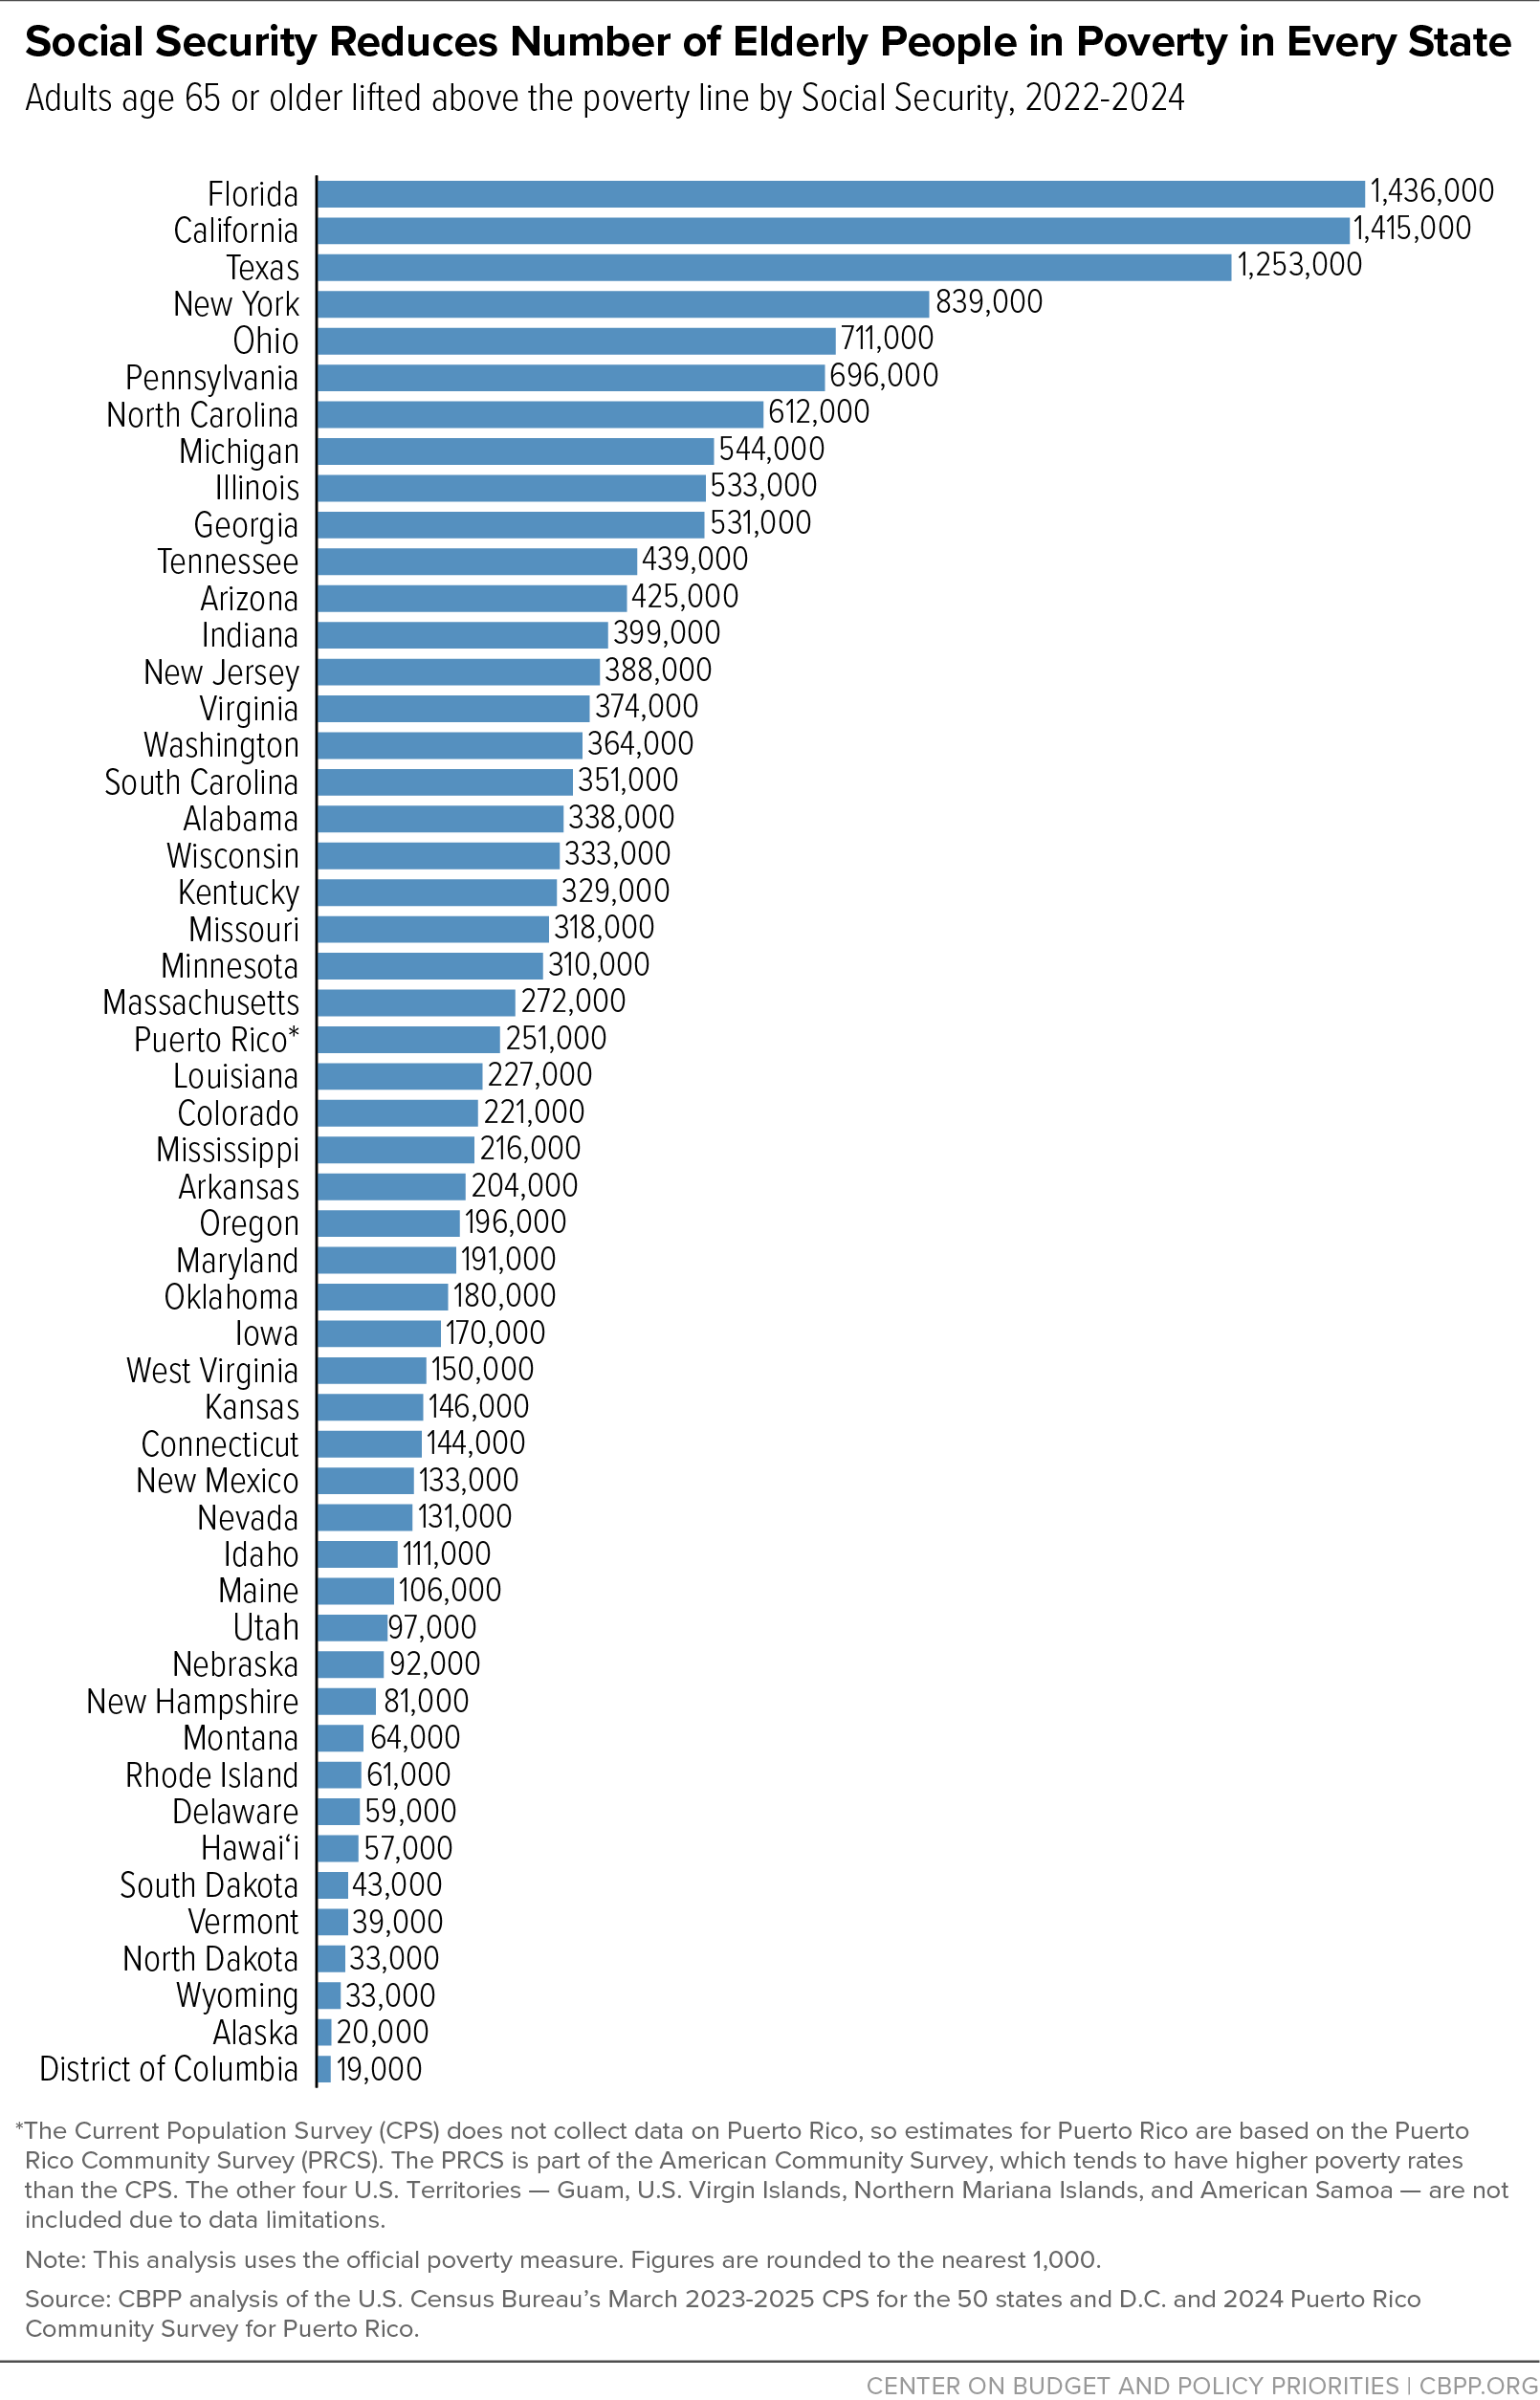
Social Security reduces poverty dramatically among older adults in every state as well as Washington, D.C. and Puerto Rico, as Figure 2 and Appendix Table 1 show. Without Social Security, the poverty rate for those age 65 and over would meet or exceed 40 percent in nearly one-third of states; with Social Security, it is less than 10 percent in nearly two-thirds of states. Social Security lifts more than 1 million older adults above the poverty line in Florida, California, and Texas, and over half a million in New York, Ohio, Pennsylvania, North Carolina, Michigan, Illinois, and Georgia.
More Than Half of Older Adults Who Never Receive Social Security Live in Poverty
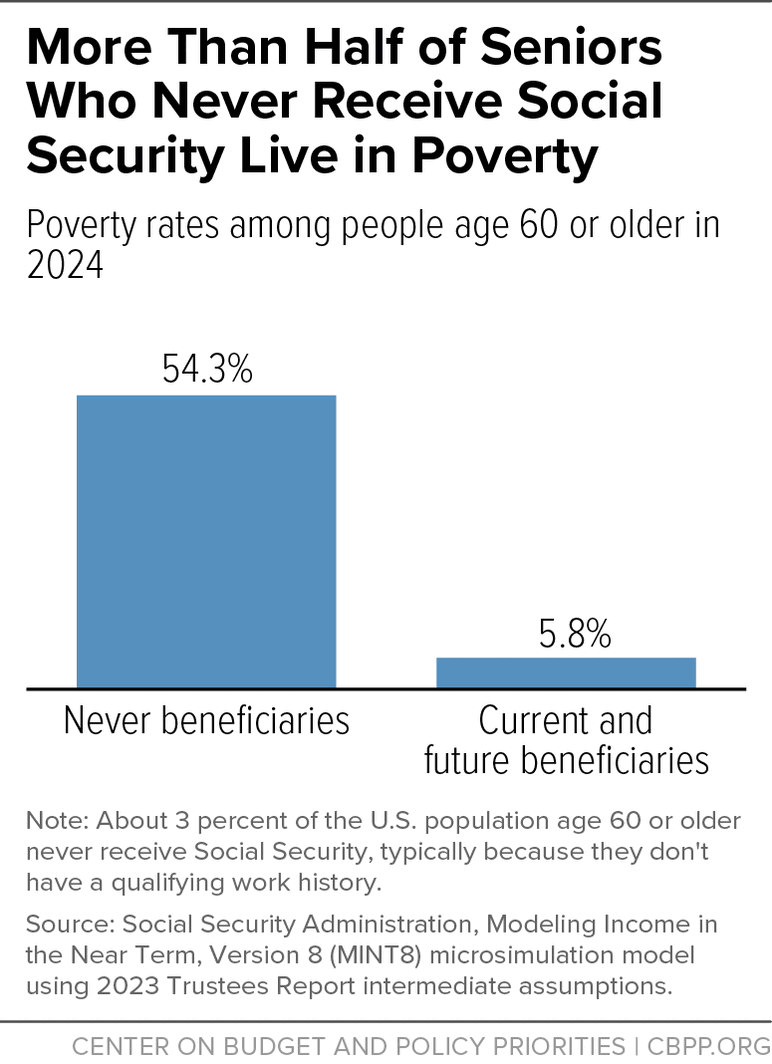
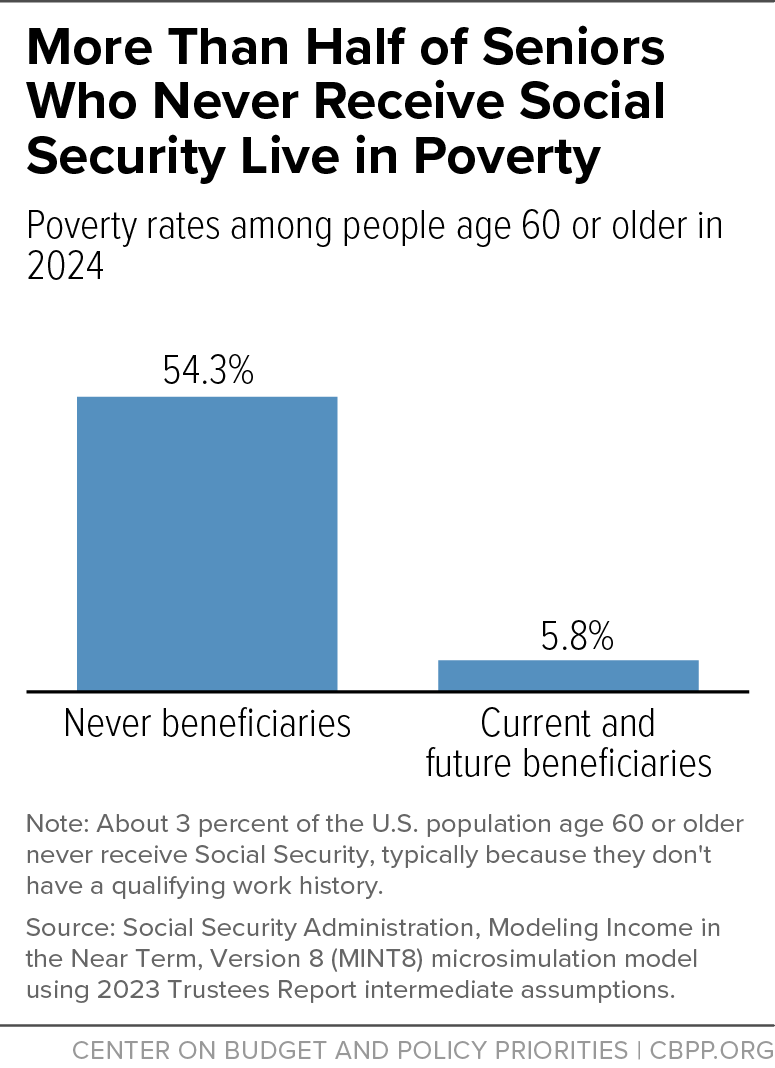
In stark contrast to the relatively low poverty rates among older adults who receive Social Security benefits, those who never receive them are dramatically more likely to have incomes below the official poverty line. In 2024, over half of these “never beneficiaries” age 60 or older had incomes below the poverty line, compared to just 6 percent of those who received benefits or would in the future, according to research from the Social Security Administration.[6] (See Figure 3.) In all, about 3 percent of the population age 60 or older never receive Social Security benefits. This is typically because they have not done enough work covered by Social Security to qualify for benefits, either because they are immigrants who arrived in the United States at age 50 or later; they have not worked frequently enough to be insured for benefits; or they have worked in jobs not covered by Social Security (primarily state and local government employees). Nearly two-thirds of never beneficiaries are women, nearly two-thirds are people of color, and over one-third have less than a high school education. The extraordinarily high poverty rate for people who never receive Social Security underscores the program’s powerful effect on reducing poverty rates, particularly for older people.
Appendix 1
This analysis uses the Census Bureau’s official definition of poverty (except for the box, “Social Security’s Effect on Poverty Using the Supplemental Poverty Measure”). In determining poverty status, the Census Bureau compares a family’s cash income before taxes with poverty thresholds that vary by the size and age of the family. The poverty thresholds in 2024 were $15,045 for an elderly individual, $18,961 for an elderly couple, and $32,130 for an average family of four.[7] To calculate the anti-poverty effects of Social Security, we determined each family’s poverty status twice — first excluding and then including the family’s Social Security benefits.
Our analysis considers the non-institutionalized population using data from the Census Bureau’s Current Population Survey (CPS), the survey that is used to produce official poverty estimates.[8] Each March the CPS collects information on personal income, health coverage, and other social and economic characteristics for the previous year. The national estimates reported here are for 2024. The state-by-state estimates are based on a three-year average of CPS data (2023 to 2025) to improve their reliability. The estimate for Puerto Rico is based on a single year of data (2024) using the Puerto Rico Community Survey.
This analysis does not consider other changes that would occur in the absence of Social Security. If Social Security did not exist, many individuals age 65 or older likely would have saved somewhat more and worked somewhat longer, and many might live with their adult children rather than in their own households. Other studies confirm, however, that Social Security has made a significant contribution to reducing poverty and that cutting Social Security benefits could substantially increase poverty among older adults.[9]
| APPENDIX TABLE 1 | |||
|---|---|---|---|
Effect of Social Security on Poverty Among Adults Age 65 and Older by State (Official Poverty Measure), 2022-2024 | |||
| Percent in Poverty | |||
| State | Excluding Social Security | Including Social Security | Number Lifted Above the Poverty Line by Social Security |
| Alabama | 50.0% | 13.9% | 338,000 |
| Alaska | 28.9% | 10.1% | 20,000 |
| Arizona | 39.8% | 9.5% | 425,000 |
| Arkansas | 48.3% | 10.7% | 204,000 |
| California | 33.0% | 10.9% | 1,415,000 |
| Colorado | 29.9% | 8.3% | 221,000 |
| Connecticut | 28.5% | 8.6% | 144,000 |
| Delaware | 32.5% | 7.3% | 59,000 |
| District of Columbia | 35.3% | 15.4% | 19,000 |
| Florida | 39.7% | 11.0% | 1,436,000 |
| Georgia | 42.0% | 11.7% | 531,000 |
| Hawai’i | 25.3% | 6.3% | 57,000 |
| Idaho | 40.7% | 8.2% | 111,000 |
| Illinois | 34.5% | 10.2% | 533,000 |
| Indiana | 40.9% | 7.3% | 399,000 |
| Iowa | 33.8% | 5.6% | 170,000 |
| Kansas | 33.1% | 6.0% | 146,000 |
| Kentucky | 49.6% | 10.8% | 329,000 |
| Louisiana | 45.8% | 15.6% | 227,000 |
| Maine | 39.0% | 8.0% | 106,000 |
| Maryland | 24.4% | 6.7% | 191,000 |
| Massachusetts | 32.1% | 10.2% | 272,000 |
| Michigan | 36.8% | 7.8% | 544,000 |
| Minnesota | 36.2% | 6.2% | 310,000 |
| Mississippi | 56.7% | 15.1% | 216,000 |
| Missouri | 36.4% | 7.1% | 318,000 |
| Montana | 35.7% | 9.0% | 64,000 |
| Nebraska | 34.8% | 8.2% | 92,000 |
| Nevada | 33.0% | 9.4% | 131,000 |
| New Hampshire | 34.3% | 8.1% | 81,000 |
| New Jersey | 31.2% | 8.6% | 388,000 |
| New Mexico | 45.4% | 13.6% | 133,000 |
| New York | 35.3% | 12.0% | 839,000 |
| North Carolina | 43.4% | 11.7% | 612,000 |
| North Dakota | 38.8% | 7.3% | 39,000 |
| Ohio | 40.1% | 8.6% | 711,000 |
| Oklahoma | 40.1% | 11.7% | 180,000 |
| Oregon | 30.4% | 6.8% | 196,000 |
| Pennsylvania | 38.0% | 9.9% | 696,000 |
| Puerto Rico * | 70.9% | 38.7% | 251,000 |
| Rhode Island | 38.7% | 8.9% | 61,000 |
| South Carolina | 43.5% | 10.2% | 351,000 |
| South Dakota | 35.6% | 8.2% | 43,000 |
| Tennessee | 44.5% | 10.4% | 439,000 |
| Texas | 41.2% | 11.7% | 1,253,000 |
| Utah | 29.9% | 7.5% | 97,000 |
| Vermont | 36.0% | 6.3% | 43,000 |
| Virginia | 34.2% | 9.7% | 374,000 |
| Washington | 34.5% | 6.9% | 364,000 |
| West Virginia | 54.4% | 14.0% | 150,000 |
| Wisconsin | 35.5% | 5.3% | 333,000 |
| Wyoming | 36.4% | 7.3% | 33,000 |
* The Current Population Survey (CPS) does not collect data on Puerto Rico, so estimates for Puerto Rico are based on the Puerto Rico Community Survey (PRCS). The PRCS is part of the American Community Survey, which tends to have higher poverty rates than the CPS. The other four U.S. Territories — Guam, U.S. Virgin Islands, Northern Mariana Islands, and American Samoa — are not included due to data limitations. Note: Income is family cash income. The poverty rate “including Social Security” is the official poverty rate. Figures are rounded to the nearest 1,000. Source: CBPP analysis of the U.S. Census Bureau’s March 2023-2025 CPS for the 50 states and D.C. and 2024 Puerto Rico Community Survey for Puerto Rico. | |||
| APPENDIX TABLE 2 | ||||
|---|---|---|---|---|
Social Security Beneficiaries by State or Other Area and Age, 2024 | ||||
| State | Total | Age 65 and Older | Ages 18-64 | Children Under 18 |
| Alabama | 1,193,685 | 878,283 | 255,334 | 60,608 |
| Alaska | 118,014 | 94,766 | 16,733 | 6,515 |
| American Samoa | 6,269 | 3,234 | 1,924 | 1,111 |
| Arizona | 1,533,323 | 1,267,145 | 211,381 | 54,797 |
| Arkansas | 726,942 | 531,244 | 159,767 | 35,931 |
| California | 6,544,000 | 5,499,127 | 846,341 | 198,532 |
| Colorado | 987,075 | 835,280 | 120,844 | 30,951 |
| Connecticut | 737,503 | 615,123 | 100,808 | 21,572 |
| Delaware | 248,565 | 205,223 | 35,535 | 7,807 |
| District of Columbia | 85,682 | 68,056 | 14,056 | 3,570 |
| Florida | 5,161,992 | 4,262,361 | 732,349 | 167,282 |
| Georgia | 2,023,789 | 1,567,719 | 361,396 | 94,674 |
| Guam | 20,986 | 15,723 | 3,610 | 1,653 |
| Hawai’i | 302,577 | 259,966 | 33,129 | 9,482 |
| Idaho | 407,057 | 331,283 | 61,622 | 14,152 |
| Illinois | 2,360,590 | 1,930,049 | 352,932 | 77,609 |
| Indiana | 1,447,416 | 1,132,352 | 255,107 | 59,957 |
| Iowa | 701,239 | 572,259 | 107,391 | 21,589 |
| Kansas | 599,566 | 485,563 | 91,185 | 22,818 |
| Kentucky | 1,036,142 | 756,793 | 229,584 | 49,765 |
| Louisiana | 953,188 | 714,924 | 188,720 | 49,544 |
| Maine | 375,793 | 299,004 | 64,681 | 12,108 |
| Maryland | 1,092,693 | 899,593 | 153,327 | 39,773 |
| Massachusetts | 1,348,171 | 1,103,434 | 202,405 | 42,332 |
| Michigan | 2,339,826 | 1,835,984 | 419,722 | 84,120 |
| Minnesota | 1,152,818 | 953,473 | 163,786 | 35,559 |
| Mississippi | 699,697 | 506,900 | 153,688 | 39,109 |
| Missouri | 1,380,814 | 1,067,100 | 257,075 | 56,639 |
| Montana | 264,264 | 218,826 | 36,764 | 8,764 |
| N. Mariana Islands | 4,160 | 2,751 | 889 | 520 |
| Nebraska | 378,332 | 311,339 | 53,833 | 13,160 |
| Nevada | 607,411 | 497,763 | 88,120 | 21,528 |
| New Hampshire | 343,052 | 277,146 | 54,109 | 11,797 |
| New Jersey | 1,735,645 | 1,443,359 | 237,397 | 54,889 |
| New Mexico | 476,894 | 376,172 | 79,911 | 20,811 |
| New York | 3,838,030 | 3,105,574 | 610,161 | 122,295 |
| North Carolina | 2,329,477 | 1,831,435 | 409,826 | 88,216 |
| North Dakota | 150,098 | 123,784 | 20,884 | 5,430 |
| Ohio | 2,507,421 | 1,986,158 | 428,260 | 93,003 |
| Oklahoma | 853,382 | 649,777 | 163,471 | 40,134 |
| Oregon | 943,032 | 786,589 | 131,713 | 24,730 |
| Pennsylvania | 2,981,684 | 2,404,423 | 480,720 | 96,541 |
| Puerto Rico | 833,239 | 624,245 | 184,855 | 24,139 |
| Rhode Island | 241,323 | 192,569 | 40,694 | 8,060 |
| South Carolina | 1,297,829 | 1,020,548 | 225,907 | 51,374 |
| South Dakota | 201,259 | 167,305 | 27,105 | 6,849 |
| Tennessee | 1,564,675 | 1,196,089 | 297,402 | 71,184 |
| Texas | 4,802,392 | 3,844,458 | 748,194 | 209,740 |
| U.S. Virgin Islands | 22,536 | 18,842 | 2,809 | 885 |
| Utah | 471,696 | 384,020 | 66,039 | 21,637 |
| Vermont | 164,694 | 133,773 | 25,802 | 5,119 |
| Virginia | 1,685,819 | 1,362,376 | 263,683 | 59,760 |
| Washington | 1,485,645 | 1,240,685 | 202,048 | 42,912 |
| West Virginia | 479,424 | 358,824 | 99,126 | 21,474 |
| Wisconsin | 1,365,446 | 1,105,512 | 219,071 | 40,863 |
| Wyoming | 129,564 | 106,131 | 18,983 | 4,450 |
| Total | 68,455, 973 | 55,120,239 | 10,846,407 | 2,489,327 |
Note: Totals include residents of territories and people in the U.S. who reside abroad. Source: Social Security Administration, Annual Statistical Supplement to the Social Security Bulletin, 2025, Table 5.J5, https://www.ssa.gov/policy/docs/statcomps/supplement/2025/5j.pdf | ||||
Appendix 2
A 2017 study by Adam Bee and Joshua Mitchell of the Census Bureau matched the CPS survey responses used for official poverty statistics in 2012 to administrative data from the Social Security Administration (SSA), the Internal Revenue Service, and other government sources.[10] They found that official estimates overstate older adults’ reliance on Social Security and poverty rates among older adults, but confirmed that Social Security lifts millions of adults age 65 and older above the poverty line and dramatically reduces the poverty rate among these adults. They did not find significant underreporting of income among people of working age. Further study has confirmed their findings using more recent data, but Bee and Mitchell’s study remains the most detailed analysis of older adults’ income with corrections for underreporting.[11]
Bee and Mitchell found that survey respondents generally reported accurately whether they received Social Security or earnings, but not whether they received pension income. Roughly half of older adult respondents who received pension income — either income from traditional defined-benefit pensions or withdrawals from defined-contribution pensions like 401(k)s or individual retirement accounts — failed to report this, particularly respondents whose pension income was small or inconsistent. On the other hand, respondents who reported receiving Social Security, earnings, or pension income generally reported accurately the amount they received from those sources.
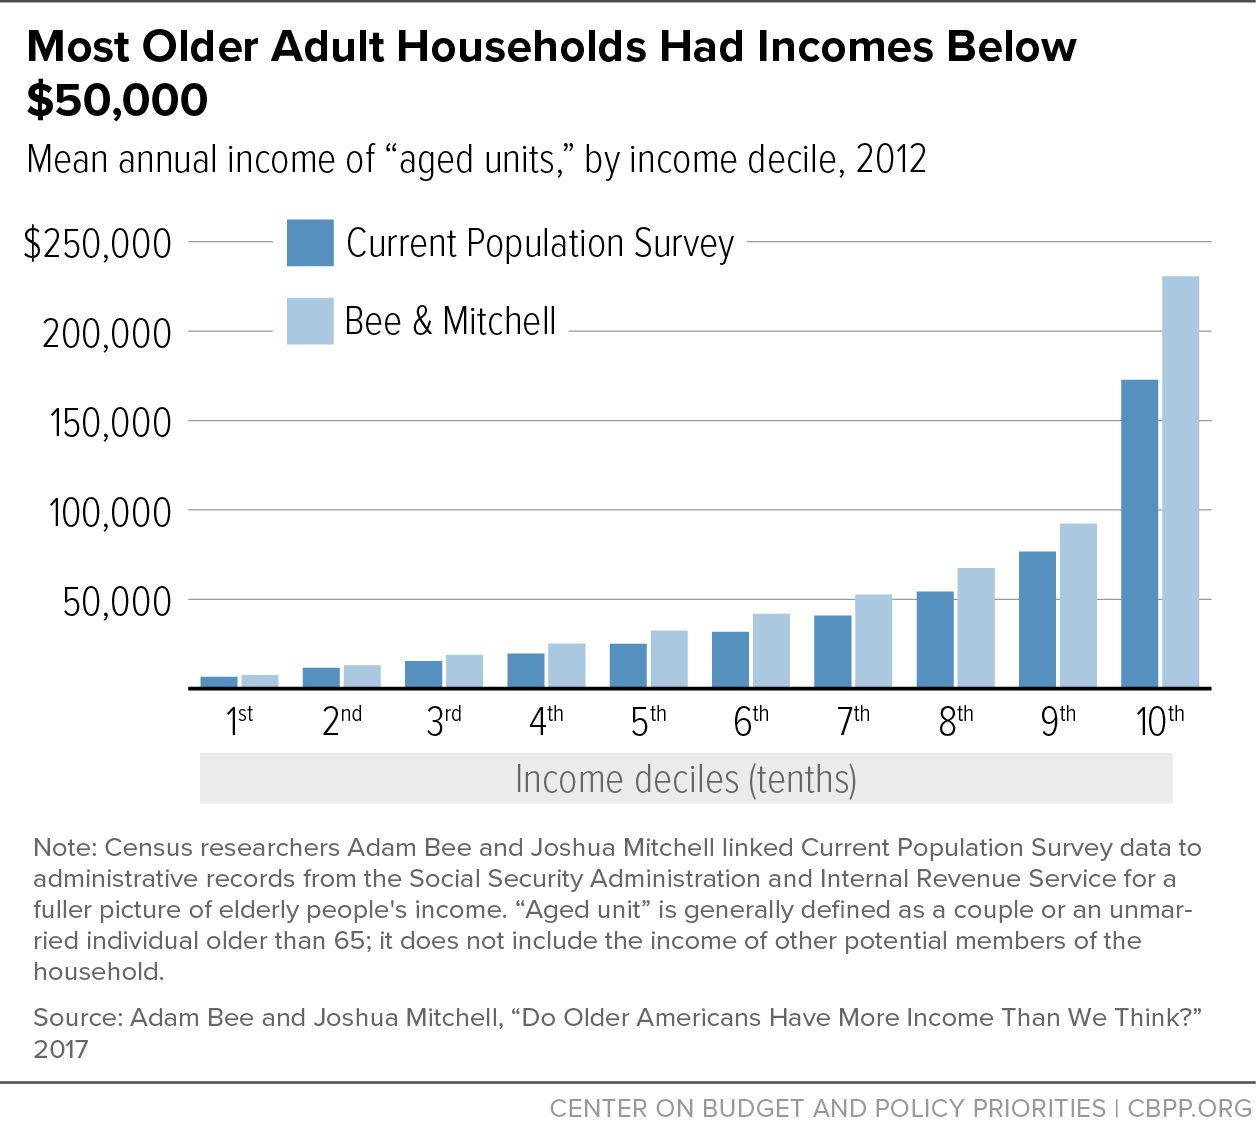
Most retirees have modest incomes, save for some at the top of the income spectrum. Bee and Mitchell show that most low-income older adult households have very little pension income, if any; the majority of older adult households in the bottom third of the income distribution receive no pension income at all (compared to more than 80 percent in the top two-thirds). Older adult households had a median income of about $44,000 in 2012 (compared to about $34,000 using the CPS alone, about a 30 percent difference). Further, about 1 in 4 older adult households lived on less than $20,000, and the majority lived on $50,000 or less. Meanwhile, the wealthiest tenth of older adult households had an average income of about $230,000. (See Appendix Figure 1.)
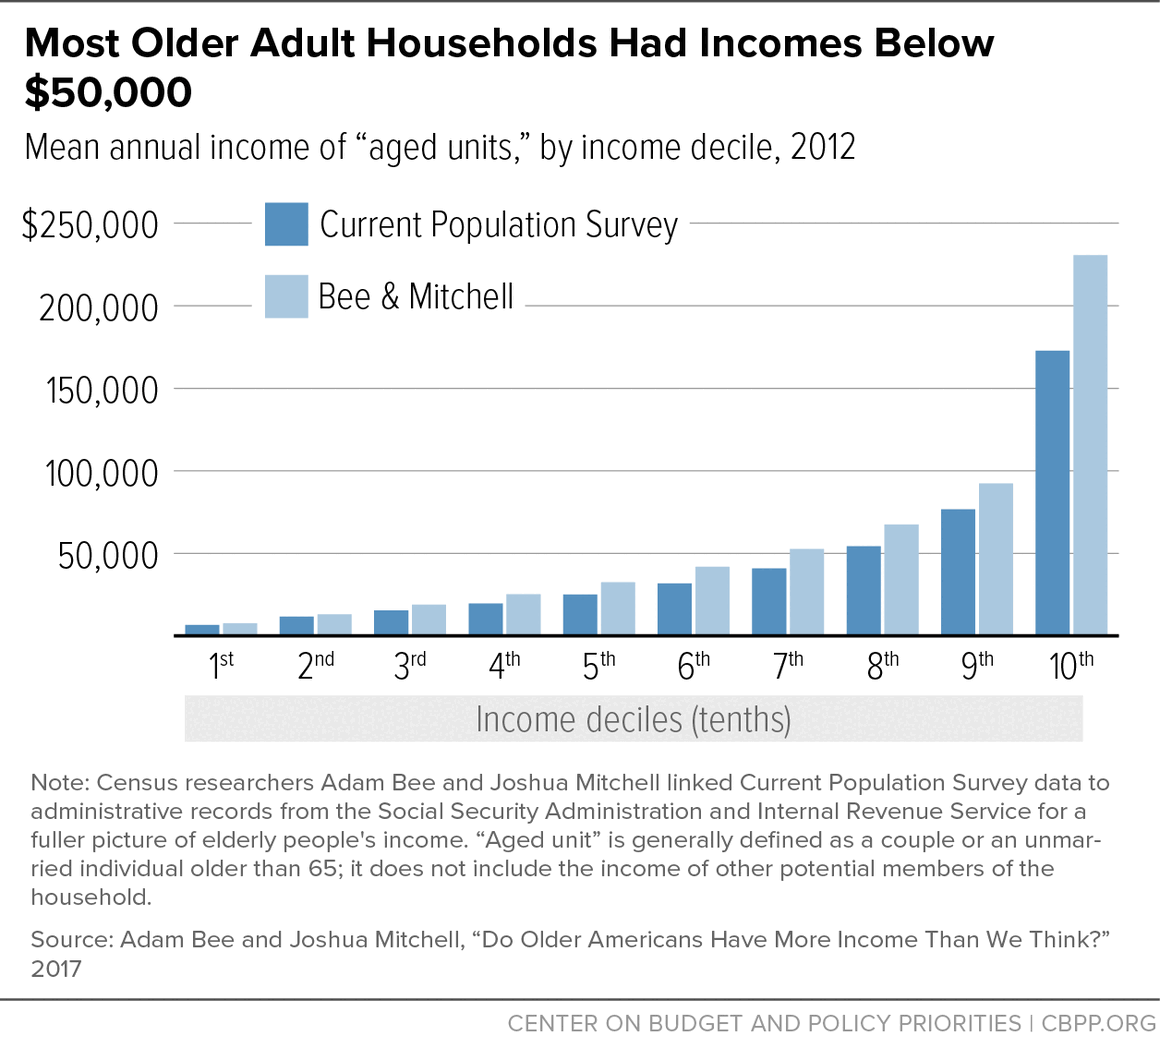
Bee and Mitchell’s study confirms Social Security’s large effect on poverty among older adults, but the enhanced data reduce both the poverty rate for these adults and the number of older adults lifted above the poverty line, compared to the official measures. The study estimates an elderly poverty rate in 2012 of nearly 7 percent, rather than the official rate of 9 percent. It also estimates that Social Security lifted about 3 in 10 older people — 10 million — above the poverty line, about one-third lower than official estimates.
The study also confirms that Social Security remains the foundation of retirement income. It is the largest single source of income for older adults, providing the majority of income for half of retirees and at least 90 percent of income for 18 percent of retirees.[12] These rates of reliance are similar to Health and Retirement Survey and Survey of Income and Program Participation estimates.[13] However, they indicate significantly less reliance on Social Security than the CPS alone, which estimated that about 65 percent of older adults received at least half of their income from Social Security and that 36 percent received at least 90 percent. Bee and Mitchell’s study also finds that Supplemental Security Income (SSI) plays a more important role in older adults’ income than official figures suggest, as many older adults with low incomes confuse SSI with Social Security.
More recently, Bee and Mitchell, along with other Census Bureau experts, have constructed an experimental poverty measure, the National Experimental Well-Being Statistics (NEWS), which aims to improve income and poverty statistics by incorporating other sources of data, such as administrative records and other surveys. This research brings in more sources of data and estimates poverty rates for people of all ages. But it does not include estimates of the number of people lifted out of poverty by Social Security or reliance on the program, as their earlier research did.
The NEWS measure is intended to address underreporting, as well as non-response to surveys, missing information, and other sources of measurement error. The differences between NEWS and the survey data vary substantially by age group. While NEWS estimates of the official poverty rate are somewhat lower for children and working-age adults, they are substantially lower for older adults. In 2021, the most recent year for which this experimental measure is available:
- the poverty rate for children was 15.3 percent using the survey data and 14.7 percent using NEWS (a difference of 0.6 percentage points or 4 percent);
- the poverty rate for 18- to 64-year-olds was 10.5 percent using the survey data and 8.8 percent using NEWS (a difference of 1.7 percentage points or 16 percent); and
- the poverty rate for those 65 or older was 10.0 percent using the survey data and 6.5 percent using NEWS (a difference of 3.5 percentage points or 35 percent).
However, these experimental estimates lag the official estimates by several years and provide fewer details; in particular, they do not estimate the impact of Social Security. As a result, we cannot use them as the basis of our annual analysis of Social Security’s effect on poverty. We will continue to monitor the development of the NEWS measure and incorporate it into our analysis if and when it becomes feasible.
End Notes
[1] To arrive at a national figure that includes Puerto Rico, this report combines data from two sources, the Current Population Survey (which has the most accurate available current family income data for the 50 states and D.C.) and the Census Bureau's Puerto Rico Community Survey (which has the only current family income data for Puerto Rico).
[2] CBPP, “Policy Basics: Top Ten Facts About Social Security,” updated May 31, 2024, https://www.cbpp.org/research/social-security/policy-basics-top-ten-facts-about-social-security.
[3] CBPP analysis of the U.S. Census Bureau’s March 2025 Current Population Survey.
[4] Social Security Administration (SSA), “Annual Statistical Supplement to the Social Security Bulletin,” 2025, Table 5.A5, https://www.ssa.gov/policy/docs/statcomps/supplement/2025/5a.pdf.
[5] CBPP analysis of the U.S. Census Bureau’s March 2025 Current Population Survey.
[6] SSA, “Never Beneficiaries, Aged 60 or Older, 2024,” May 2024, https://www.ssa.gov/policy/docs/population-profiles/never-beneficiaries.html.
[7] Poverty thresholds depend on the size of the family and its members’ ages; the $32,130 figure is a weighted average for families of four. For more information, see https://www.census.gov/data/tables/time-series/demo/income-poverty/historical-poverty-thresholds.html.
[8] U.S. Census Bureau, “Income, Poverty, and Health Insurance Coverage in the United States: 2024,” September 9, 2025, https://www.census.gov/newsroom/press-releases/2025/income-poverty-health-insurance-coverage.html
[9] Eugene Smolensky, Sheldon Danziger, and Peter Gottschalk, “The Declining Significance of Age in the United States: Trends in the Well-Being of Children and the Elderly Since 1939,” in John L. Palmer, Timothy Smeeding, and Barbara Boyle Torrey, eds., The Vulnerable, Urban Institute, 1988; Gary V. Engelhardt and Jonathan Gruber, “Social Security and the Evolution of Elderly Poverty,” National Bureau of Economic Research Working Paper 10466, May 2004.
[10] Adam Bee and Joshua Mitchell, “Do Older Americans Have More Income Than We Think?” U.S. Census Bureau, Social, Economic, and Housing Statistics Division Working Paper No. 2017-39, July 2017, https://www.census.gov/content/dam/Census/library/working-papers/2017/demo/SEHSD-WP2017-39.pdf.
[11] Irena Dushi and Brad Trenkamp, “Improving the Measurement of Retirement Income of the Aged Population,” SSA, Office of Research, Evaluation, and Statistics Working Paper No. 116, January 2021, https://www.ssa.gov/policy/docs/workingpapers/wp116.html.
[12] Bee and Mitchell, 2017, Table 10.
[13] Irena Dushi, Howard M. Iams, and Brad Trenkamp, “The Importance of Social Security Benefits to the Income of the Aged Population,” Social Security Bulletin, 2017, https://www.ssa.gov/policy/docs/ssb/v77n2/v77n2p1.html.