Previewing Next Week’s Census Bureau Data on Poverty, Income, and Health Insurance
Needless to say, those data will bear little resemblance to conditions today. Next Tuesday’s release of Census Bureau data on health insurance, poverty, and income for 2019 will provide a record of conditions in the United States before the COVID-19 pandemic and the resulting recession hit. Needless to say, those data will bear little resemblance to conditions today. Four points are worth noting in advance of the release of these data.
1) The Economic Landscape Has Changed Dramatically Since 2019
Today’s economic conditions are vastly different from those of a year ago. The economy generally continued to improve in 2019, although unevenly, making it likely that the Census data will show incomes rose and the poverty rate declined modestly from the year before — although we expect no improvement, and possibly further backsliding, on health insurance coverage in 2019.
The pace of improvement slowed in 2019 for many key indicators tied to income and poverty. The annual unemployment rate fell at the slowest pace in nine years in 2019, while the number of nonfarm jobs and the index of aggregate hours worked by non-supervisory workers both grew at the slowest rate in eight years. Inflation-adjusted hourly wages rose by 1.7 percent, but average hours worked per week declined. Taken together, these figures would lead one to expect improvements in income and poverty in 2019, but modest ones.
Since the March 13, 2020 declaration of a national coronavirus emergency, however, much has changed:
- The nation has endured the deepest recession since the 1930s, with an official unemployment rate peaking at a seasonally adjusted 14.7 percent in April and remaining elevated since. Some 35 million people were either unemployed or lived with an unemployed family member in August, including 9 million children. Millions more workers were not defined as unemployed by the Labor Department but were sidelined by safety needs, illness, or caretaking responsibilities because of the crisis.[1] Some 30 million people were claiming unemployment benefits as of August 22.[2]
- Food affordability problems have soared. Indicators of food insufficiency for families with children doubled or more in the early days of the pandemic, multiple studies show.[3] A Brookings study issued in early July found that “young children are experiencing food insecurity to an extent unprecedented in modern times.”[4] In Census Bureau data collected between August 19 and August 31, more than 22 million adults, or over 10 percent, reported their household had “not enough to eat” sometimes or often in the last seven days. Our analysis of a separate survey, for December 2019, also released this week by the Census Bureau, shows that only about 3.7 percent of adults reported experiencing this problem sometimes or often during the whole 12 months of 2019.[5]
- • Rising food prices have added to the strain. Factors such as supply disruptions pushed supermarket and grocery store food prices 4.6 percent higher in August 2020 than in August of last year. By comparison, overall prices rose just 1.3 percent over the same period.[6]
- Millions of renters were behind on the rent in late August, and multiple data sources suggested that throughout the summer rising shares of renters experienced problems paying rent.[7]
- Food and housing hardships have hit hardest among Black and Latino people, who work disproportionately in low-paying industries that have experienced deep job losses in the pandemic, and many of whom entered the pandemic with limited household resources due to factors such as historical and ongoing labor-market discrimination and past discrimination in government housing and other policies.
2) The Pandemic Influenced Data Collection, Likely Exaggerating the 2019 Decline in Poverty
On September 15, the Census Bureau will release income, poverty, and health insurance data for 2019 from the Current Population Survey (CPS). These data were collected in the early days of the pandemic, which reduced participation in the Census survey, especially by lower-income respondents. This effect could cause the survey data to overstate both income gains in 2019 and the reduction in the poverty rate, perhaps by as much as 0.3 percentage points or about 1 million people.[8]
The Census Bureau expects, on or around September 15, to release its own evaluation of the pandemic’s influence on the income and poverty numbers.
3) After Ten Years of Economic Growth, Highs and Lows Should Be Kept in Context
2019 marked the end of a record-long period of economic growth with rising income and employment and reductions in poverty. Although employment growth rates slowed in 2017, 2018, and 2019 from their peak rates in 2015 and 2016, inflation-adjusted income levels may have reached a record high in 2019, and some poverty rates may reach record lows (even apart from the mismeasurement issues noted above).
- The 2019 data could show a record low poverty rate for Black people. The post-Great Recession recovery period, like many other recoveries, featured a job market that improved more slowly for Black workers than for white workers. In part because Black workers have often been “last hired and first fired,” Black poverty rates tend to be especially sensitive to economic cycles. But after a decade of economic growth, Black unemployment stood at a record low of 6.1 percent in 2019 (with data back to 1972). The current crisis has sharply reversed this progress, with Black unemployment rising more and recovering much more slowly than white unemployment. In August, Black unemployment stood at a seasonally adjusted 13.0 percent, while white unemployment stood at 7.3 percent. (The August Hispanic unemployment rate was 10.5 percent, and the Asian rate was 10.7 percent.)
- A finding of record-high median income in 2019 would be welcome but not unusual. Income levels generally surpass previous high points by the final years of every economic growth cycle.[9] Inflation-adjusted household income stood at its highest level on record during 15 of the last 50 years, including over 40 percent of the non-recession years.
4) Health Insurance Data Are Likely to Show an Increase in the Share of People Who Are Uninsured, Despite Economic Growth in 2019
Estimates from two Census Bureau surveys due out on September 15, the CPS and the American Community Survey (ACS), are likely to show that the number and share of people without health insurance increased in 2019. And the data almost certainly will show that despite three years of growing employment from 2016 to 2019, the number and share of people uninsured in 2019 was above the historic low of 8.6 percent achieved in 2016, as measured in the ACS data. (See Figure 1.)
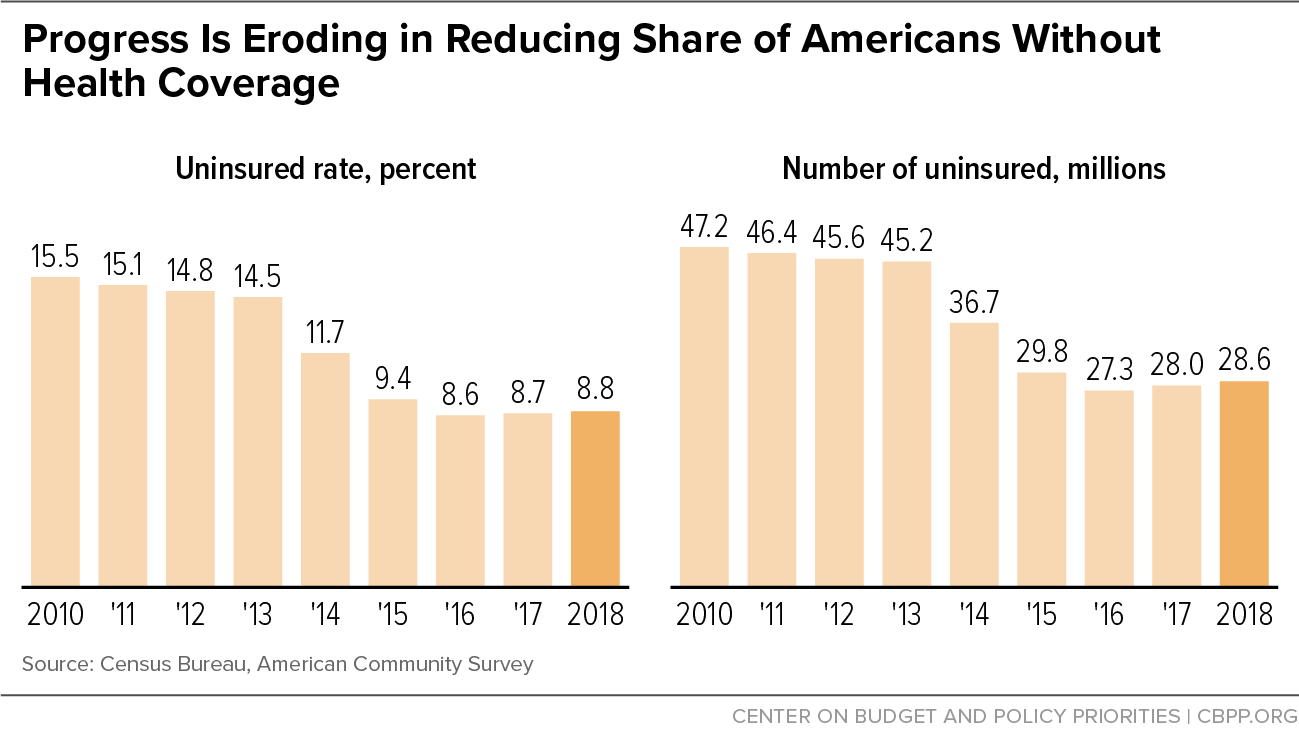
The ACS, which is much larger than the CPS and therefore provides a more reliable measure of small changes over time, showed a modest but significant increase in the uninsured rate in both 2017 and 2018, after a period of six straight years of decline.[10]
While the uninsured rate will undoubtedly remain well below its levels prior to the Affordable Care Act (ACA), ongoing Trump Administration policies to weaken the ACA have eroded a small but meaningful share of these gains. Such policies in effect in 2019 included:
- The repeal of the ACA’s individual mandate — the requirement that most people have coverage or pay a penalty. This will lead to as many as 7 million more uninsured people by 2021, the Congressional Budget Office has estimated.[11]
- Changes in how eligibility for, or participation in, Medicaid is considered when U.S. immigration authorities determine who can legally enter the United States or become a lawful permanent resident. The Administration’s harsh stance on this matter has sown fear and confusion that likely have caused a number of people in immigrant families to forgo or lose health insurance.[12]
- Cuts to outreach and enrollment assistance for the ACA marketplaces.[13]
- Support and encouragement for various state policies that erect barriers to Medicaid participation, which may have contributed to the Medicaid enrollment declines seen for adults and children in 2019.[14]
In substantial part due to these policies, it’s highly unlikely that the uninsured rate declined in 2019, despite employment gains that would otherwise be expected to result in greater health coverage. And so it is virtually certain that the country entered the pandemic with a higher uninsured rate than in 2016.
Moreover, several datapoints suggest that the uninsured rate likely rose in 2019. Data from the smaller, previously released National Health Interview Survey (NHIS), which typically align with the annual Census data, show that the uninsured rate increased by a statistically significant 0.9 percentage points in 2019 compared to 2018.[15] The Census Bureau earlier reported that the share of people who reported they were uninsured in March 2019 was higher than the share in March 2018 (9.1 percent versus 8.7 percent).[16] And average monthly enrollment in Medicaid declined by 1 million people in 2019, following a Medicaid enrollment decline of 1.4 million people in 2018. The 2018 decline likely contributed to the increase in the uninsured rate for 2018, and the continuing Medicaid enrollment decline suggests the uninsured rate may have increased for 2019 as well.[17]
In any event, the CPS and ACS data in the main Census Bureau report won’t tell us anything, and other newly released Census Bureau data will tell us little, about the impact of the pandemic and the recession on health insurance coverage.[18] Significant job and income losses over the last half year are expected to result in health insurance coverage losses and increases in the ranks of the uninsured, although the availability of coverage through Medicaid and the ACA marketplaces will mitigate increases in uninsured rates. Medicaid enrollment rose 8.4 percent between February and July in 30 states for which we have data; if that increase were extrapolated nationwide, it would amount to about 6 million people.[19]
End Notes
[1] Counting both those officially unemployed and those home sick, caring for a sick relative or for a child learning remotely, or otherwise not at work because of the crisis, 61 million people were either sidelined workers or living with a family member who was, according to our analysis of the August 2020 basic monthly Current Population Survey public-use file.
[2] U.S. Department of Labor, Bureau of Labor Statistics, https://www.bls.gov; U.S. Department of Labor, Employment and Training Administration, https://oui.doleta.gov/unemploy/DataDashboard.asp.
[3] Food insecurity may have doubled overall — and tripled among households with children — in April and May 2020, according to estimates using data from the COVID Impact Survey, Current Population Survey, and other sources. Diane Schanzenbach and Abigail Pitts, “How Much Has Food Insecurity Risen? Evidence from the Census Household Pulse Survey,” Northwestern University Institute for Policy Research, June 10, 2020, https://www.ipr.northwestern.edu/documents/reports/ipr-rapid-research-reports-pulse-hh-data-10-june-2020.pdf; Diane Schanzenbach and Abigail Pitts, “Food Insecurity Triples for Families With Children During COVID-19 Pandemic,” Northwestern University Institute for Policy Research, May 13, 2020, https://www.ipr.northwestern.edu/news/2020/food-insecurity-triples-for-families-during-covid.html.
[4] Lauren Bauer, “About 14 Million Children in the US Are Not Getting Enough to Eat,” Brookings Institution, July 9, 2020, https://www.brookings.edu/blog/up-front/2020/07/09/about-14-million-children-in-the-us-are-not-getting-enough-to-eat.
[5] Census Bureau Household Pulse Survey data, Food Table 2b. Food Sufficiency for Households, in the Last 7 Days, by Selected Characteristics: United States, data collected August 19-31, 2020, https://www.census.gov/data/tables/2020/demo/hhp/hhp13.html; and Center on Budget and Policy Priorities analysis of the December 2019 Current Population Survey Food Security Supplement. Recent methodological changes to the survey mean that current Pulse data on food sufficiency are not comparable with estimates for July or earlier months.
[6] Bureau of Labor Statistics, U.S. Department of Labor, “Consumer Price Index: August 2020,” September 11, 2020, https://www.bls.gov/news.release/pdf/cpi.pdf.
[7] See, in particular, Figure 8 in CBPP, “Tracking the COVID-19 Recession’s Effects on Food, Housing, and Employment Hardships,” updated September 11, 2020, https://www.cbpp.org/research/poverty-and-inequality/tracking-the-covid-19-recessions-effects-on-food-housing-and; and National Multifamily Housing Council Rent Payment Tracker. Note that the Pulse survey changed its question regarding rental payments in August. These and other methodological changes to the survey mean that Pulse data on rent hardships are not comparable with estimates for earlier months.
[8] Arloc Sherman, “Research Note: How the Pandemic Could Skew Official Poverty Figures for 2019,” CBPP, September 8, 2020, https://www.cbpp.org/research/poverty-and-inequality/research-note-how-the-pandemic-could-skew-official-poverty-figures.
[9] Income failed to equal or surpass a previous record high in only one recovery of at least two years’ duration in the past 50 years (the recovery beginning in 2001 and ending in 2007).
[10] In addition to being a larger survey, the ACS is a more revealing survey than the CPS for comparing uninsured rates over recent years because it has had a more consistent approach to measuring health insurance coverage. The CPS changed its methodology in both 2014 and 2018. The 2019 ACS added two new survey questions regarding some aspects of private insurance but these are not expected to significantly influence its estimates of the overall uninsured rate.
[11] Congressional Budget Office, “Federal Subsidies for People Under Age 65: 2019 to 2029,” May 2019, https://www.cbo.gov/system/files/115th-congress-2017-2018/reports/53826-healthinsurancecoverage.pdf.
[12] Jennifer Haley et al., “One in Five Adults in Immigrant Families with Children Reported Chilling Effects on Public Benefit Receipt in 2019,” Urban Institute, June 18, 2020, https://www.urban.org/research/publication/one-five-adults-immigrant-families-children-reported-chilling-effects-public-benefit-receipt-2019.
[13] Centers for Medicare & Medicaid Services, “Trends in Subsidized and Unsubsidized Enrollment,” August 12, 2019, https://www.cms.gov/CCIIO/Resources/Forms-Reports-and-Other-Resources/Downloads/Trends-Subsidized-Unsubsidized-Enrollment-BY17-18.pdf.
[14] Matt Broaddus, “Research Note: Medicaid Enrollment Decline Among Adults and Children Too Large to Be Explained by Falling Unemployment,” CBPP, July 17, 2019, https://www.cbpp.org/research/health/medicaid-enrollment-decline-among-adults-and-children-too-large-to-be-explained-by.
[15] Robin Cohen et al., “Health Insurance Coverage: Early Release of Estimates from the National Health Interview Survey, 2019,” Centers for Disease Control and Prevention, September 2020, https://www.cdc.gov/nchs/data/nhis/earlyrelease/insur202009-508.pdf. The NHIS design and questionnaire were changed in 2019 to reduce respondent burden and increase response accuracy. Initial testing shows that even with these changes, 2019 estimates of the uninsured rate for non-elderly adults can be compared to comparable estimates from previous years.
[16] Sharon Stern, “Current Coverage, Calendar-Year Coverage: Two Measures, Two Concepts,” Census Bureau, September 10, 2019, https://www.census.gov/newsroom/blogs/research-matters/2019/09/current-coverage.html. Note: the Census Bureau in its Annual Social and Economic Supplement (ASEC) to the CPS asks survey respondents to report their health insurance coverage status both at the time of the survey and for the entirety of the previous calendar year. These questions are asked of one-quarter of February survey respondents, all March survey respondents, and one-quarter of April survey respondents. The Census Bureau’s annual health insurance coverage report highlights the previous full-year results, but the Census Bureau also typically publishes a separate research note featuring the current coverage results. The uninsured rate based on the results for a given month typically is higher than the rate that is based on having coverage over the full year, because some people have health insurance coverage for only part of the year.
[17] CBPP analysis using Medicaid administrative enrollment data from the Centers for Medicare & Medicaid Services. See https://www.medicaid.gov/medicaid/program-information/medicaid-and-chip-enrollment-data/report-highlights/index.html. Also see Broaddus, 2019.
[18] In addition to the main health insurance coverage report, which will highlight CPS survey respondents’ health insurance coverage status for 2019, the Census Bureau plans to release separately on September 15 a table showing survey respondents’ health insurance status at the time of the CPS interview. Interviews were conducted in February, March, and April 2020. These estimates may capture a very small portion of the initial impact of the COVID-19 recession on the number of uninsured but will not capture the full impact as loss of health insurance coverage during a recession has been shown to lag the loss of employment.
[19] Matt Broaddus, “Medicaid Enrollment Continues to Rise,” CBPP, September 9, 2020, https://www.cbpp.org/blog/medicaid-enrollment-continues-to-rise.
More from the Authors

Areas of Expertise