Research Note: Medicaid Enrollment Decline Among Adults and Children Too Large to Be Explained by Falling Unemployment
Enrollment in Medicaid and the Children’s Health Insurance Program (CHIP) fell by more than 1.7 million participants (2.3 percent) between March 2017 and March 2019, with most of this decline occurring after March 2018.[1] The enrollment changes varied widely across states, with particularly sharp declines in 13 states. While the Trump Administration has cited the improving economy as a factor, our analysis finds that it cannot explain the full national enrollment decline, nor can it explain the especially sharp enrollment declines in some states.
Medicaid and CHIP enrollment fell nationally among both children and adults.
Medicaid and CHIP enrollment fell nationally among both children and adults. Researchers at the Georgetown Center for Children and Families have called attention to the significant declines among children: 818,000 (2.3 percent) fewer children were enrolled in Medicaid or CHIP in March 2019 than two years prior. [2] (These data are available for 48 states.) What has received less notice is that Medicaid enrollment among adults also fell by 750,000 (2.1 percent) over this period.[3]
Enrollment for children and adults combined rose in 14 states but fell in 37 states, and 13 states saw sharp declines of 7 percent or more for adults (Arkansas, Colorado, Massachusetts, Ohio, Vermont, Washington, and Wyoming), children (Idaho, Missouri, New Mexico, and Utah), or both (Illinois and Mississippi). See Appendix Table 1 for state-level estimates.
The Trump Administration has argued that the enrollment declines are the byproduct of an improving economy. Centers for Medicare & Medicaid Services Administrator Seema Verma claimed “the improving economy seems to be a consistent factor [in the declines] and further analysis is warranted.”[4] We did that analysis, and it leaves us skeptical that economic conditions can explain the full decline, or the especially sharp declines in some states, for three reasons:
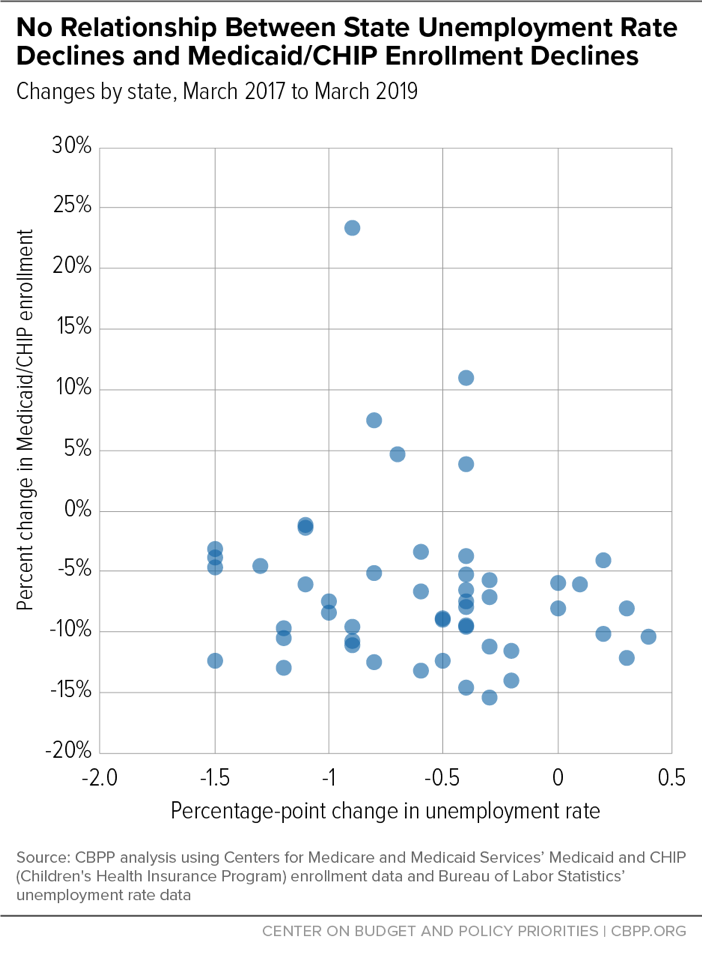
- There is no relationship between changes in states’ Medicaid and CHIP enrollment and changes in their unemployment rates over the March 2017-March 2019 period. In other words, the states with especially sharp enrollment declines did not have especially sharp unemployment declines. If anything, there is a slight negative relationship between enrollment changes and unemployment-rate changes. (See Figure 1, which shows the relationship between changes in unemployment rates and in total Medicaid/CHIP enrollment.) The conclusion holds for both child and adult enrollment, for both expansion and non-expansion states, and if one examines the relationship between enrollment and the employment-to-population ratio rather than the unemployment rate.
- The decline in Medicaid and CHIP enrollment nationally appears too large to be explained by changes in economic conditions. Not since 1978-1979 has the percentage reduction in Medicaid enrollment been so large over a two-year period.[5] Historically, Medicaid enrollment tends to grow more slowly but not decline during a period of economic growth, and neither the Congressional Budget Office nor the Medicaid Office of the Actuary projected Medicaid enrollment declines in 2017 or 2018, despite anticipating a growing economy.[6] Moreover, the recent enrollment decline among children over the 2017-2019 period is more than three times what would be expected based on the unemployment-rate decline and modeling that isolates the impact of the unemployment on children’s Medicaid enrollment.[7]
- Early estimates from the Centers for Disease Control and Prevention show that the uninsured rate rose between 2016 and 2018.[8] In particular, these data suggest (though they do not conclusively show) that uninsured rates rose for non-elderly people with incomes below 200 percent of the poverty line. If Medicaid and CHIP enrollment were falling primarily because more people were gaining employment-based coverage due to a stronger economy, uninsured rates among low-income people should not have risen.
Our findings suggest that the reasons behind the recent Medicaid and CHIP enrollment declines are more complicated and warrant concern and further investigation. The causes likely vary across states. In Arkansas, for example, Medicaid enrollment between March 2017 and March 2019 fell only among adults, partly due to coverage losses from the work requirement the state imposed on certain adult beneficiaries starting in June 2018.[9] Many eligible adults struggled to meet the new reporting and verification requirements due to the state’s inadequate reporting systems and other factors. Beneficiaries in other states also encountered challenges related to eligibility systems and policies that increased red tape and contributed to enrollment reductions. Furthermore, many families lost eligibility when they didn’t have enough time to respond to requests to prove their income or don’t receive important notices.[10]
Even without knowing all of the reasons for recent enrollment declines, state and federal policymakers can take steps to help eligible people enroll and stay enrolled. These include reinvesting in outreach and consumer assistance, rejecting waivers that take coverage away from adults not meeting work requirements, streamlining enrollment and renewal processes, and using data matching to reduce burdens on people applying for or renewing coverage. Unfortunately, the Trump Administration is heading in the opposite direction: discouraging states from expanding Medicaid; encouraging them to impose new eligibility barriers; and planning new regulations that would increase burdens on Medicaid participants, including allowing states to require more frequent eligibility assessments.[11]
| APPENDIX TABLE 1 | |||||||
|---|---|---|---|---|---|---|---|
| Changes in Medicaid/CHIP Enrollment and Unemployment Rate, March 2017 to March 2019 | |||||||
| Medicaid/CHIP enrollment, all ages | Medicaid/CHIP enrollment, children | Medicaid/CHIP enrollment, adults | Unemploy-ment rate, % point change |
||||
| State | Number change | Percent change | Number change | Percent change | Number change | Percent change | |
| United States | -1,736,784 | -2.3 | -818,577 | -2.3 | -750,458 | -2.1 | -0.8 |
| Missouri | -102,639 | -10.5 | -81,434 | -12.8 | -21,205 | -6.2 | -0.3 |
| Illinois | -297,415 | -9.6 | -101,466 | -7.1 | -195,949 | -11.8 | -0.4 |
| Mississippi | -61,733 | -9.0 | -39,550 | -8.6 | -22,183 | -10.0 | -0.2 |
| Idaho | -24,408 | -8.3 | -19,487 | -9.1 | -4,921 | -6.0 | -0.6 |
| Vermont | -13,694 | -8.0 | -2,797 | -4.3 | -10,897 | -10.4 | -1.2 |
| Tennessee | -117,291 | -7.5 | no data | no data | no data | no data | -0.8 |
| Utah | -23,187 | -7.5 | -25,298 | -11.5 | 2,111 | 2.3 | -0.5 |
| New Mexico | -58,250 | -7.4 | -31,896 | -8.8 | -26,354 | -6.2 | -1.5 |
| Colorado | -99,444 | -7.2 | -42,918 | -6.8 | -56,526 | -7.4 | 0.3 |
| Arkansas | -60,503 | -6.6 | 11,196 | 2.7 | -71,699 | -14.5 | -0.2 |
| West Virginia | -35,034 | -6.2 | -13,928 | -6.1 | -21,106 | -6.3 | -0.3 |
| Wyoming | -3,800 | -6.2 | 444 | 1.2 | -4,244 | -18.1 | -0.9 |
| Massachusetts | -95,399 | -5.7 | 11,901 | 1.8 | -107,300 | -10.7 | -0.9 |
| Ohio | -156,246 | -5.6 | -9,735 | -0.8 | -146,511 | -8.9 | -1.2 |
| Hawaii | -18,908 | -5.4 | -5,783 | -4.0 | -13,125 | -6.5 | 0.4 |
| Washington | -95,294 | -5.3 | -19,977 | -2.4 | -75,317 | -7.8 | 0.2 |
| Oklahoma | -38,493 | -4.7 | -24,877 | -4.7 | -13,616 | -4.9 | -1.2 |
| Florida | -203,716 | -4.7 | -153,493 | -5.9 | -50,223 | -2.9 | -0.9 |
| New Hampshire | -8,803 | -4.6 | -3,663 | -3.9 | -5,140 | -5.3 | -0.4 |
| Washington, D.C. | -12,231 | -4.5 | no data | no data | no data | no data | -0.4 |
| California | -502,598 | -4.1 | -274,023 | -5.2 | -228,575 | -3.2 | -0.5 |
| New Jersey | -70,849 | -3.9 | -28,981 | -3.4 | -41,868 | -4.4 | -0.5 |
| Texas | -166,611 | -3.5 | -155,069 | -4.4 | -11,542 | -0.9 | -1.0 |
| Kansas | -12,356 | -3.1 | -6,821 | -2.5 | -5,535 | -4.6 | 0.0 |
| Indiana | -46,995 | -3.1 | 2,302 | 0.3 | -49,297 | -6.9 | 0.3 |
| South Dakota | -3,628 | -3.0 | -3,955 | -4.8 | 327 | 0.9 | -0.4 |
| Maine | -6,774 | -2.5 | -6,707 | -5.9 | -67 | 0.0 | -0.4 |
| Kentucky | -31,109 | -2.5 | -4,424 | -0.8 | -26,685 | -3.9 | -1.0 |
| Arizona | -38,227 | -2.2 | no data | no data | no data | no data | -0.3 |
| Wisconsin | -17,626 | -1.7 | 9,182 | 1.9 | -26,808 | -4.8 | -0.6 |
| North Dakota | -1,479 | -1.6 | -421 | -1.0 | -1,058 | -2.1 | -0.4 |
| Oregon | -10,971 | -1.1 | -5,171 | -1.2 | -5,800 | -1.0 | 0.1 |
| Rhode Island | -3,364 | -1.1 | 1,878 | 1.6 | -5,242 | -2.8 | -1.1 |
| Minnesota | -11,277 | -1.1 | 5,357 | 1.0 | -16,634 | -3.1 | 0.0 |
| Michigan | -19,468 | -0.8 | -1,657 | -0.2 | -17,811 | -1.3 | -0.3 |
| North Carolina | -5,222 | -0.3 | 27,873 | 1.9 | -33,095 | -5.1 | -0.4 |
| South Carolina | -1,456 | -0.1 | 1,735 | 0.3 | -3,191 | -0.8 | -0.8 |
| Nevada | 1,756 | 0.3 | 581 | 0.2 | 1,175 | 0.4 | -1.5 |
| Pennsylvania | 11,399 | 0.4 | 3,699 | 0.3 | 7,700 | 0.5 | -1.3 |
| Nebraska | 2,202 | 0.9 | 2,417 | 1.5 | -215 | -0.3 | 0.2 |
| Louisiana | 15,273 | 1.1 | -44,533 | -5.9 | 59,806 | 8.7 | -1.5 |
| Maryland | 15,813 | 1.2 | 11,102 | 1.8 | 4,711 | 0.7 | -0.4 |
| New York | 98,235 | 1.5 | 29,219 | 1.2 | 69,016 | 1.7 | -0.6 |
| Delaware | 4,298 | 1.8 | -53 | -0.1 | 4,351 | 3.1 | -1.5 |
| Georgia | 63,714 | 3.6 | 13,337 | 1.1 | 50,377 | 9.6 | -1.1 |
| Alabama | 33,290 | 3.8 | 28,079 | 4.5 | 5,211 | 2.0 | -1.1 |
| Montana | 22,525 | 8.8 | 775 | 0.6 | 21,750 | 16.8 | -0.4 |
| Iowa | 60,673 | 9.6 | 27,512 | 8.9 | 33,161 | 10.2 | -0.7 |
| Connecticut | 95,717 | 12.4 | 35,128 | 11.6 | 60,589 | 12.9 | -0.8 |
| Alaska | 29,972 | 16.0 | 8,290 | 9.4 | 21,682 | 21.7 | -0.4 |
| Virginia | 284,847 | 28.3 | 57,533 | 8.6 | 227,314 | 67.2 | -0.9 |
End Notes
[1] All estimates are based on administrative enrollment data collected from the states by the Centers for Medicare & Medicaid Services (CMS) and made publicly available (see https://www.medicaid.gov/medicaid/program-information/medicaid-and-chip-enrollment-data/index.html). March 2019 is the most recent month for which CMS has collected final total Medicaid enrollment data for each state and the District of Columbia. We adjust overall and adult enrollment data for Texas because the state altered the way it reports enrollment data for adults over the time period of our analysis. Specifically, we assume that the entire enrollment decline in the month (June 2017) in which the state changed its reporting method was attributable to the reporting change. This likely results in a slightly conservative estimate of Texas’ total enrollment decline.
[2] Tricia Brooks, Edwin Park, and Lauren Roygardner, “Medicaid and CHIP Enrollment Decline Suggests the Child Uninsured Rate May Rise Again,” Georgetown Center for Children and Families, May 2019, https://ccf.georgetown.edu/wp-content/uploads/2019/06/Enrollment-Decline.pdf.
[3] The enrollment-reduction figures for children and adults cited here add to less than the 1.7 million overall figure cited above because data disaggregated by age are available for only 48 states, while the overall data are available for all states.
[4] See https://twitter.com/SeemaCMS/status/1121478298561912832.
[5] “MACStats: Medicaid and CHIP Data Book,” Medicaid and CHIP Payment and Access Commission, December 2018, https://www.macpac.gov/wp-content/uploads/2018/12/December-2018-MACStats-Data-Book.pdf. See Exhibit 10 for a complete history of Medicaid enrollment trends.
[6] Brooks, Park, and Roygardner, op. cit.
[7] John Holahan and Bowen Garrett, “Rising Unemployment, Medicaid and the Uninsured,” Kaiser Family Foundation and the Urban Institute, January 2009, https://www.kff.org/wp-content/uploads/2013/03/7850.pdf. The authors find that Medicaid enrollment among children can be expected to rise by 0.79 percentage points for every 1 percentage-point increase in the unemployment rate, after controlling for all other factors that affect Medicaid enrollment among children. We assume, based on the method of the study, that every 1 percentage-point decline in the unemployment rate would cause Medicaid enrollment among children to fall by 0.79 percentage points. We then apply this finding to the actual unemployment-rate decline between February 2017 and February 2019 to estimate the Medicaid enrollment decline among children based on this decline.
[8] Robin Cohen, Emily Terlizzi, and Michael Martinez, “Health Insurance Coverage: Early Release of Estimates from the National Health Interview Survey, 2018,” Centers for Disease Control and Prevention, May 2019, https://www.cdc.gov/nchs/data/nhis/earlyrelease/insur201905.pdf.
[9] Jennifer Wagner, “Commentary: As Predicted, Arkansas’ Medicaid Waiver Is Taking Coverage Away from Eligible People,” Center on Budget and Policy Priorities, June 28, 2019, https://www.cbpp.org/health/commentary-as-predicted-arkansas-medicaid-waiver-is-taking-coverage-away-from-eligible-people.
[10] “Editorial: Medicaid Eligibility Crackdown Pushes Out Genuinely Needy Missouri Families,” St. Louis Post-Dispatch, February 14, 2019, https://www.stltoday.com/opinion/editorial/editorial-medicaid-eligibility-crackdown-pushes-out-genuinely-needy-missouri-families/article_f80939f4-ef45-5606-9b8b-ddb2b3819bf3.html.
[11] Hannah Katch et al., “Health Proposals in President’s 2020 Budget Would Reduce Health Insurance Coverage and Access to Care,” Center on Budget and Policy Priorities, April 19, 2019, https://www.cbpp.org/research/health/health-proposals-in-presidents-2020-budget-would-reduce-health-insurance-coverage.
More from the Authors