Research Note: How the Pandemic Could Skew Official Poverty Figures for 2019
Figures due out on September 15 will likely show that official poverty fell in 2019, reflecting that year’s still healthy economy. The figures will likely exaggerate the improvement, however, because of the way COVID-19 interfered with collecting the poverty data. The Census Bureau’s Current Population Survey (CPS), the source of the figures, was underway when the pandemic hit, causing the Bureau to lose contact with thousands of interviewees, especially people with lower incomes.
"The Census Bureau’s Current Population Survey, the source of the figures, was underway when the pandemic hit, causing the Bureau to lose contact with thousands of interviewees."
These pandemic-related effects could artificially lower the estimated number of people in poverty by roughly 1 million people, and the estimated poverty rate by about 0.3 percentage points, our analysis suggests.
Pandemic Lowered CPS Participation in Crucial Months
Official U.S. poverty figures come from CPS’ Annual Social and Economic Supplement (ASEC). The basic monthly CPS, which the Census Bureau conducts year-round for the Labor Department, is the source of unemployment rates and other labor force data. Every February, March, and April, the ASEC adds a detailed set of questions to the CPS that are the main source of national statistics on household income and poverty, as well as health insurance and other topics. The latest CPS ASEC will provide data on poverty in 2019.
The pandemic hit as the ASEC was getting underway. ASEC interviews began in February but most interviews (about 5 in 6) were planned for the weeks of March 15 and April 19. The President declared the pandemic a national emergency on March 13 and the Census Bureau suspended in-person interviews and shut centralized call centers on March 20 for safety reasons. Census staff shifted largely to phoning respondents from home and reaching out online.
Cautioning data users that the virus affected CPS operations, the Labor Department noted: “The household survey response rate, at 73 percent, was about 10 percentage points lower [in March] than in recent months,” and 13 points lower in April.[1]
The basic monthly CPS included data on some 49,000 households in February 2020 but this dropped to 43,000 (an 11 percent decline) in March and 42,000 (14 percent) in April as response rates fell, our analysis shows. The declines suggest that the participation rate for the ASEC sample that Census will release on September 15 (which will combine the March file with portions of February’s and April’s[2]) could decline about 10 percent.
Participation Fell More for Lower-Income People
In any given month, three-fourths of households in the basic monthly CPS are scheduled to be re-interviewed the next month. From February to March, Census was unable to re-interview more than 4,000 households as scheduled, who as a group were poorer than their successfully re-interviewed peers. Specifically, our analysis shows:[3]
- Of the 4,000-plus households missing in the March survey, 18.1 percent reported annual family income below $20,000 (in the February survey).
- This compares with 14.1 percent among the 32,000 households interviewed in both months.
- Census was unable to re-interview about 14 percent of households making below $20,000 in March, compared with 11 percent of households making $20,000 or more.
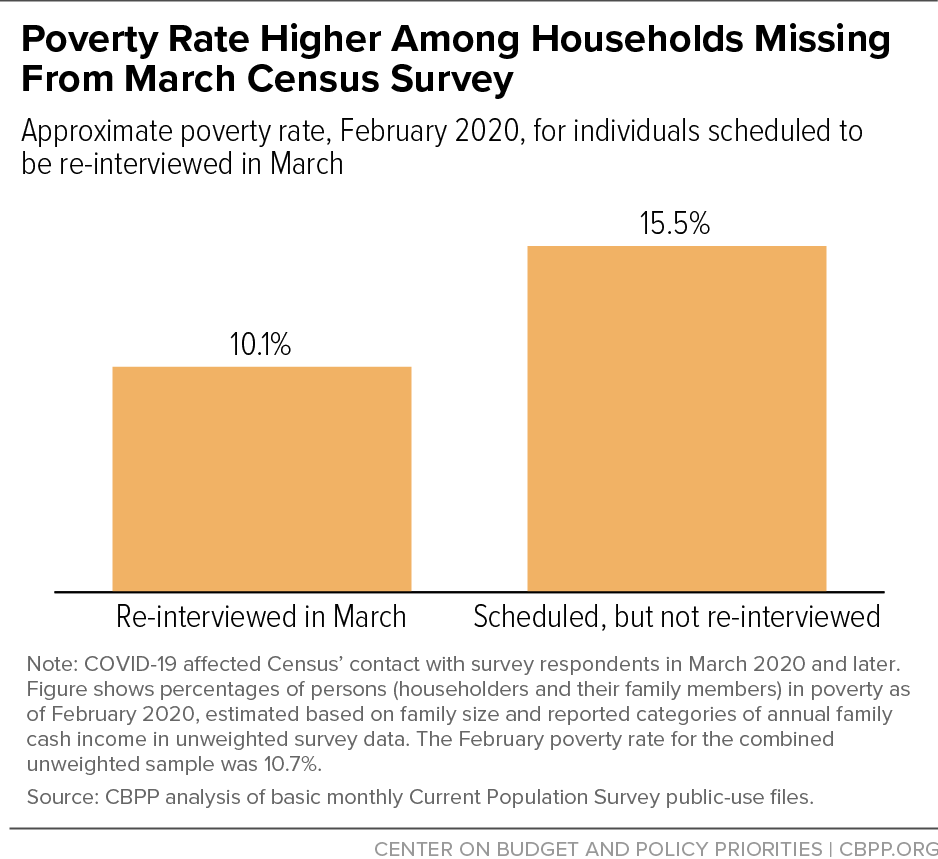
We can calculate a crude poverty rate in the monthly CPS by using the limited income data available (a single question in which respondents describe their family income in rough categories such as $20,000 to $24,999) and comparing it to the closest official poverty threshold for the family’s size.[4] Doing so shows that:
- Of individuals (interviewees and their family members) living at addresses that were missing from the March survey data, 15.5 percent had annual family income below a crude poverty line in February. (See Figure 1.)
- This is 5.4 percentage points above the rate for those living at addresses successfully surveyed in both months (10.1 percent).
Lost Participants Could Lower Poverty Estimates by Roughly 1 Million
The impact of falling participation on the Census Bureau’s official poverty estimates will likely be smaller than is implied by these contrasts. The Census Bureau does not report raw survey results but adjusts (“weights”) them by race, state, age, and other characteristics to match separately estimated population targets. This process, which produces nationally representative results, should help reduce distortions caused by missing households to the degree those distortions are tied to characteristics like race and state.
Even after adjusting for these sorts of demographic factors in our own calculations, however, our data indicate that those whom Census missed in the March survey had February poverty rates approximately 3.3 percentage points higher than those whom it successfully interviewed.[5]
Combining this finding of a roughly 3-percentage-point higher poverty rate with our earlier calculation that about one-tenth of participants were missed suggests that the omission of these individuals could artificially lower the CPS-based poverty estimate for 2019 by around 0.3 percentage points, equivalent to about 1 million people.
Coming American Community Survey Results Will Not Have This Problem
Poverty data from the Census Bureau’s American Community Survey (ACS) — scheduled for release September 17, two days after the CPS results — will provide another estimate of poverty in 2019. [6] Unlike the CPS, the pandemic won’t influence the ACS findings because the ACS completed its data collection for 2019 prior to the shutdown.
The ACS poverty data may be helpful in understanding how poverty changed in 2019, at least among the non-elderly.[7]
End Notes
[1] Bureau of Labor Statistics, “The Employment Situation — March 2020,” https://www.bls.gov/news.release/archives/empsit_04032020.pdf; Bureau of Labor Statistics, “The Employment Situation — April 2020,” https://www.bls.gov/news.release/archives/empsit_05082020.pdf.
[2] By design, the ASEC includes all CPS households in March but only about one-fourth of those in February and April. U.S. Bureau of the Census, Current Population Survey 2019 Annual Social and Economic Supplement (ASEC) Technical Documentation, p. 2-2.
[3] The monthly CPS includes a single question about approximate annual family income. This one question is not as thorough or precise as the long battery of income topics and probing follow-up questions in the ASEC questionnaire, and is not widely used by analysts, but it permits rough comparisons between groups of households. Census has not yet released the ASEC data but it released the monthly CPS data including the single income question earlier this year.
Figures in bullets use unweighted survey data so are not nationally representative.
[4] For example, Census’ preliminary weighted-average official poverty thresholds for 2019 are $13,016 for a one-person family unit and $26,167 for a family of four. Using the rough income categories in the monthly CPS, we classify a householder with no relatives as poor if their income is below $12,500 and below $25,000 for a family of four. We exclude persons not related to the householder. Although this method is rough, it yields an overall poverty rate for householders and family members of 10.7 percent in the unweighted February 2020 data, similar to the rate of 10.9 percent in the 2019 ASEC. Note that the purpose of this rough poverty calculation is not to provide an accurate prediction of poverty for 2019 but to help illustrate how far off base the official poverty rate could be because of the pandemic.
For preliminary official 2019 thresholds, see: https://www2.census.gov/programs-surveys/cps/tables/time-series/historical-poverty-thresholds/19preliminary.xls. For the 2019 ASEC, see: https://www2.census.gov/programs-surveys/cps/tables/pov-01/2019/pov01_100_1.xls.
[5] The analysis (a weighted linear regression) adjusts for several characteristics that the Census Bureau has previously considered when weighting the CPS, namely, whether an individual is Black, Hispanic, female, under age 1, ages 1-15, 16-44, 45-64, or 65 years and older, their state of residence, or whether they live in the Los Angeles metropolitan area or in New York City. The results do not appear to be sensitive to variations such as including additional race categories, other age groupings, the type of metro or non-metro residence, or interactions between these factors. For more on CPS weighting adjustments, see https://www.census.gov/programs-surveys/cps/technical-documentation/methodology/weighting.html, revised August 13, 2015, and https://www.census.gov/prod/2006pubs/tp-66.pdf.
[6] The CPS and ACS have different strengths. In most years, Census guidance favors the CPS for national income and poverty statistics because it includes many additional detailed questions about income and family composition not included in the ACS, while favoring the ACS for state and local poverty data because its large size makes it less subject to random sampling error for small populations. Similarly, the ACS can be useful for telling whether relatively small changes from year to year are statistically meaningful.
The CPS income data are also slightly more up-to-date, insofar as the CPS always asks households about the past calendar year (in this case, 2019). By contrast, the ACS surveys Americans year-round and asks about their income in the past 12 months, so interviews conducted early in the “2019” ACS will refer mostly to income received in 2018, while data collected later in the year will refer mostly to 2019, yielding data that span both 2018 and 2019.
[7] Although the pandemic didn’t influence ACS data for this year, the ACS will have a different problem: Census changed its questionnaire in order to better measure income from private retirement, disability, and survivor pensions. The wording change could hinder poverty comparisons between 2018 and 2019 ACS data, particularly for the elderly. The change should have a much smaller effect on ACS trends for the non-elderly.
More from the Authors
