Upcoming Census Estimates Expected to Show Historic Gains in Health Coverage
On September 16, the Census Bureau is scheduled to issue estimates of health coverage in 2014 based on its annual Current Population Survey (CPS) and American Community Survey (ACS), the most authoritative and widely used sources of coverage information at the national and state levels, respectively. This will be the first evidence from these sources of the effects of the Affordable Care Act’s (ACA) major coverage expansions, which took effect starting January 1, 2014. Data already available for 2014 from other public and private surveys, however, suggest that the Census data will show historic coverage gains.
The number of uninsured fell by nearly 9 million in 2014, nearly four times more than in any previous year.
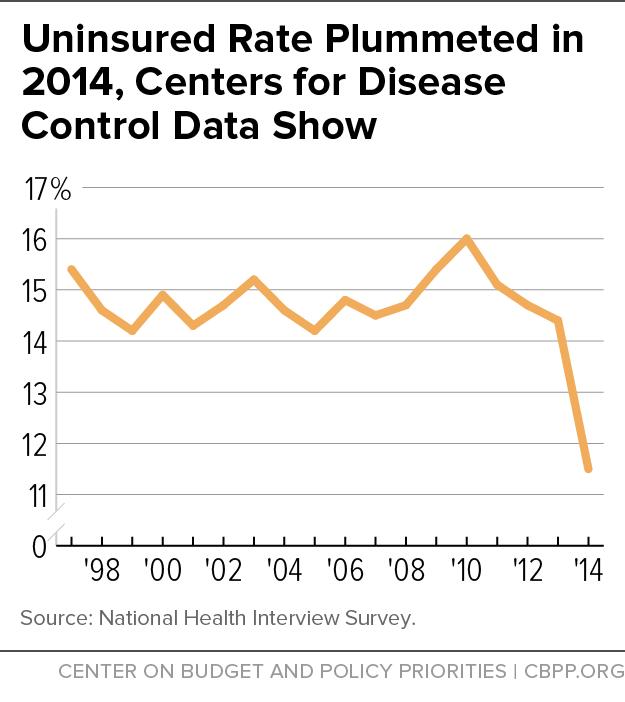
For example, preliminary results from the Centers for Disease Control and Prevention’s National Health Interview Survey (NHIS) show that both the share (11.5 percent) and number (36.0 million) of Americans without health coverage in 2014 were the lowest on record. The number of uninsured fell by nearly 9 million in 2014, nearly four times more than in any previous year. These coverage gains resulted from significant increases in both private and public health coverage, these data show.[1]
Private surveys conducted by the Urban Institute, RAND, the Commonwealth Fund, and Gallup all also show that the share of Americans without coverage declined substantially in 2014. For example, the share of adults aged 18-64 without insurance fell from 17.7 percent to 12.8 percent — reflecting a reduction of 9.7 million uninsured people — between September 2013 and December 2014, according to survey results from the Urban Institute’s Health Reform Monitoring Study.[2]
Moreover, just-released NHIS data from the CDC, as well as the most recent private survey data, show continued reductions in the number of uninsured in 2015. For example, the Urban Institute finds that the share of non-elderly adults without coverage fell another 2.7 percentage points in the first quarter of 2015, to 10.1 percent.[3] Overall, there are about 15 million fewer uninsured non-elderly adults than in September 2013, the Urban Institute data show.
CPS Data Will Permit Comparisons to 2013, But ACS Needed for Earlier Years
The 2014 estimates from the Census Bureau’s Current Population Survey will be based on the same survey questions as were used for the 2013 survey data, which incorporated question changes to improve the reliability and accuracy of the CPS health coverage estimates. These changes, which the Census Bureau worked on for years, have also strengthened the CPS’ ability to accurately measure enrollment in coverage from new sources such as subsidized marketplace coverage under the ACA.a
Prior to the 2013 survey data, the CPS asked respondents to report their source of health coverage over the previous calendar year. The Census Bureau concluded, however, that the results of these questions reflected some mixture of point-in-time estimates and entire-year estimates, due to respondents’ misinterpretation of the question.b That is, when asked about their coverage, some respondents indicated their coverage status at the time they were asked rather than whether they had coverage for the entire year.
Starting last year, the CPS asks about the respondent’s source of coverage at the time of the interview and then asks additional questions to determine whether that coverage had changed over the previous 12 to 15 months (depending on the month the interview is conducted). This allows the Census Bureau to generate accurate coverage estimates on both a point-in-time and entire-year basis, as well as to estimate how long respondents retain a particular source of coverage.
The CPS estimates for 2014 thus will be directly comparable to the Census Bureau’s 2013 estimates released last year, and analysts will be able to measure accurately the effects of the ACA’s major coverage expansions that took effect in 2014, including the Medicaid expansion to low-income adults and subsidized private marketplace coverage for low- and moderate-income families.
But because of the change in CPS questions starting in 2013, a historical comparison of 2014 CPS data to CPS data for any year before 2013 is not possible. Fortunately, the Census’ ACS has not changed its health insurance questions, so the ACS data can be substituted for the CPS in making historical comparisons of the 2014 data to data for years back to 2008, when Census first added health insurance questions to the ACS.
a For further information on the Census Bureau survey changes, please see Matt Broaddus and Edwin Park, “Understanding the Census Bureau’s Upcoming Health Insurance Coverage Estimates,” Center on Budget and Policy Priorities, September 11, 2014, https://www.cbpp.org/research/understanding-the-census-bureaus-upcoming-health-insurance-coverage-estimates.
b Census Bureau, “Income, Poverty, and Health Insurance Coverage in the United States: 2005,” August 2006, http://www.census.gov/prod/2006pubs/p60-231.pdf.
Other Surveys Provide Clues About Forthcoming Census Data
Preliminary results from the NHIS indicate what the upcoming CPS estimate of the change in health coverage may show for 2014. They indicate that the share of Americans without health coverage fell from 14.4 percent in 2013 to 11.5 percent in 2014. This 2.9 percentage-point decline is more than three times the magnitude of any previous single-year decline.
The 2014 NHIS data also reveal several other trends that the forthcoming CPS and ACS data will likely reflect:
-
Since the ACA began to take effect, the share of Americans without health coverage has fallen substantially. The uninsured rate fell from a peak of 16.0 percent in 2010 to 11.5 percent in 2014, according to the NHIS data. The number of uninsured fell by 12.6 million, or nearly 26 percent, in 2014 (with additional gains in 2015, as discussed before).
The decline has been especially significant among young adults, who since 2010 have been able to stay on their parents’ private insurance plans up to age 26. Their uninsured rate fell by more than 40 percent between 2010 and 2014, from 33.9 percent to 20.0 percent.
The major ACA coverage expansions that first took effect in 2014 extended coverage gains more broadly to older adults and children, as well.
-
Both private and public health coverage grew in 2014. Between 2013 and 2014, the share of Americans with public coverage rose from 33.8 percent to 34.6 percent, while the share with private coverage rose from 59.5 percent to 61.8 percent, according to the NHIS data. The year 2014 was the first since NHIS data were first collected in 1997 in which both public and private coverage grew by statistically significant amounts. This reflects the impact of the ACA’s two major coverage expansions in 2014: the Medicaid expansion and subsidies for purchase of private coverage through the new health insurance marketplaces.
-
Coverage rates differ significantly among states. States that have adopted the ACA’s Medicaid expansion had lower uninsured rates in 2014 than other states. The gap between the two groups of states grew from 4.3 percentage points to 6.3 percentage points between 2013 and 2014, as expansion states reduced their uninsured rate by twice as much as non-expansion states.
-
Coverage gains among poor adults would have been much larger if more states had adopted the ACA Medicaid expansion. The uninsured rate among poor adults fell from 39.3 percent in 2013 to 32.3 percent in 2014 — an 18 percent reduction. While this was the biggest coverage gain for this group since the data began to be collected in 1997, it would have been more than twice as large if every state had adopted the Medicaid expansion. So far, 28 states and the District of Columbia have expanded Medicaid.
Public coverage is particularly important for poor Americans, 46.6 percent of whom were enrolled in public coverage in 2014, the NHIS estimates show. Low-income workers are much less likely to be offered and enroll in employer-sponsored coverage than higher-income workers.
-
Significant coverage gains accrued across population sub-groups. The NHIS data provide health coverage estimates across a wide array of demographic characteristics, including gender, age, family income, working status, and race/ethnicity. Among every such group, the uninsured rate fell by at least 15 percent in 2014.
Certain groups experienced larger gains. The share of African Americans without coverage fell by 29 percent in 2014, from 24.9 percent in 2013 to 17.7 percent last year. People living in the West and those in the income range qualifying for premium subsidies in the new insurance marketplaces experienced similarly large reductions.
CDC and Other Private Surveys Show Further Coverage Gains in 2015
The Census data to be released September 16 will not include coverage estimates for 2015[4] and thus won’t fully reflect the current coverage landscape. However, preliminary 2015 data from the CDC’s NHIS and two independent surveys provide a good indication of the most recent coverage trends. Each survey indicates that the Medicaid expansion and subsidized marketplace coverage continue to fuel further substantial reductions in the ranks of the uninsured.
- NHIS data show that the uninsured rate fell from 11.5 percent in 2014 to 9.2 percent in the first quarter of 2015. The number of uninsured Americans fell from 36 million to 29 million, with these gains coming on top of the 8.8 million-person decline between 2013 and 2014. Since the implementation of the ACA’s major coverage expansions in January 2014, the number of uninsured has declined by 15.8 million people, or more than 35 percent.[5]
- Data from the Urban Institute’s Health Reform Monitoring Survey show that the uninsured rate among adults aged 18-64 fell from 17.9 percent to 12.8 percent between the third quarter of 2013 and the fourth quarter of 2014 and then decreased further to 10.1 percent in the first quarter of 2015. Overall, that translates into a decline in the number of uninsured non-elderly adults of 15 million, with more than 5 million coming in the first quarter of 2015, based on Census population estimates.[6]
- Poll results from the Gallup-Healthways Well-Being Index show that the share of adults (including those aged 65 and above) without coverage fell from 18.0 percent to 13.4 percent between the third quarter of 2013 and the second quarter of 2014 and then further to 11.7 percent in the first half of 2015. That’s the lowest uninsurance rate since Gallup and Healthways began tracking this information in 2008.[7] This would mean the number of uninsured declined from 42.6 million to 29.0 million over that period.
End Notes
[1] Robin Cohen and Michael Martinez, “Health Insurance Coverage: Early Release of Estimates from the National Health Interview Survey, 2014,” Centers for Disease Control and Prevention, June 2015, http://www.cdc.gov/nchs/data/nhis/earlyrelease/insur201506.pdf.
[2] Sharon Long et al., “QuickTake: Taking Stock: Health Insurance Coverage Under the ACA as of December 2014,” Urban Institute, March 2015, http://hrms.urban.org/quicktakes/Health-Insurance-Coverage-under-the-ACA-as-of-December-2014.html.
[3] Sharon Long et al., “Gains in Health Insurance Coverage Under the ACA as of March 2015,” Urban Institute, April 2015, http://hrms.urban.org/briefs/Gains-in-Health-Insurance-Coverage-under-the-ACA-as-of-March-2015.html.
[4] While the new CPS health insurance point-in-time question (see box) was asked of respondents in February, March, and April 2015, the Census Bureau is unlikely to make those data available in its main report because they have not yet been subjected to the Bureau’s technical assessments of the data it collects. The ACS is conducted throughout the previous year, and the new results will reflect blended point-in-time coverage estimates for various points in time during calendar year 2014.
[5] Robin Cohen and Michael Martinez, “Health Insurance Coverage: Early Release of Estimates from the National Health Interview Survey, January-March 2015,” Centers for Disease Control and Prevention, August 2015, http://www.cdc.gov/nchs/data/nhis/earlyrelease/insur201508.pdf.
[6] Sharon Long et al., April 2015.
[7] Dan Witters, “In U.S., Uninsured Rates Continue to Drop in Most States,” Gallup, August 2015, http://www.gallup.com/poll/184514/uninsured-rates-continue-drop-states.aspx.
More from the Authors

Areas of Expertise