

Health Insurance Premium Spikes Imminent as Tax Credit Enhancements Set to Expire
Enhancements to premium tax credits, enacted in the American Rescue Plan and extended by the Inflation Reduction Act, are helping more than 20 million people afford health coverage in the Affordable Care Act (ACA) marketplaces. The enhancements helped spur a doubling of enrollment in the ACA marketplaces and contributed to record-low uninsured rates but are set to expire at the end of 2025. And marketplace enrollees are already starting to see the impact: insurers have finalized their 2026 premium rates, enrollees can see their 2026 premiums on marketplace websites, and open enrollment will be underway November 1. If Congress waits until the end of the year to extend the enhancements, 1.5 million more people will be uninsured in 2026 compared to an earlier extension, the Congressional Budget Office (CBO) estimates.[1]
Congress can still protect people from cost increases due to the end of the enhancements — which will exceed $1,000 annually for the average enrollee receiving premium tax credits, and many times that for some people — and minimize the number who are left uninsured by extending the enhancements as soon as possible. Since Congress has not acted sooner and many enrollees likely have already experienced sticker shock and decided not to enroll, it should also extend the open enrollment period (scheduled to end January 15 in most states) to give people more time to sign up. Appendix 2 provides state-by-state data on the premium increases if the enhancements expire.
The megabill Republicans enacted in July and a marketplace regulation the Trump Administration finalized in June will already create new barriers to marketplace enrollment and raise people’s out-of-pocket costs.[2] If Congress allows the premium tax credit enhancements to expire, nearly all marketplace enrollees will face significantly higher premium costs, which will more than double on average, and 3.8 million more people will be uninsured in 2035.[3] Congress should make the enhancements permanent so that families have stability and predictability when it comes to their access to affordable health insurance.
Premium Costs Will More Than Double on Average if Enhancements Expire
A record 93 percent of marketplace enrollees, or over 20 million people, receive premium tax credits (PTCs).[4] These tax credits provide upfront financial assistance to help people afford the individual or family health insurance plans offered in their state through the ACA marketplaces.[5]
The PTC enhancements help these enrollees by:
- lowering the caps on the share of income that people at all income levels pay in premiums;
- allowing people with incomes between 100 and 150 percent of the poverty level (roughly $16,000 to $23,000 for an individual) to pay $0 in premiums for “benchmark” silver-level plans; and
- extending eligibility for PTCs to people with incomes above 400 percent of poverty (roughly $63,000 for an individual) if their benchmark premiums would exceed 8.5 percent of household income.
Without the PTC enhancements, the amount the average enrollee receiving PTCs pays in premiums out of pocket will more than double, rising by more than $1,000 a year.[6]
Enhancements Spurred Record Coverage, Especially Among Black and Latino People and Families With Lower Incomes
By making health insurance more affordable, the PTC enhancements have helped more people afford marketplace coverage: 23.4 million were enrolled as of February 2025, up from 11.2 million in February 2021, prior to the enhancements. Some 21.8 million of them receive tax credits to help pay for their coverage, more than double the 9.7 million who received tax credits in February 2021.[7] (See Figure 1.) Thanks in large part to the PTC enhancements, gains in marketplace enrollment offset much of the 2024 decline in Medicaid enrollment due to the unwinding of the pandemic-related provision that temporarily kept Medicaid enrollees covered.[8]

The PTC enhancements have been especially critical for increasing enrollment among Black and Latino people. People of color made up 54 percent of marketplace enrollees in 2024, up from 46 percent in 2021. Between 2021 and 2024, marketplace enrollment among Black and Latino people grew by 186 percent and 158 percent, respectively, compared to 63 percent for other racial and ethnic groups.[9] Marketplace enrollment rates of Asian American people have long been higher than other racial and ethnic groups, potentially due to robust and language-specific enrollment assistance among nonprofits and insurance brokers.[10]
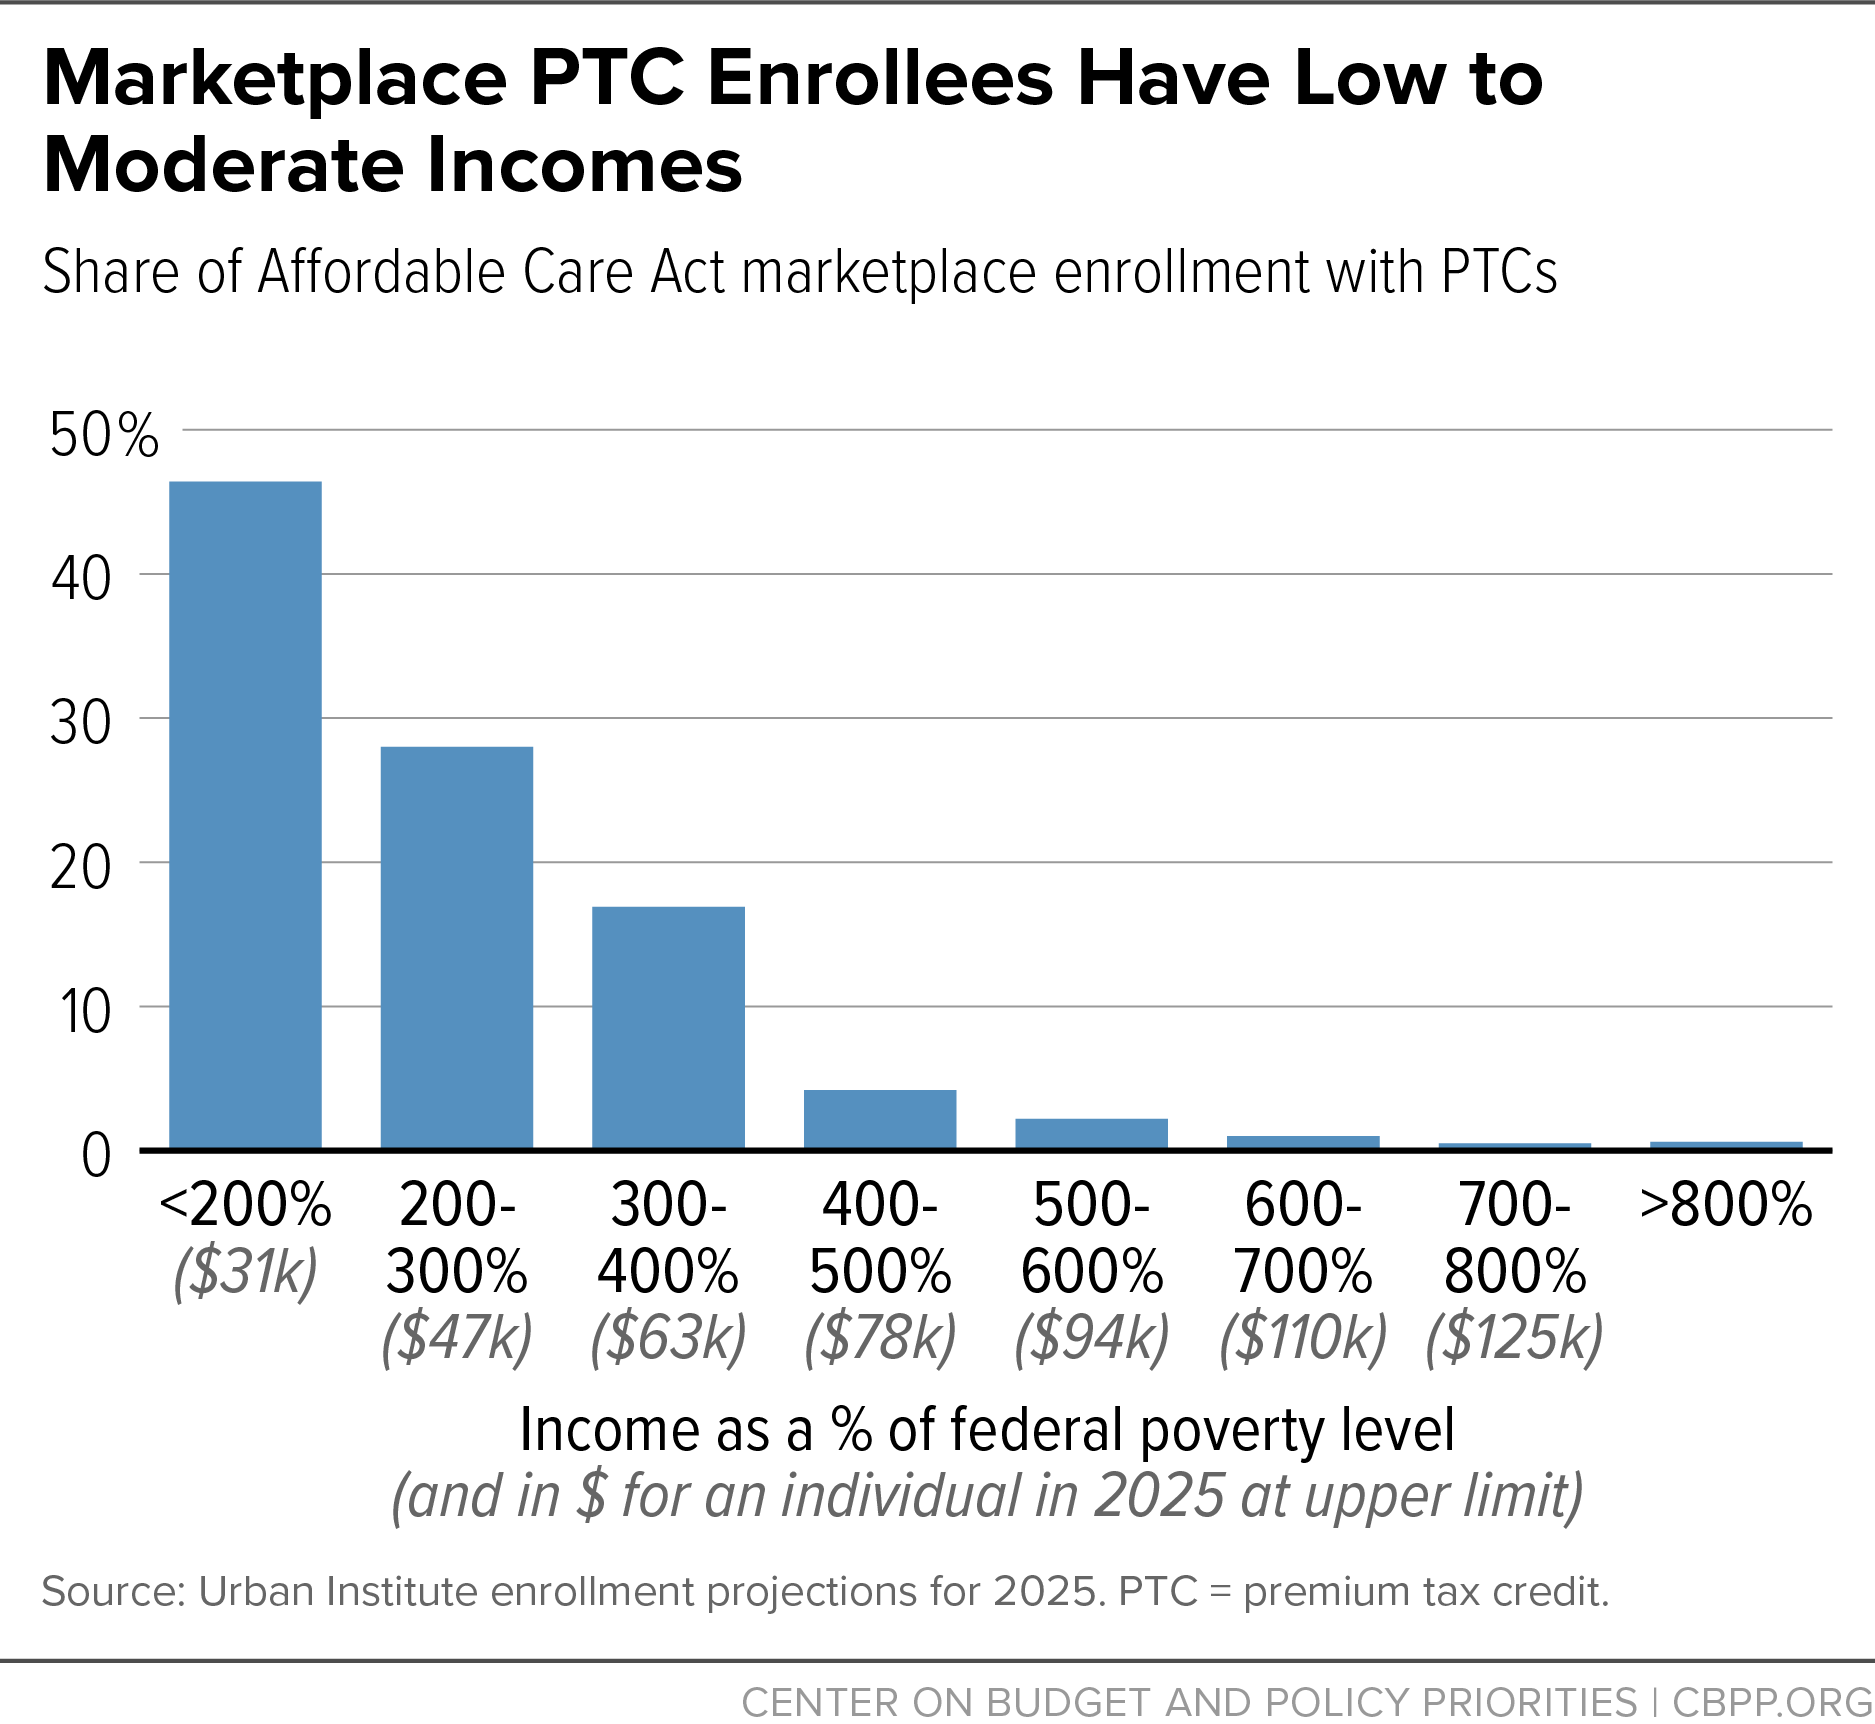
The PTC enhancements also helped spur enrollment among people with lower incomes — those just above the minimum income level for PTC eligibility. Between 2021 and 2025, marketplace enrollment among people with incomes between 100 and 200 percent of the federal poverty level grew by 143 percent, more than twice the 59 percent growth rate among those with other incomes.[11] Marketplace PTCs overwhelmingly benefit people with low to moderate incomes. More than 9 in 10 enrollees have incomes below 400 percent of the federal poverty level, or about $63,000 for an individual in 2025.[12] (See Figure 2.)

The total dollar value of the PTC enhancements is also overwhelmingly concentrated among people with low and moderate incomes. According to the Joint Committee on Taxation (JCT), if the enhancements are extended, the majority of the benefits would go to households making less than $80,000, and 94 percent would go to households with incomes under $200,000.[13] No benefits would go to households with incomes above $500,000, according to JCT. (See Figure 3.)

Finally, the PTC enhancements have been crucial for self-employed workers and small business owners who, prior to the ACA, had limited options for affordable coverage and who disproportionately benefit from the ACA marketplaces.[14] Self-employed workers and small business owners generally make up about 1 in 4 marketplace enrollees, the Treasury Department estimates; based on this figure, CBPP estimates that more than 5 million self-employed workers and small business owners are enrolled in ACA marketplaces.[15]
Many of these coverage gains will be lost if the PTC enhancements are allowed to lapse. Without the enhancements, CBO projects that 3.8 million more people will be uninsured in 2035.[16] According to the Urban Institute, the number of Black people who are uninsured in 2026 will increase by 30 percent or 925,000, the largest rate of increase among racial/ethnic groups.[17] Marketplace enrollment would decline in every state and congressional district, with the number of enrollees receiving PTCs declining by 38 percent overall.[18]
Recent focus groups convened by CBPP show the real-world impacts that the PTC enhancements have had on people’s lives — and the repercussions if they expire.[19] For Tracy, a 57-year-old customer service representative from Georgia whose plan’s out-of-pocket premiums are set to rise by $350 per month, the rise in marketplace premiums would “most likely mean sacrificing essentials: groceries, gas, basic necessities that I rely on.” Losing the PTC enhancements would force tough decisions, including for people with chronic conditions. M. M., a 45-year-old IT consultant from Illinois, might “hold back on some of those medications, eat less … take less insulin to treat my diabetes.”
Premiums Would Rise in Every State, for All Ages and Income Levels
If the PTC enhancements expire, premium costs will soon increase for people across states, ages, and income levels. Many have already experienced “rate shock” and more will continue to do so, as insurers in some states have sent renewal notices showing spiking 2026 premiums and premiums are already viewable on many marketplace websites. And the premium increases would come on top of premium and other out-of-pocket cost increases already set to begin in 2026 due to a recent Trump Administration rule.[20]
People with lower incomes will tend to face the largest percentage increases in premium costs if the PTC enhancements expire. For example:
- A single individual making $22,000 (140 percent of the poverty level) will no longer be eligible for a zero-premium silver plan with cost-sharing reductions and will see their monthly marketplace premium rise from $0 to $66 — an annual increase of $786.
- A single individual making $32,000 (204 percent of the poverty level) will see their monthly marketplace premium rise from $58 to $180 — an annual increase of $1,468.
- A couple making $44,000 (208 percent of the poverty level) will see their monthly marketplace premium rise from $85 to $253 — an annual increase of $2,013.
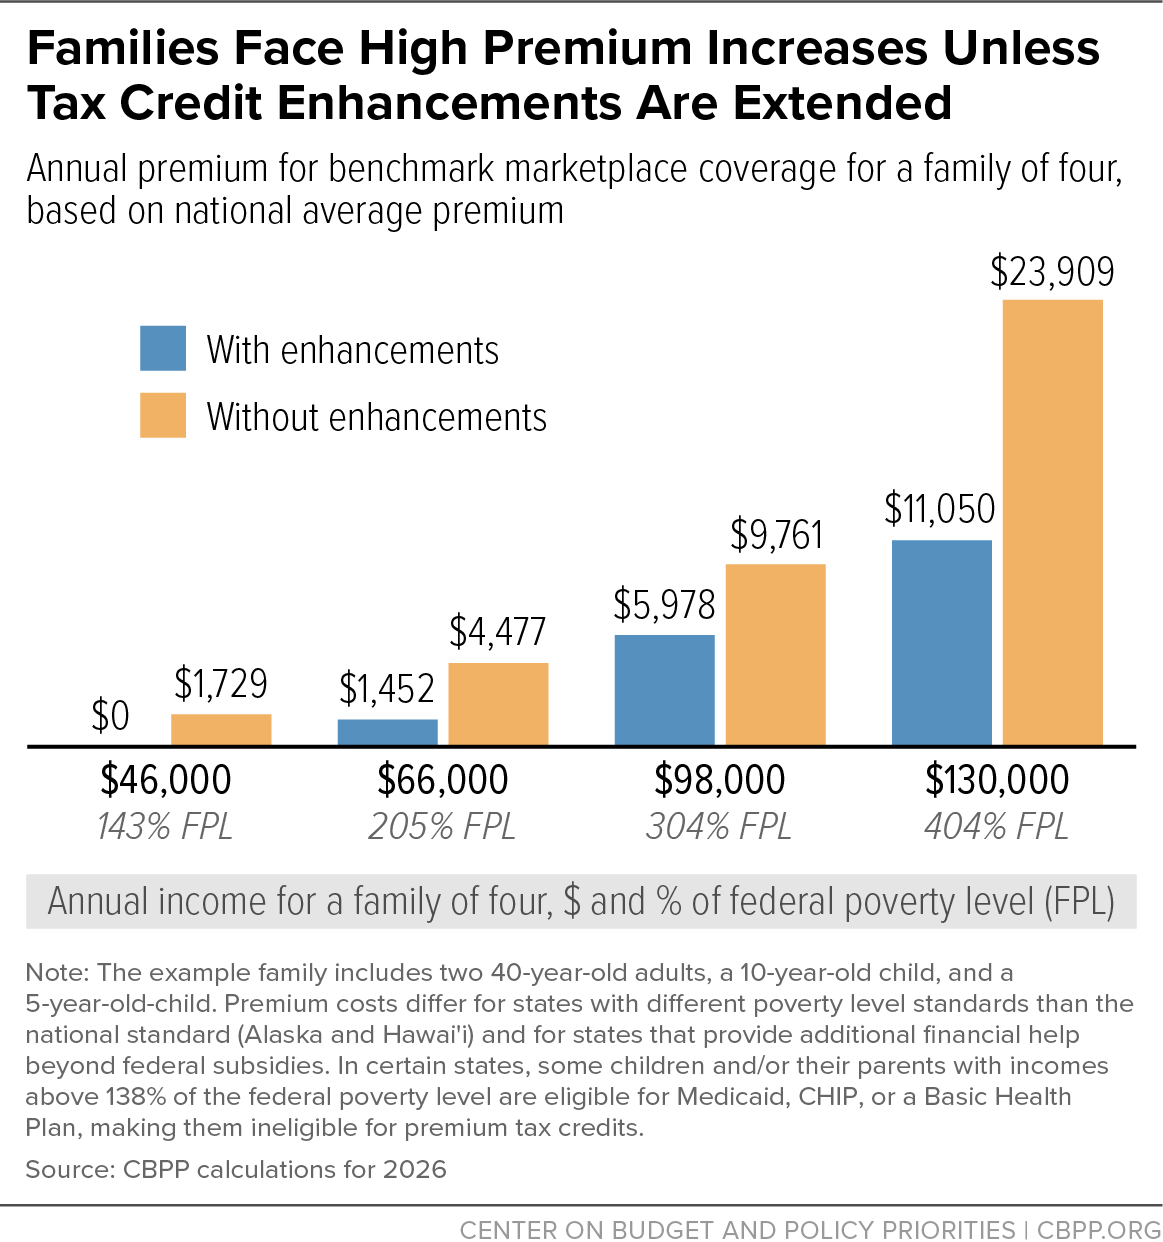
- A family of four making $66,000 (205 percent of the poverty level) will see their monthly marketplace premium rise from $121 to $373 — an annual increase of about $3,025.
See Figure 4 for a family of four at different income levels; Appendix Table 1 for premium increases among people of various family sizes, ages, and incomes; and Appendix Table 2 for premium increases at the state level. State-by-state graphics of sample households are also available.[21]

As a result of the enhancements, people with incomes above 400 percent of the poverty level became newly eligible for PTCs if their marketplace premiums would exceed 8.5 percent of household income. This was especially beneficial for some people earning just over 400 percent of poverty, whose premiums would otherwise have taken up a large share of their income.[22] If the PTC enhancements are not extended, people in this group will face dramatic premium increases:
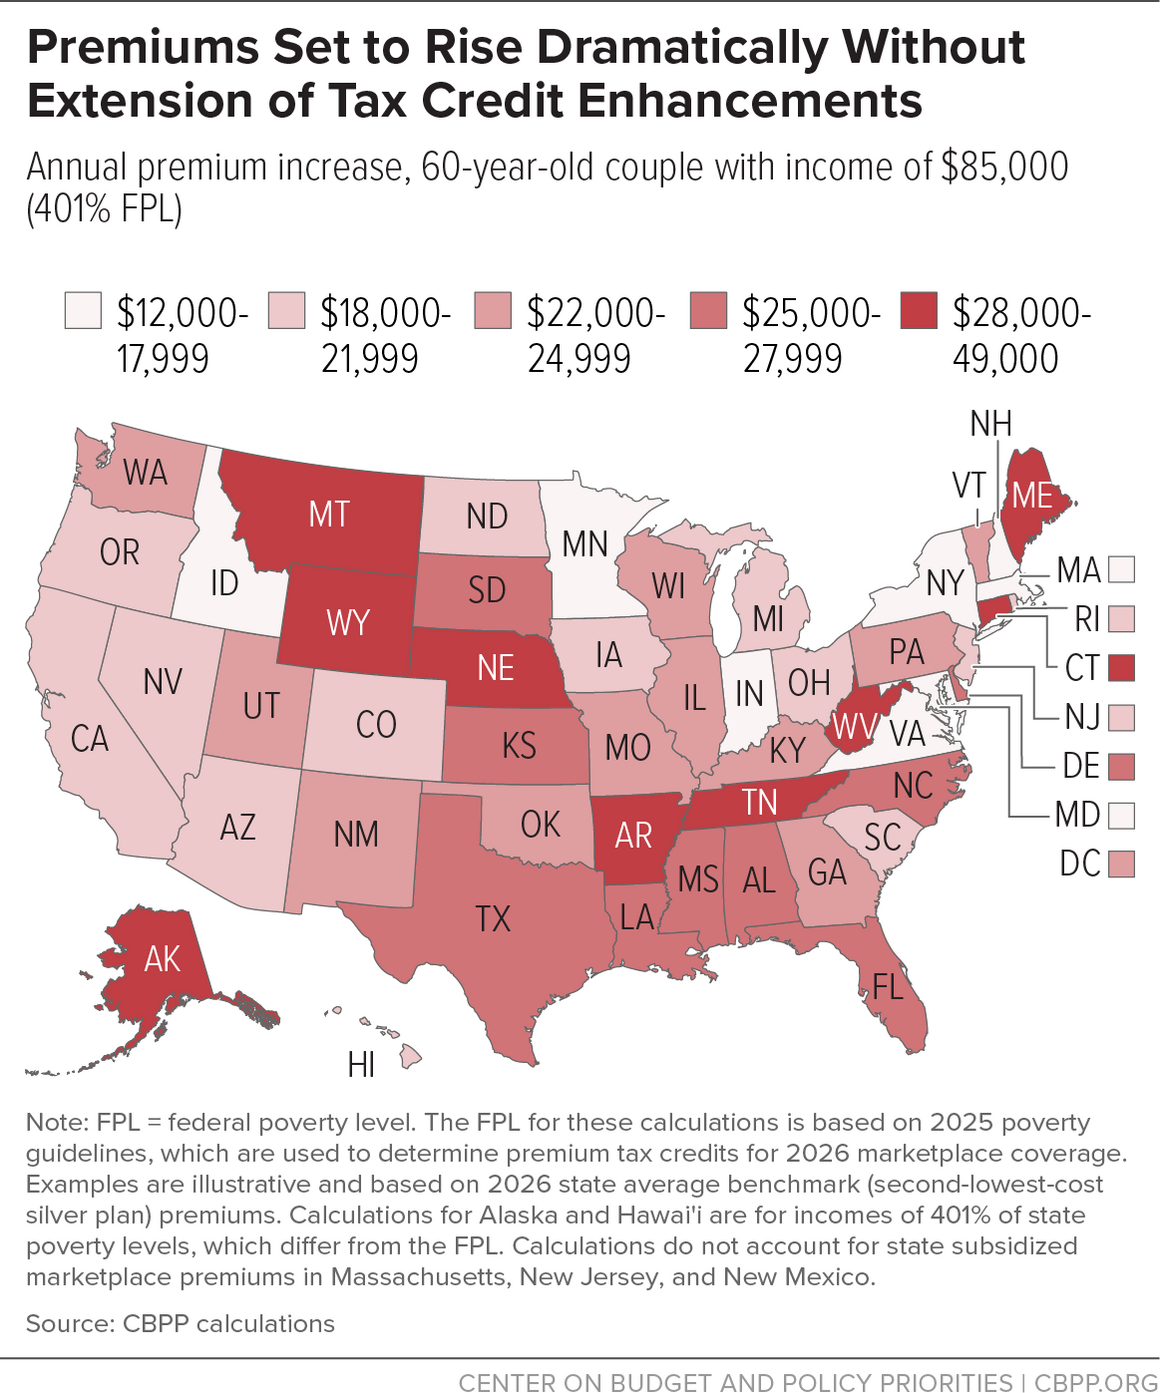
- A typical 60-year-old couple making $85,000 (401 percent of the poverty level) will see monthly marketplace premiums jump from $602 to $2,647 — an annual increase of roughly $24,500.
- A typical family of four making $130,000 (404 percent of the poverty level) will see their monthly marketplace premium go from $921 to $1,992 — an annual increase of about $12,900.
Dramatic premium spikes are most likely to occur:
- in states with high underlying marketplace premiums, such as West Virginia and Wyoming;
- for older enrollees, who pay higher premiums under ACA rules than younger people; and
- for people with incomes above 400 percent of the poverty level (roughly $63,000 for an individual), who would lose subsidies entirely if the enhancements expired.
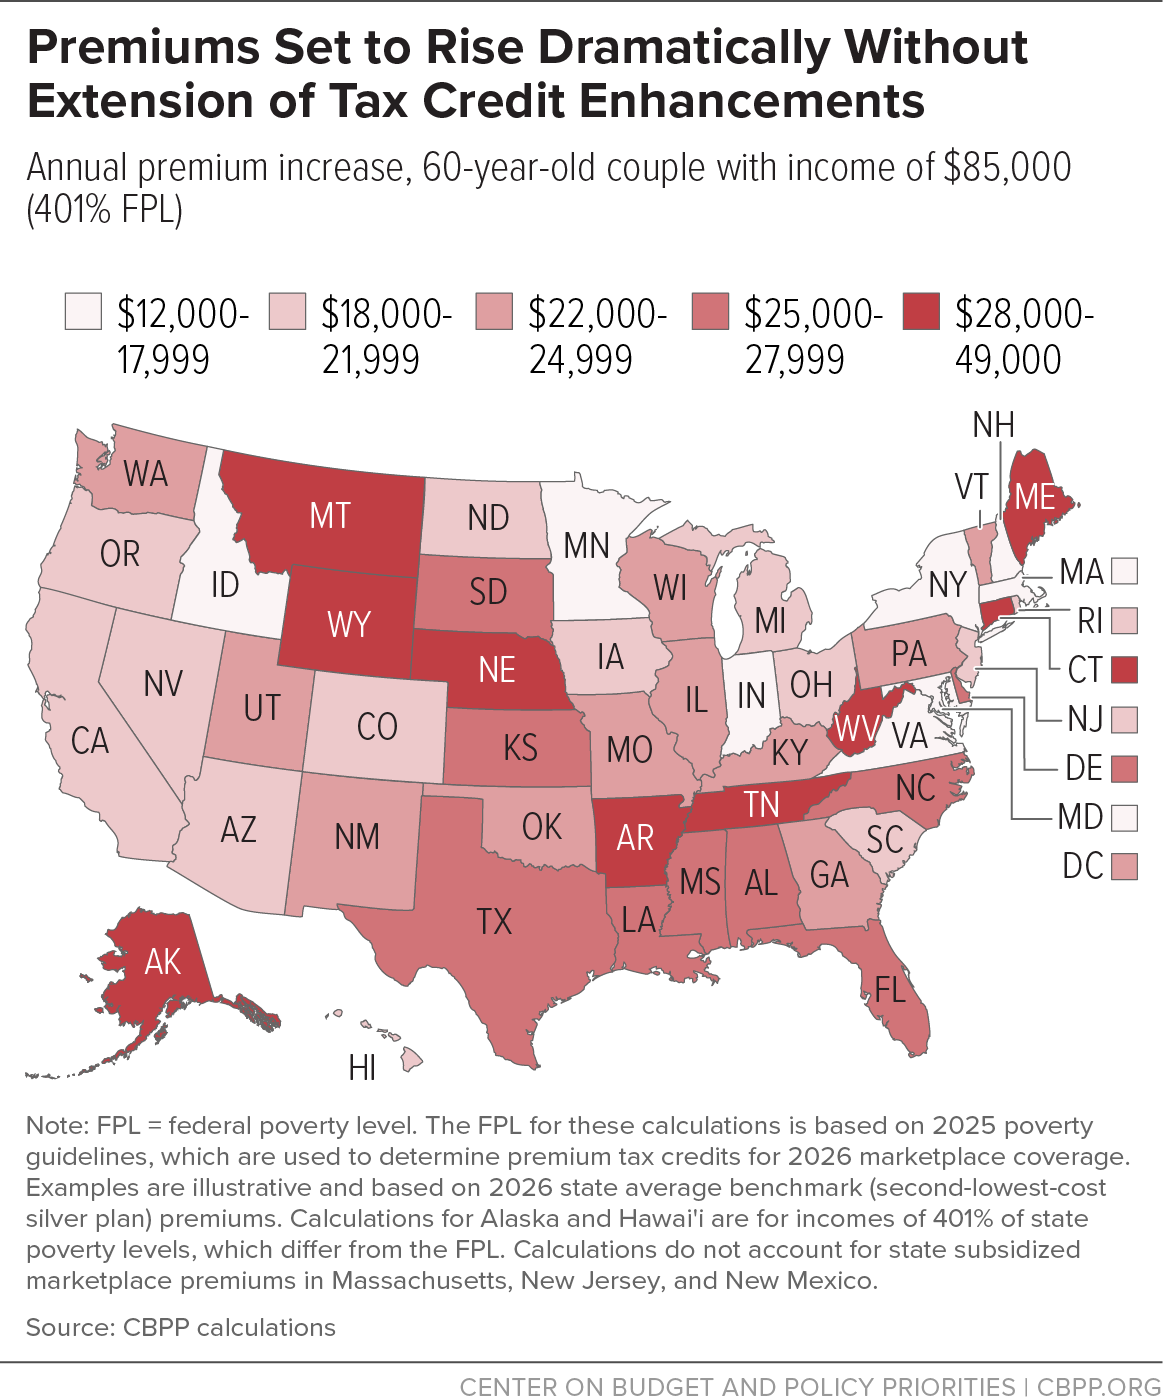
For example, a 60-year-old West Virginia couple making $85,000 will see annual premiums for a benchmark silver plan skyrocket from $7,225 to over $54,000. (See Figure 5 and Appendix Table 2).


Appendix
| APPENDIX TABLE 1 | ||||
|---|---|---|---|---|
National Average Premium Increases if Enhancements Expire, by Income Level | ||||
| Annual marketplace premiums | ||||
| With enhancements (current) | Without enhancements | Premium increase without enhancements | Percentage premium increase | |
| 45-year-old individual | ||||
| $22,000 (140% FPL) | $0 | $786 | $786 | N/A |
| $32,000 (204% FPL) | $691 | $2,159 | $1,468 | 212% |
| $48,000 (306% FPL) | $2,952 | $4,781 | $1,829 | 62% |
| $64,000 (408% FPL) | $5,440 | $8,450 | $3,010 | 55% |
| 60-year-old couple | ||||
| $30,000 (141% FPL) | $0 | $1,090 | $1,090 | N/A |
| $44,000 (208% FPL) | $1,021 | $3,034 | $2,013 | 197% |
| $64,000 (306% FPL) | $3,872 | $6,374 | $2,502 | 65% |
| $85,000 (401% FPL) | $7,225 | $31,762 | $24,537 | 340% |
| Family of four | ||||
| $46,000 (143% FPL) | $0 | $1,729 | $1,729 | N/A |
| $66,000 (205% FPL) | $1,452 | $4,477 | $3,025 | 208% |
| $98,000 (304% FPL) | $5,978 | $9,761 | $3,783 | 63% |
| $130,000 (404% FPL) | $11,050 | $23,909 | $12,859 | 116% |
Note: FPL = federal poverty level. The FPL for these calculations is based on 2025 poverty guidelines, which are used to determine premium tax credits for 2026 marketplace coverage. Examples are illustrative and based on 2026 national average benchmark (second-lowest-cost silver plan) premiums for essential health benefits with age adjustments. The example family includes two 40-year-old parents, a 10-year-old, and a 5-year-old. Estimates are applicable in all states except for those with different poverty level standards than the national standard and/or those that subsidize marketplace premiums beyond the federal subsidy. See Appendix Table 2 for state-specific estimates. Source: CBPP calculations | ||||
| APPENDIX TABLE 2 | |||||||||
|---|---|---|---|---|---|---|---|---|---|
State-by-State Premium Increases if Enhancements Expire | |||||||||
| State | 45-year-old individual; $64,000 (408% FPL) | 60-year-old couple; $85,000 (401% FPL) | Family of four; $130,000 (404% FPL) | ||||||
| With enhancements (current) | Without enhancements | Premium increase without enhancements | With enhancements (current) | Without enhancements | Premium increase without enhancements | With enhancements (current) | Without enhancements | Premium increase without enhancements | |
| U.S. average | $5,440 | $8,450 | $3,010 | $7,225 | $31,762 | $24,537 | $11,050 | $23,909 | $12,859 |
| Alabama | 5,440 | 8,745 | 3,305 | 7,225 | 32,874 | 25,649 | 11,050 | 23,172 | 12,122 |
| Alaska a | 6,780 | 13,993 | 7,213 | 9,009 | 52,598 | 43,589 | 13,801 | 39,594 | 25,793 |
| Arizona | 5,440 | 7,213 | 1,773 | 7,225 | 27,115 | 19,890 | 11,050 | 20,411 | 9,361 |
| Arkansas | 5,440 | 10,494 | 5,054 | 7,225 | 39,449 | 32,224 | 11,050 | 29,695 | 18,645 |
| California | 5,440 | 7,756 | 2,316 | 7,225 | 29,153 | 21,928 | 11,050 | 21,945 | 10,895 |
| Colorado | 5,440 | 7,539 | 2,099 | 7,225 | 28,338 | 21,113 | 11,050 | 21,332 | 10,282 |
| Connecticut | 5,440 | 11,796 | 6,356 | 7,225 | 44,341 | 37,116 | 11,050 | 33,379 | 22,329 |
| Delaware | 5,440 | 9,369 | 3,929 | 7,225 | 35,218 | 27,993 | 11,050 | 26,511 | 15,461 |
| District of Columbia | 5,440 | 8,823 | 3,383 | 7,225 | 31,362 | 24,137 | 11,050 | 24,340 | 13,290 |
| Florida | 5,440 | 9,261 | 3,821 | 7,225 | 34,811 | 27,586 | 11,050 | 26,204 | 15,154 |
| Georgia | 5,440 | 8,556 | 3,116 | 7,225 | 32,160 | 24,935 | 11,050 | 24,209 | 13,159 |
| Hawai'i a | 6,239 | 7,335 | 1,096 | 8,289 | 27,573 | 19,284 | 12,699 | 20,756 | 8,057 |
| Idaho | 5,440 | 6,671 | 1,231 | 7,225 | 25,076 | 17,851 | 11,050 | 18,876 | 7,826 |
| Illinois | 5,440 | 8,217 | 2,777 | 7,225 | 30,886 | 23,661 | 11,050 | 23,250 | 12,200 |
| Indiana | 5,440 | 6,427 | 987 | 7,225 | 24,158 | 16,933 | 11,050 | 18,186 | 7,136 |
| Iowa | 5,440 | 6,793 | 1,353 | 7,225 | 25,535 | 18,310 | 11,050 | 19,221 | 8,171 |
| Kansas | 5,440 | 9,084 | 3,644 | 7,225 | 34,148 | 26,923 | 11,050 | 25,705 | 14,655 |
| Kentucky | 5,440 | 8,217 | 2,777 | 7,225 | 30,886 | 23,661 | 11,050 | 23,250 | 12,200 |
| Louisiana | 5,440 | 8,759 | 3,319 | 7,225 | 32,925 | 25,700 | 11,050 | 24,785 | 13,735 |
| Maine | 5,440 | 9,600 | 4,160 | 7,225 | 36,085 | 28,860 | 11,050 | 27,163 | 16,113 |
| Maryland | 5,440 | 5,573 | 133 | 7,225 | 20,947 | 13,722 | 11,050 | 15,769 | 4,719 |
| Massachusetts b | 5,440 | 6,534 | 1,094 | 7,225 | 20,455 | 13,230 | 11,050 | 18,543 | 7,493 |
| Michigan | 5,440 | 7,118 | 1,678 | 7,225 | 26,758 | 19,533 | 11,050 | 20,142 | 9,092 |
| Minnesota | 5,440 | 6,034 | 594 | 7,225 | 22,680 | 15,455 | 11,050 | 18,118 | 7,068 |
| Mississippi | 5,440 | 8,976 | 3,536 | 7,225 | 33,740 | 26,515 | 11,050 | 23,782 | 12,732 |
| Missouri | 5,440 | 8,203 | 2,763 | 7,225 | 30,835 | 23,610 | 11,050 | 23,212 | 12,162 |
| Montana | 5,440 | 9,383 | 3,943 | 7,225 | 35,269 | 28,044 | 11,050 | 26,549 | 15,499 |
| Nebraska | 5,440 | 9,627 | 4,187 | 7,225 | 36,187 | 28,962 | 11,050 | 27,240 | 16,190 |
| Nevada | 5,440 | 6,739 | 1,299 | 7,225 | 25,331 | 18,106 | 11,050 | 19,068 | 8,018 |
| New Hampshire | 5,437 | 5,437 | 0 c | 7,225 | 20,438 | 13,213 | 11,050 | 15,385 | 4,335 |
| New Jersey b | 5,440 | 7,389 | 1,949 | 7,225 | 27,777 | 20,552 | 11,050 | 20,910 | 9,860 |
| New Mexico b | 5,440 | 8,461 | 3,021 | 7,225 | 31,803 | 24,578 | 11,050 | 23,941 | 12,891 |
| New York | 5,440 | 9,948 | 4,508 | 7,225 | 19,896 | 12,671 | 11,220 d | 28,352 d | 17,132 d |
| North Carolina | 5,440 | 8,650 | 3,210 | 7,225 | 32,517 | 25,292 | 11,050 | 24,478 | 13,428 |
| North Dakota | 5,440 | 7,728 | 2,288 | 7,225 | 29,051 | 21,826 | 11,050 | 21,869 | 10,819 |
| Ohio | 5,440 | 6,956 | 1,516 | 7,225 | 26,146 | 18,921 | 11,050 | 19,682 | 8,632 |
| Oklahoma | 5,440 | 8,189 | 2,749 | 7,225 | 30,784 | 23,559 | 11,050 | 23,173 | 12,123 |
| Oregon | 5,440 | 7,444 | 2,004 | 7,225 | 27,981 | 20,756 | 11,050 | 19,723 | 8,673 |
| Pennsylvania | 5,440 | 7,891 | 2,451 | 7,225 | 29,663 | 22,438 | 11,050 | 22,329 | 11,279 |
| Rhode Island | 5,440 | 6,874 | 1,434 | 7,225 | 25,840 | 18,615 | 11,050 | 19,452 | 8,402 |
| South Carolina | 5,440 | 7,688 | 2,248 | 7,225 | 28,898 | 21,673 | 11,050 | 21,754 | 10,704 |
| South Dakota | 5,440 | 8,881 | 3,441 | 7,225 | 33,383 | 26,158 | 11,050 | 25,130 | 14,080 |
| Tennessee | 5,440 | 9,640 | 4,200 | 7,225 | 36,238 | 29,013 | 11,050 | 27,278 | 16,228 |
| Texas | 5,440 | 8,962 | 3,522 | 7,225 | 33,689 | 26,464 | 11,050 | 25,360 | 14,310 |
| Utah | 5,440 | 9,077 | 3,637 | 7,225 | 31,156 | 23,931 | 11,050 | 23,596 | 12,546 |
| Vermont | 5,440 | 15,540 | 10,100 | 7,225 | 31,080 | 23,855 | 11,050 | 43,667 | 32,617 |
| Virginia | 5,440 | 6,223 | 783 | 7,225 | 23,394 | 16,169 | 11,050 | 17,610 | 6,560 |
| Washington | 5,440 | 8,284 | 2,844 | 7,225 | 31,141 | 23,916 | 11,050 | 23,442 | 12,392 |
| West Virginia | 5,440 | 14,548 | 9,108 | 7,225 | 54,688 | 47,463 | 11,050 | 41,167 | 30,117 |
| Wisconsin | 5,440 | 8,284 | 2,844 | 7,225 | 31,141 | 23,916 | 11,050 | 23,442 | 12,392 |
| Wyoming | 5,440 | 14,779 | 9,339 | 7,225 | 55,554 | 48,329 | 11,050 | 41,819 | 30,769 |
Note: FPL = federal poverty level. The FPL for these calculations is based on 2025 poverty guidelines, which are used to determine premium tax credits for 2026 marketplace coverage. Examples are illustrative and based on 2026 state average benchmark (second-lowest-cost silver plan) premiums for essential health benefits with age adjustments. The example family includes two 40-year-old parents, a 10-year-old, and a 5-year-old. a Incomes in dollars for Alaska and Hawai’i differ from those shown here because these states’ poverty levels differ from the federal poverty level. b Massachusetts estimates do not account for extra state subsidies available through ConnectorCare Plan Type 3D, which will only be continued in 2026 if tax credit enhancements are extended. New Jersey estimates do not account for extra state subsidies of $50 per member per month for enrollees with income between 400 and 600 percent FPL. New Mexico estimates do not account for extra state subsidies that will cover the impact of the expiring enhancements in 2026 for enrollees with income over 400 percent FPL through June 2026. c Premium payments without the enhancements do not exceed the income cap of 8.5 percent and are therefore equal with or without enhancements. d Estimates for a family of four in New York are for an income level of $132,000 (410 percent FPL), as the CHIP income eligibility threshold for children is 405 percent FPL. Source: CBPP calculations | |||||||||
End Notes
[1] By the end of the year, open enrollment will be almost over in most states, and many people will have decided to drop coverage after seeing large premium increases for their plans. Also, insurers have already finalized rates assuming that the expiration of the premium tax credit enhancements will push out some healthier enrollees, driving up underlying premiums. Congressional Budget Office estimates provided to House leadership. Laura Weiss and Samantha Handler, “Johnson’s To-do List of Tuesday,” Punchbowl News, September 16, 2025, https://punchbowl.news/archive/91625-am/#__thevaultwhydemswantobamacaredealnow.
[2] Jennifer Sullivan and Nicole Rapfogel, “Five Key Changes to ACA Marketplaces Amid Uncertainty Over Premium Tax Credit Enhancements,” CBPP, September 22, 2025, https://www.cbpp.org/research/health/five-key-changes-to-aca-marketplaces-amid-uncertainty-over-premium-tax-credit.
[3] Congressional Budget Office (CBO), “The Estimated Effects of Enacting Selected Health Coverage Policies on the Federal Budget and on the Number of People with Health Insurance,” September 18, 2025, https://www.cbo.gov/publication/61734; Justin Lo et al., “ACA Marketplace Premium Payments Would More than Double on Average Next Year if Enhanced Premium Tax Credits Expire,” KFF, September 30, 2025, https://www.kff.org/affordable-care-act/aca-marketplace-premium-payments-would-more-than-double-on-average-next-year-if-enhanced-premium-tax-credits-expire/.
[4] Centers for Medicare & Medicaid Services (CMS), “Effectuated Enrollment: Early 2025 Snapshot and Full Year 2024 Average,” July 30, 2025, https://www.cms.gov/files/document/effectuated-enrollment-early-snapshot-2025-and-full-year-2024-average.pdf.
[5] CBPP, Beyond the Basics, “Key Facts: Premium Tax Credit,” updated August 2024, https://www.healthreformbeyondthebasics.org/premium-tax-credits-answers-to-frequently-asked-questions/
[6] Lo et al., op. cit.
[7] CMS, op. cit.
[8] Elizabeth Zhang, “ACA Marketplace Policies Softened Coverage Losses From Unwinding of the Medicaid Continuous Coverage Provision,” CBPP, September 9, 2025, https://www.cbpp.org/blog/analyzing-the-census-bureaus-2024-poverty-income-and-health-insurance-data?entry_uuid=73eb89fb-b1fb-4ffb-a915-600e2fdb2548#entry.
[9] Roughly half of enrollees’ races were unknown in 2024 marketplace enrollment data. The estimates cited here are limited to states that use the HealthCare.gov platform and include imputations of missing race and ethnicity data, which greatly improves the usefulness of the data but does not disaggregate beyond broad racial and ethnic categories. Anupama Warrier et al., “HealthCare.gov Plan Selections by Race and Ethnicity, 2015-2024,” Office of the Assistant Secretary for Planning and Evaluation, HHS, October 1, 2024, https://aspe.hhs.gov/reports/healthcaregov-plan-selections-race-ethnicity-2015-2024.
[10] CBPP analysis of American Community Survey. Rose Chu and Benjamin Sommers, “Health Insurance Coverage Changes Since Implementation of the Affordable Care Act: Asian Americans and Pacific Islanders,” Office of the Assistant Secretary for Planning and Evaluation, HHS, May 23, 2021, https://aspe.hhs.gov/reports/health-insurance-coverage-changes-asian-americans-pacific-islanders.
[11] Idaho is excluded due to missing data. CMS, “2025 Marketplace Open Enrollment Period Public Use Files,” May 2, 2025, https://www.cms.gov/data-research/statistics-trends-reports/marketplace-products/2025-marketplace-open-enrollment-period-public-use-files and “2021 Marketplace Open Enrollment Period Public Use Files,” April 13, 2021, https://www.cms.gov/data-research/statistics-trends-reports/marketplace-products/2021-marketplace-open-enrollment-period-public-use-files.
[12] Jessica Banthin, Laura Skopec, and Michael Simpson, “Enhanced PTCs Help Older Adults and Those in High-Premium States Afford Coverage,” Urban Institute, September 9, 2024, https://www.urban.org/research/publication/enhanced-ptcs-help-older-adults-and-those-high-premium-states-afford-coverage.
[13] Thomas A. Barthold, Joint Committee on Taxation memorandum dated September 18, 2025, Punchbowl News, https://punchbowl.news/jct-aca/.
[14] Gideon Lukens, “ACA Drove Record Coverage Gains for Small-Business and Self-Employed Workers,” CBPP, July 17, 2024, https://www.cbpp.org/blog/aca-drove-record-coverage-gains-for-small-business-and-self-employed-workers.
[15] Gideon Lukens, “Research Note: 5 Million Small Business Owners and Self-Employed Workers Likely Enrolled in ACA Marketplace in 2025,” CBPP, June 12, 2025, https://www.cbpp.org/research/health/5-million-small-business-owners-and-self-employed-workers-likely-enrolled-in-aca.
[16] CBO, op. cit.
[17] Matthew Buettgens et al., “4.8 Million People Will Lose Coverage in 2026 If Enhanced Premium Tax Credits Expire,” Urban Institute, September 17, 2025, https://www.urban.org/research/publication/48-million-people-will-lose-coverage-2026-if-enhanced-premium-tax-credits.
[18] Ibid.
[19] Claire Heyison, “Marketplace Enrollees Tell Congress: Extend the Enhanced Premium Tax Credits,” CBPP, July 29, 2025, https://www.cbpp.org/blog/marketplace-enrollees-tell-congress-extend-the-enhanced-premium-tax-credits.
[20] Some, but not all, provisions in the rule were temporarily paused by a district court order. Jennifer Sullivan and Nicole Rapfogel, “Five Key Changes to ACA Marketplaces Amid Uncertainty Over Premium Tax Credit Enhancements,” CBPP, September 22, 2025, https://www.cbpp.org/research/health/five-key-changes-to-aca-marketplaces-amid-uncertainty-over-premium-tax-credit; U.S. District Court for the District of Maryland, “Memorandum Opinion, City of Columbus et al. v. Robert F. Kennedy, Jr. et al., Civil No. 25-2114-BAH, August 22, 2025, https://democracyforward.org/wp-content/uploads/2025/08/35-City-of-Columbus-memorandum-opinion.pdf.
[21] CBPP, “Marketplace Enrollees Face Steep Premium Increases Unless Tax Credit Enhancements Are Extended,” https://www.cbpp.org/research/resource-lists/marketplace-enrollees-face-steep-premium-increases-unless-tax-credit.
[22] In 2025, half of all PTC enrollees with incomes above 400 percent of poverty have incomes between 400 and 500 percent of poverty, or between about $60,000 to $75,000 for an individual (using 2024 poverty guidelines), the Urban Institute estimates. Jessica Banthin, Laura Skopec, and Michael Simpson, “Enhanced PTCs Help Older Adults and Those in High-Premium States Afford Coverage,” Urban Institute, September 9, 2024, https://www.urban.org/research/publication/enhanced-ptcs-help-older-adults-and-those-high-premium-states-afford-coverage.