House Proposal to Block-Grant School Meal Programs Would Put Children’s Nutrition at Risk
A bill approved by the House Education and the Workforce Committee would convert the school lunch and breakfast programs into a capped block grant in up to three states, fundamentally changing school meal rules and funding — and doing so without any safeguards to ensure that the programs continue to respond to economic downturns and population growth, target funds at low-income children, or meet children’s nutritional needs.[1] Converting the school meal programs, which feed nutritious meals to 22 million low-income children daily in over 95,000 schools, into a block grant poses serious risks to children’s diets, health, and academic performance.
A fundamental strength of the school meal programs is their ability to expand and contract in response to changes in need.A fundamental strength of the school meal programs is their entitlement structure, which enables them to expand and contract in response to changes in need. When more children qualify for free or reduced-price meals because of a widespread downturn like the Great Recession or local job losses due to a plant closing, schools receive reimbursement for those meals. The entitlement structure also allows school districts to improve the nutritional services they provide, such as by offering school breakfast.
School meals are available to all low-income children who qualify. Unlike other programs that serve only a portion of the eligible individuals, there are no waiting lists or rationing of meals for eligible low-income children. This design enables schools to ensure that students have the nutrition needed to learn and thrive.
Under the proposed block grant, up to three states would receive capped funding in lieu of the federal entitlement for reimbursement for school breakfasts and lunches. The three states would have to commit to providing every student one “healthy” and “affordable” meal on school days; beyond that, they could set all nutrition and eligibility rules. Current safeguards, such as federal rules regarding food safety, the eligibility of poor and near-poor school children for free meals, and the quantity and nutritional value of food provided, would disappear. States could, for example, contract with a fast-food company to operate the school meal programs statewide or eliminate the breakfast program in middle and high schools to expand offerings in elementary schools.
A state’s funding would be set modestly below its funding level for fiscal year 2016 and would then be frozen for three years, with no adjustment for inflation. Together, the initial cut and the grant’s erosion in purchasing power over time would produce about a 12 percent funding cut by the third year, based on average food inflation over the past decade. States would have the option of extending the block grant for another three years at the same funding level. If the fixed amount of federal funding ran out during the school year (a particular risk if a recession set in), there would be no guarantee that poor children would continue receiving free school meals.
As noted, the block grant would not respond to changes in need, so states would receive no added federal support if more children qualified for meals due to an economic downturn. In fact, if the block grant had been put in place in 2008 based on fiscal year 2007 funding, states’ inflation-adjusted funding by the third year would have been 28 percent below the actual funding levels they received that year, which enabled them to serve the many additional children who became eligible for free or reduced-price school meals due to the Great Recession.
Exacerbating these problems, the bill would allow states to divert resources they now spend on school meals to other purposes, as long as state politicians concluded those purposes met school-aged children’s nutritional needs. For example, a state could shrink school meal portions and use the savings in federal resources to substitute for state funds in an existing state-funded weight-loss program for children. The state then could use the freed-up state funds for other purposes, such as plugging holes in the state budget, with the result that fewer total federal and state resources would be devoted to children’s nutrition.
Just such a process has occurred under the Temporary Assistance for Needy Families (TANF) block grant. States have shifted much of their TANF funds away from the program’s core purposes of improving poor families’ work opportunities and helping families meet basic needs and have effectively used some of the funds to fill budget holes instead (and to fund services for families with higher incomes).
While the proposed block grant would operate in only three states, it’s likely intended as a first step. In 1995, House Republicans passed legislation to convert the school meal programs to block grants in all states. Moreover, during the House Education and the Workforce mark-up of the bill in May, nine committee members voted for a much more sweeping proposal to block-grant these programs nationwide.
Funding Would Be Cut Immediately and Erode Further Over Time
Currently, school districts receive federal reimbursements when they serve schoolchildren meals that meet basic standards, including nutrition standards. Children in families with incomes at or below 130 percent of the poverty line receive meals at no charge; the school district is reimbursed at the highest federal meal reimbursement rate, known as the “free” meal rate (about $3.15 per lunch and $1.99 per breakfast). Children in families with incomes between 130 percent and 185 percent of poverty line receive “reduced-price meals” and pay no more than 30 cents for breakfast and 40 cents for lunch; the federal reimbursement is 30 cents or 40 cents lower than the free rate. Children in families with incomes above 185 percent of poverty pay for their meals, which also receive a small federal subsidy. Schools leverage the modest reimbursements to cover the costs of serving millions of healthy meals each school day.
The House bill would replace this funding structure for participating states with a block grant. States would receive a federal funding amount equal to the federal funding the state received in fiscal year 2016 for school breakfasts and lunches,[2]minus two modest current funding sources:
- an additional 6 cents that school districts receive for each lunch they serve that meets the recently strengthened federal nutrition requirements; and
- a 29-cent subsidy they receive for each meal served to children in the “paid” category (those who do not qualify for free or reduced-price meals because their family’s income is more than 185 percent of the poverty line).
Nationwide, those two funding sources amounted to 6.6 percent of school meal program funding in fiscal year 2015, the most recent year available. Therefore, even initially, a block grant would cut available funding by amounts that would range from 3 to 22 percent (depending on the state) below the previous year’s level. (See Table 1.) This immediate cut would be largest in the states with the highest shares of meals served to students in the paid category: Iowa, Minnesota, New Hampshire, North Dakota, and South Dakota, which would see cuts of 15 percent or more.
Because we do not know which states would apply for the block grant, we don’t know the exact dollar amount of the actual cut that would result. The median state reduction would be 7.9 percent below the prior year’s funding level. States opting for the block grant would immediately have to reduce the resources devoted to school meals programs unless they made up for the loss with state or local funds.
In New Jersey and Ohio, which are very close to the median, the cuts would amount to $29 million and $40 million, respectively, if the block grant were based on fiscal year 2015 funding. In New Jersey, about 7.5 percent of the students approved for free or reduced-price meals attend school in Newark or Trenton, so cuts comparable to eliminating the meal programs in those cities would be needed. Likewise, about 7.3 percent of Ohio students approved for free or reduced-price meals attend school in Cincinnati or Columbus, so cuts comparable to eliminating the meal programs in those cities would be needed.
In addition, each state’s block grant would be frozen for three years at its initial level, so the block grant funding would erode in purchasing power each year due to inflation. Under current rules, reimbursements are adjusted each year to keep pace with food-price inflation. Over the last ten years, the inflation adjustment has averaged just under 3 percent, but it is expected to be lower in the coming years; if annual food price inflation is closer to 2 percent over the three years of the block grant, the grant’s purchasing power would fall by about an additional 6 percent.[3] Achieving a 6 percent cut would mean serving about 6 million fewer lunches in New Jersey over a year and about 9 million fewer lunches in Ohio, on top of the cuts needed to offset the initial funding reductions.
If the state opted for another three years of the block grant, the block grant’s value would end up about 12 percent below the initial year’s level, due to inflation. If food prices jumped more than usual in a year, as happened in 2008 due to a spike in dairy prices, the block grant’s purchasing power would erode further.
Even without high inflation, the combination of the initial cut and the grant’s erosion in purchasing power could produce a 12 percent funding decline by the third year, relative to the year before the block grant. By the sixth year, the decline would be 17 percent (see Figure 1).
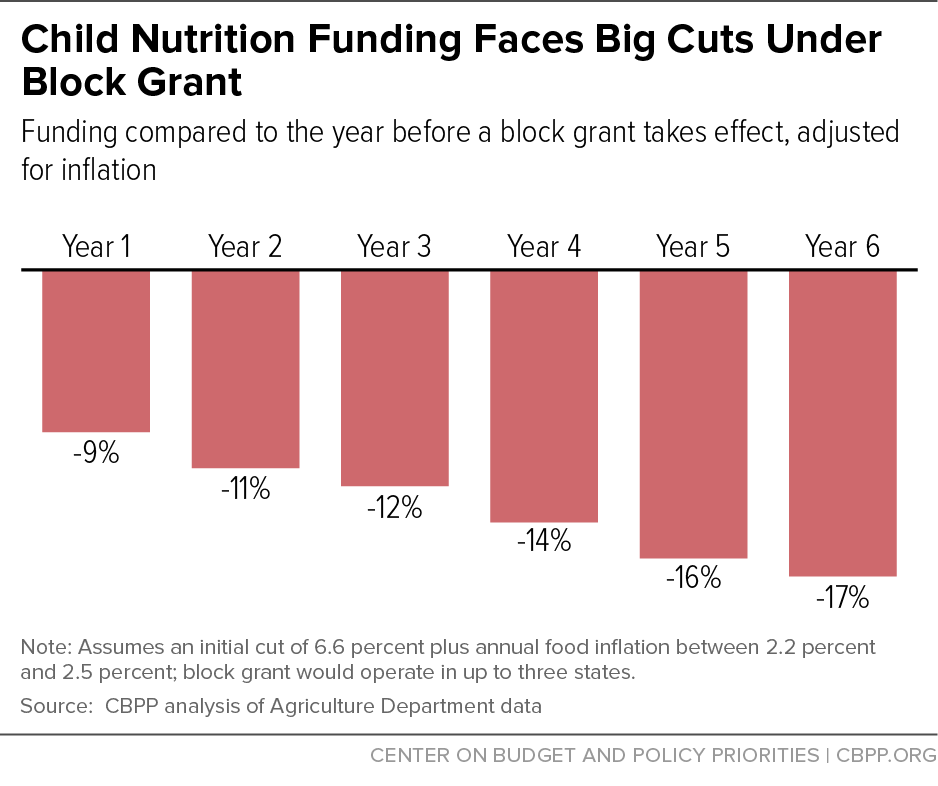
The block grant also differs from the current funding structure in that it does not account for population growth. If the number of schoolchildren in a state rose, per-student funding would fall by even more than the percentages shown in Figure 1.
States Would Get No Help Responding to Economic Downturns
In addition to the immediate funding cut and the erosion of purchasing power over time, the proposed block grant would pose a larger risk for states: it would not respond to changes in need. If more children qualified for meals due to an economic downturn, federal funding would remain unchanged.
The number of low-income children who consumed a free or reduced-price lunch on a typical day rose by more than 2 million between October 2006 and October 2009, largely due to the Great Recession. States were able to meet the rapidly increasing demand because the structure of the school meal programs meant they could count on receiving federal reimbursement for each additional meal served.
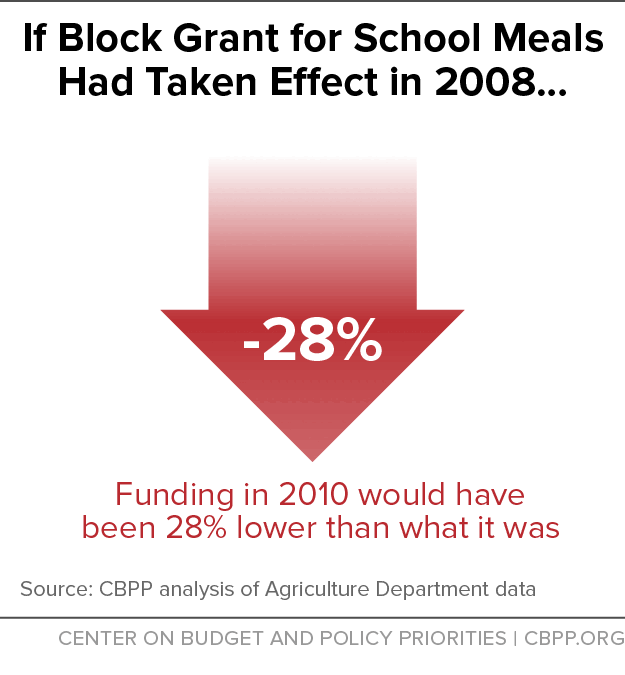
If the block grant had been put in place in 2008 based on fiscal year 2007 funding, states’ inflation-adjusted funding by the third year would have been 28 percent below their actual funding that year (see Figure 2).[4] Table 2 shows what the impact would have been on individual states. Table 3 shows the number of additional children each state served in October 2009 as compared to October 2006 — children for whom additional funds would not have been available under the block grant.
With their funding capped, states would face an array of unappealing choices during a downturn. While they could redirect state funds from other areas to meet increasing demand for school meals, that would be very unlikely. State revenues fall during a recession, and since states must meet balanced budget requirements even in recessions, it is difficult to see states moving significant new state resources into school meal programs. States cut expenditures during economic downturns, rather than increasing them. States’ choices consequently would include:
- Restricting eligibility for free or reduced-price meals to keep the number of qualifying children from rising, either by denying meals to some children previously deemed eligible or by placing on waiting lists children who are newly eligible for the meals because their family’s income has fallen. Either approach would likely exacerbate food insecurity.
- Providing less food and/or weakening nutrition standards, which also could increase food insecurity and adversely affect children’s health.
Had the proposed block grant been implemented in 2008, the cut by the third year would have been so large that in all but five states, eliminating the entire breakfast program statewide would not have been sufficient to offset the loss of federal funds. (See Table 4.) If instead, states had offset the cut by reducing reimbursements for each lunch, the reimbursements would have had to fall by anywhere between 48 cents and 99 cents per lunch, from the typical $2.72 per-lunch reimbursement that school districts received during the 2010-2011 school year. That would have represented a cut of 18 percent to 36 percent. Moreover, states might have had to impose the cuts in the middle of a school year, if staff became concerned about running out of funds due to a large, unexpected increase in demand for free and reduced-price meals as a result of the deteriorating economy.
Even in the absence of a nationwide recession, a state or school district that experienced a local downturn (or population growth) would be stymied under a block grant. If a major plant closed, causing a sudden jump in local unemployment during the school year, the state could provide free meals to children whose parents were suddenly unemployed only by redirecting state funds or cutting federal school meal funds for other school districts.
Block Grant Poses Additional Risks
Block grants pose risks beyond reducing funding and impeding states’ ability to respond to a downturn. With funding capped, states would not receive additional funding if they succeeded in reaching more eligible children in their school meal programs, or if schools without a breakfast program adopted one. Block grants typically also result in the diversion of federal funds away from low-income families or core program purposes. And a school meal block grant would likely be accompanied by the elimination or weakening of federal nutrition standards for school meals.
Diversion of Funds From Core Program Purposes
Under the proposed block grant, states could divert funds away from feeding low-income children to other purposes so long as those purposes arguably help meet “the nutritional needs of school-aged children in the state.” States could reduce spending on meals by taking steps such as serving only lunch, shrinking portions, eliminating many nutrition requirements, or restricting free meals to the very poorest children (such as those below half the poverty line). States could then divert the freed-up funds to a variety of activities. Some of those possible activities might be detrimental to children’s health, such as providing vouchers so students could buy meals from local fast-food restaurants.
The TANF block grant shows vividly that block grants can allow states to shift spending away from a program’s core purposes. Since the start of that block grant — the purpose of which is to prepare recipients for work and provide a safety net for those who can’t work — states have redirected much of their state and federal TANF funds to other purposes. States now spend only slightly more than one-quarter of their combined federal and state TANF funds on basic assistance to meet the essential needs of families with children, and just another quarter on child care for low-income families and activities to connect TANF families to work.[5] They spend the rest on other services, including programs not aimed at improving poor families’ work opportunities or helping families meet basic needs.
Reduction in State Investments in Low-Income Children
More than 90 percent of federal spending on the school meal programs goes to providing meals to low-income children. The rest covers state and federal program administration and modest subsidies for meals served to children whose family income isn’t low enough to qualify for free or reduced-price meals. Under the block grant, states would be free to use federal funds to replace state investments in children’s nutrition, reducing overall investments in children’s health.
Although the proposal ostensibly includes a state matching requirement, it would in no way prevent a sharp reduction in state investments in children’s nutrition. The bill’s only description of the state match reads as follows: “Each State that receives a grant under this subsection shall provide funds from non-Federal sources (which may be provided in cash, commodities, or in kind) to support the activities under this subsection.” Because the bill says nothing about how much the state must contribute and allows contributions in the form of agriculture commodities or other in-kind support, even minimal contributions of funding or in-kind support would meet the requirement, including any one of the following:
- The state posted an announcement on the web encouraging local farmers to sell produce to school districts.
- A single school district covered the cost of a nutrition fair.
- The state included nutrition education teachers in its credential programs.
- A school district offered a cooking demonstration for parents.
- A school hosted a healthy potluck for families.
The bill limits state spending on administration or outreach to 10 percent of the state’s block grant allocation. Currently, less than 2 percent of school meal expenditures nationwide go for state administrative expenses; no state spends more than 5 percent. Thus, the block grant structure would likely increase spending on program administration and allow states to redirect funds now spent on meals to cover administrative costs.
Moreover, the block grant proposal does not require a state to spend a certain portion of its funds on low-income children. Thus, a state could divert a substantial amount of the federal funds away from meals for low-income children.
Again, TANF offers a cautionary example. Some states have used their TANF block grant to fill budget holes and fund services for families, including some that are not low income. In some cases, states have withdrawn state funding previously spent on TANF’s core purposes and effectively shifted it to other uses, such as highways and tax cuts.[6]
Loss of Safeguards for Children
The House bill requires states to offer one healthy and affordable meal to each student on each school day but does not define “healthy” or “affordable.” Thus, it would allow a state to abandon the programs’ science-based nutrition standards, which help ensure that school meals provide the nutrition that students need for healthy development. Moreover, the bill prohibits the Agriculture Department, which oversees the school meal programs, from establishing any nutrition requirements or disapproving a state’s application to participate in the block grant as long as the state provides assurances that it will provide healthy meals and support maximum participation by students.
States would be free to set program rules regarding eligibility, meal offerings, and program operations. Program safeguards — regarding food safety, who is eligible for free meals, the quantity and nutritional quality of the food provided, and avoiding overt identification of children qualifying for free or reduced-price meals — would disappear. States could, for example, contract with a fast-food company to operate the school meal programs statewide or eliminate the breakfast program in middle and high schools in order to expand offerings in elementary schools.
Loss of Support for Expanding Meal Programs
Under the current funding structure, school districts can count on funding when they improve programs to better meet their students’ needs. Under the proposed block grant, if a school wanted to begin serving breakfast, no additional funds would be available.
School districts have learned that the way in which they offer breakfast can have a substantial impact on how many students participate. For example, offering a bagged breakfast that students can take to class or serving breakfast in the classroom boosts participation. In turn, higher participation improves student achievement, diets, and behavior. But under a block grant, school districts might not have the resources to make such improvements.
Similarly, under a block grant, school districts offering meals during the summer under the National School Lunch Program’s “Seamless Summer Option”[7] would not receive additional funding to provide additional summer feeding sites. To serve more neighborhoods, they would likely have to apply for separate funding under the regular Summer Food Service Program, an administrative burden that the Seamless Summer Option is designed to eliminate. Since the block grant doesn’t require school districts to offer any meals during the summer, they could stop offering meals altogether during the summer to help compensate for the drop in federal funding.
Loss of School Districts’ Discretion
School districts now manage the school meal programs within federal parameters, but under the proposed block grant, decision-making would shift to states. For example, in applying for a block grant, a state would set the meal prices for students who do not qualify for free or reduced-price meals, which is currently a school district decision. States would not have to give school districts or local communities a voice in key decisions regarding structuring the meal programs under the block grant. State officials might not share the priorities of local communities and would be free to prioritize budgetary — or even political — concerns over children’s health. For example, a state could shut down a breakfast program in a marginal community in order to divert resources to a program with more political clout. Or a state could provide higher reimbursements in urban school districts to compensate for their higher labor and food costs, and finance them by lowering reimbursements to rural school districts.
Conclusion
The school meal programs have a long and successful record. There is no reason to start unraveling them by converting them into a block grant, which would compromise schools’ ability to feed low-income children healthy meals.
| TABLE 1 | ||||
|---|---|---|---|---|
| Immediate Funding Cut if Proposed Block Grant Were Implemented in 2016 | ||||
| Statea | Fiscal Year 2015 Funding Levelb | Block Grant Amountc | Immediate Cut | Immediate Percentage Cut |
| Alabama | $305,585,353 | $287,596,610 | $(17,988,743) | -6% |
| Alaska | $49,424,521 | $47,122,153 | $(2,302,369) | -5% |
| Arizona | $385,487,564 | $364,490,596 | $(20,996,969) | -5% |
| Arkansas | $197,070,512 | $186,193,205 | $(10,877,308) | -6% |
| California | $2,094,334,085 | $1,997,309,606 | $(97,024,479) | -5% |
| Colorado | $193,086,465 | $176,198,684 | $(16,887,780) | -9% |
| Connecticut | $136,069,834 | $122,544,173 | $(13,525,661) | -10% |
| Delaware | $51,099,639 | $47,256,729 | $(3,842,910) | -8% |
| District of Columbia | $39,951,467 | $38,666,842 | $(1,284,625) | -3% |
| Florida | $1,071,270,935 | $1,023,949,252 | $(47,321,682) | -4% |
| Georgia | $741,764,122 | $700,757,172 | $(41,006,950) | -6% |
| Hawaii | $61,056,728 | $55,511,100 | $(5,545,628) | -9% |
| Idaho | $77,650,939 | $70,936,285 | $(6,714,654) | -9% |
| Illinois | $641,613,046 | $607,827,612 | $(33,785,434) | -5% |
| Indiana | $369,294,414 | $332,842,663 | $(36,451,750) | -10% |
| Iowa | $144,256,537 | $122,889,734 | $(21,366,803) | -15% |
| Kansas | $151,260,305 | $135,605,107 | $(15,655,198) | -10% |
| Kentucky | $306,502,383 | $289,451,143 | $(17,051,240) | -6% |
| Louisiana | $316,387,685 | $299,130,065 | $(17,257,620) | -5% |
| Maine | $49,751,879 | $45,124,687 | $(4,627,192) | -9% |
| Maryland | $248,699,788 | $230,595,593 | $(18,104,195) | -7% |
| Massachusetts | $251,515,432 | $228,789,292 | $(22,726,140) | -9% |
| Michigan | $426,313,996 | $396,433,696 | $(29,880,300) | -7% |
| Minnesota | $227,283,870 | $192,057,741 | $(35,226,129) | -15% |
| Mississippi | n/a | n/a | n/a | n/a |
| Missouri | $310,683,369 | $284,099,200 | $(26,584,169) | -9% |
| Montana | $39,314,162 | $35,273,984 | $(4,040,178) | -10% |
| Nebraska | $100,680,174 | $87,267,932 | $(13,412,242) | -13% |
| Nevada | $139,010,222 | $133,043,595 | $(5,966,628) | -4% |
| New Hampshire | $32,673,293 | $27,411,501 | $(5,261,792) | -16% |
| New Jersey | $368,543,308 | $339,566,539 | $(28,976,769) | -8% |
| New Mexico | n/a | n/a | n/a | n/a |
| New York | $964,617,370 | $908,207,515 | $(56,409,855) | -6% |
| North Carolina | $552,238,435 | $$522,089,427 | $(30,149,008) | -5% |
| North Dakota | $29,087,806 | 22,744,757 | $(6,343,049) | -22% |
| Ohio | $513,822,562 | $473,501,727 | $(40,320,835) | -8% |
| Oklahoma | $236,200,003 | $220,327,267 | $(15,872,736) | -7% |
| Oregon | $164,027,565 | $154,630,744 | $(9,396,821) | -6% |
| Pennsylvania | $509,013,887 | $463,906,330 | $(45,107,557) | -9% |
| Rhode Island | $42,559,176 | $39,513,944 | $(3,045,232) | -7% |
| South Carolina | $299,485,644 | $283,049,669 | $(16,435,975) | -5% |
| South Dakota | $39,747,527 | $33,961,360 | $(5,786,167) | -15% |
| Tennessee | $397,356,179 | $377,233,822 | $(20,122,358) | -5% |
| Texas | $2,113,314,663 | $1,995,501,192 | $(117,813,471) | -6% |
| Utah | $134,737,412 | $116,983,652 | $(17,753,760) | -13% |
| Vermont | $23,518,634 | $21,020,741 | $(2,497,893) | -11% |
| Virginia | $321,287,722 | $290,641,742 | $(30,645,980) | -10% |
| Washington | $272,546,057 | $253,057,659 | $(19,488,398) | -7% |
| West Virginia | $118,868,204 | $109,444,721 | $(9,423,483) | -8% |
| Wisconsin | $243,542,602 | $216,581,784 | $(26,960,818) | -11% |
| Wyoming | $20,435,461 | $17,552,739 | $(2,882,722) | -14% |
| US d | $16,531,011,815 | $15,432,644,287 | $(1,098,367,528) | -7% |
| TABLE 2 | ||||
|---|---|---|---|---|
| Funding Cut in Third Year if Proposed Block Grant Had Been Implemented in 2008 | ||||
| Statea | Actual Funding in Third Year (2010) | Block-Grant Funding in Third Yearb | Third-Year Funding Cut Under Block Grant | Third Year Funding Cut as Percentage |
| Alabama | $258,942,164 | $197,911,947 | $(61,030,216) | -24% |
| Alaska | $37,812,488 | $29,004,372 | $(8,808,116) | -23% |
| Arizona | $318,401,131 | $227,327,969 | $(91,073,162) | -29% |
| Arkansas | $166,943,206 | $130,319,998 | $(36,623,207) | -22% |
| California | $1,804,731,694 | $1,354,774,621 | $(449,957,072) | -25% |
| Colorado | $153,503,304 | $101,359,461 | $(52,143,842) | -34% |
| Connecticut | $107,653,421 | $77,294,148 | $(30,359,273) | -28% |
| Delaware | $35,394,118 | $22,919,269 | $(12,474,849) | -35% |
| District of Columbia | $26,887,922 | $19,591,462 | $$(7,296,460) | -27% |
| Florida | $809,335,323 | $561,079,985 | $(248,255,338) | -31% |
| Georgia | $604,901,559 | $451,118,677 | $(153,782,882) | -25% |
| Hawaii | $45,067,487 | $32,513,732 | $(12,553,756) | -28% |
| Idaho | $67,648,409 | $46,859,807 | $(20,788,602) | -31% |
| Illinois | $500,511,030 | $370,901,783 | $(129,609,247) | -26% |
| Indiana | $294,872,820 | $190,516,212 | $(104,356,607) | -35% |
| Iowa | $118,377,871 | $79,327,078 | $(39,050,793) | -33% |
| Kansas | $121,290,706 | $82,519,758 | $(38,770,948) | -32% |
| Kentucky | $237,226,420 | $177,587,522 | $(59,638,898) | -25% |
| Louisiana | $267,222,057 | $210,200,040 | $(57,022,017) | -21% |
| Maine | $44,226,722 | $30,011,573 | $(14,215,149) | -32% |
| Maryland | $174,267,232 | $122,051,398 | $(52,215,835) | -30% |
| Massachusetts | $195,661,827 | $139,970,696 | $(55,691,132) | -28% |
| Michigan | $373,078,862 | $258,558,116 | $(114,520,746) | -31% |
| Minnesota | $181,366,745 | $119,272,963 | $(62,093,782) | -34% |
| Mississippi | n/a | n/a | n/a | n/a |
| Missouri | $254,877,274 | $177,236,167 | $(77,641,106) | -30% |
| Montana | $33,332,602 | $22,843,796 | $(10,488,806) | -31% |
| Nebraska | $76,925,704 | $51,807,654 | $(25,118,050) | -33% |
| Nevada | $89,675,932 | $68,647,410 | $(21,028,522) | -23% |
| New Hampshire | $29,726,509 | $17,217,959 | $(12,508,549) | -42% |
| New Jersey | $272,830,128 | $190,511,937 | $(82,318,191) | -30% |
| New Mexico | n/a | n/a | n/a | n/a |
| New York | $788,167,241 | $617,018,988 | $(171,148,253) | -22% |
| North Carolina | $443,521,351 | $337,129,096 | $(106,392,255) | -24% |
| North Dakota | $22,576,312 | $15,756,852 | $(6,819,461) | -30% |
| Ohio | $431,056,791 | $294,395,593 | $(136,661,198) | -32% |
| Oklahoma | $205,289,205 | $155,338,676 | $(49,950,528) | -24% |
| Oregon | $140,524,318 | $116,468,571 | $(24,055,747) | -17% |
| Pennsylvania | $406,695,144 | $281,950,927 | $(124,744,217) | -31% |
| Rhode Island | $34,815,107 | $28,100,501 | $(6,714,606) | -19% |
| South Carolina | $254,870,206 | $185,169,661 | $(69,700,545) | -27% |
| South Dakota | $34,231,122 | $24,415,089 | $(9,816,033) | -29% |
| Tennessee | $305,296,526 | $223,209,087 | $(82,087,440) | -27% |
| Texas | $1,682,882,274 | $1,195,924,895 | $(486,957,379) | -29% |
| Utah | $110,014,060 | $72,004,517 | $(38,009,544) | -35% |
| Vermont | $19,949,570 | $13,515,889 | $(6,433,680) | -32% |
| Virginia | $261,691,856 | $181,490,597 | $(80,201,260) | -31% |
| Washington | $228,664,569 | $163,339,401 | $(65,325,168) | -29% |
| West Virginia | $82,767,787 | $64,417,309 | $(18,350,477) | -22% |
| Wisconsin | $196,206,594 | $127,011,401 | $(69,195,192) | -35% |
| Wyoming | $17,732,243 | $11,641,390 | $(6,090,853) | -34% |
| US | $13,369,644,937 | $9,669,555,948 | $(3,700,088,989) | -28% |
| TABLE 3 | |||
|---|---|---|---|
| Number of Low-Income Children for Whom Funding Would Not Have Been Available if the Proposed Block Grant Had Been Implemented in 2008 and States Addressed the Funding Reduction by Serving Fewer Children | |||
| Statea | Number of Participating Children Prior to Block Grantb | Number of Participating Children in Third Yearc | Number of Children for Whom Funding Would Not Have Been Provided Under Block Grant |
| Alabama | 361,184 | 390,936 | 29,752 |
| Alaska | 34,882 | 36,698 | 1,816 |
| Arizona | 406,621 | 477,392 | 70,772 |
| Arkansas | 232,227 | 248,510 | 16,283 |
| California | 2,242,431 | 2,574,383 | 331,952 |
| Colorado | 189,115 | 228,237 | 39,121 |
| Connecticut | 141,926 | 153,351 | 11,425 |
| Delaware | 42,089 | 51,434 | 9,345 |
| District of Columbia | 36,049 | 38,423 | 2,374 |
| Florida | 997,637 | 1,172,135 | 174,498 |
| Georgia | 765,167 | 858,561 | 93,394 |
| Hawaii | 41,596 | 64,043 | 22,448 |
| Idaho | 85,931 | 98,936 | 13,005 |
| Illinois | 720,601 | 776,175 | 55,574 |
| Indiana | 338,714 | 425,180 | 86,466 |
| Iowa | 144,423 | 160,225 | 15,802 |
| Kansas | 163,112 | 184,369 | 21,257 |
| Kentucky | 316,006 | 335,848 | 19,841 |
| Louisiana | 384,822 | 412,240 | 27,419 |
| Maine | 53,923 | 62,650 | 8,727 |
| Maryland | 217,032 | 254,159 | 37,126 |
| Massachusetts | 248,204 | 276,170 | 27,966 |
| Michigan | 499,050 | 593,883 | 94,833 |
| Minnesota | 223,063 | 258,641 | 35,578 |
| Mississippi | n/a | n/a | n/a |
| Missouri | 326,141 | 364,772 | 38,631 |
| Montana | 41,044 | 46,282 | 5,238 |
| Nebraska | 101,470 | 110,337 | 8,867 |
| Nevada | 120,324 | 128,471 | 8,147 |
| New Hampshire | 32,729 | 39,625 | 6,896 |
| New Jersey | 320,844 | 393,375 | 72,531 |
| New Mexico | n/a | n/a | n/a |
| New York | 1,131,162 | 1,145,549 | 14,386 |
| North Carolina | 584,148 | 633,426 | 49,279 |
| North Dakota | 27,625 | 28,947 | 1,323 |
| Ohio | 557,790 | 645,514 | 87,724 |
| Oklahoma | 275,924 | 301,649 | 25,725 |
| Oregon | 191,179 | 210,272 | 19,092 |
| Pennsylvania | 523,720 | 577,031 | 53,311 |
| Rhode Island | 49,267 | 52,676 | 3,409 |
| South Carolina | 324,506 | 348,320 | 23,814 |
| South Dakota | 44,977 | 48,128 | 3,151 |
| Tennessee | 365,986 | 474,050 | 108,064 |
| Texas | 2,182,771 | 2,421,323 | 238,552 |
| Utah | 132,725 | 159,585 | 26,860 |
| Vermont | 23,437 | 26,324 | 2,887 |
| Virginia | 324,337 | 374,860 | 50,523 |
| Washington | 300,095 | 340,233 | 40,137 |
| West Virginia | 115,900 | 119,988 | 4,088 |
| Wisconsin | 239,265 | 276,785 | 37,519 |
| Wyoming | 21,775 | 25,043 | 3,268 |
| US | 17,244,946 | 19,425,143 | 2,180,197 |
| TABLE 4 | ||
|---|---|---|
| Examples of Impact of Funding Cut if Proposed Block Grant Had Been Implemented in 2008 | ||
| State a | Third-Year Funding Cut Exceeds Spending on Entire Breakfast Program b | Third Year Funding Cut if Taken as Cut in Per-Lunch Reimbursement |
| Alabama | Yes | -$0.62 |
| Alaska | Yes | -$0.99 |
| Arizona | Yes | -$0.82 |
| Arkansas | No | -$0.63 |
| California | Yes | -$0.77 |
| Colorado | Yes | -$0.79 |
| Connecticut | Yes | -$0.59 |
| Delaware | Yes | -$0.86 |
| District of Columbia | Yes | -$0.93 |
| Florida | Yes | -$0.91 |
| Georgia | Yes | -$0.71 |
| Hawaii | Yes | -$0.70 |
| Idaho | Yes | -$0.77 |
| Illinois | Yes | -$0.66 |
| Indiana | Yes | -$0.77 |
| Iowa | Yes | -$0.59 |
| Kansas | Yes | -$0.68 |
| Kentucky | Yes | -$0.66 |
| Louisiana | No | -$0.59 |
| Maine | Yes | -$0.77 |
| Maryland | Yes | -$0.75 |
| Massachusetts | Yes | -$0.61 |
| Michigan | Yes | -$0.79 |
| Minnesota | Yes | -$0.61 |
| Mississippi | n/a | n/a |
| Missouri | Yes | -$0.72 |
| Montana | Yes | -$0.72 |
| Nebraska | Yes | -$0.64 |
| Nevada | Yes | -$0.65 |
| New Hampshire | Yes | -$0.68 |
| New Jersey | Yes | -$0.70 |
| New Mexico | n/a | n/a |
| New York | Yes | -$0.57 |
| North Carolina | Yes | -$0.66 |
| North Dakota | Yes | -$0.50 |
| Ohio | Yes | -$0.75 |
| Oklahoma | No | -$0.70 |
| Oregon | No | -$0.48 |
| Pennsylvania | Yes | -$0.65 |
| Rhode Island | Yes | -$0.51 |
| South Carolina | Yes | -$0.81 |
| South Dakota | Yes | -$0.56 |
| Tennessee | Yes | -$0.74 |
| Texas | Yes | -$0.87 |
| Utah | Yes | -$0.66 |
| Vermont | Yes | -$0.71 |
| Virginia | Yes | -$0.66 |
| Washington | Yes | -$0.72 |
| West Virginia | No | -$0.56 |
| Wisconsin | Yes | -$0.70 |
| Wyoming | Yes | -$0.65 |
| US | -$0.70 | |
End Notes
[1] H.R. 5003, Improving Child Nutrition and Education Act of 2016, Section 109, approved by the House Committee on Education and the Workforce on May 18, 2016, http://edworkforce.house.gov/uploadedfiles/ans_h.r._5003.pdf.
[2] The block grant funding level would also include: the amount provided to cover state administrative costs for operating the school meal programs; the amount of funding provided through the Special Milk Program, which reimburses school districts for milk provided in schools that don’t offer meal programs; and Team Nutrition, which supports nutrition education for students and school nutrition administrators.
[3] The Congressional Budget Office (CBO) projects that the cost of the Thrifty Food Plan — the estimate of a bare-bones, nutritionally adequate diet that the Agriculture Department uses to calculate SNAP (food stamp) benefits will be 2.5 percent higher in June 2017 than in June 2016, 2.4 percent higher the following June, and then 2.2 percent higher annually for each of the next four years. See Supplemental Nutrition Assistance Program, March 2016 Baseline, https://www.cbo.gov/sites/default/files/51312-2016-03-SNAP1.pdf. CBO’s projections for overall inflation over this period are very similar.
[4] The 28 percent estimate is based on national spending. The reduction for individual states would have ranged from 17 percent to 42 percent, with a 29 percent reduction in the median state.
[5] See Liz Schott, LaDonna Pavetti, and Ife Floyd, “How States Use Federal and State Funds Under the TANF Block Grant,” Center on Budget and Policy Priorities, updated October 15, 2015, https://www.cbpp.org/research/family-income-support/how-states-use-federal-and-state-funds-under-the-tanf-block-grant.
[6] See Liz Schott, “Why TANF Is Not a Model for Other Safety Net Programs,” Center on Budget and Policy Priorities, June 6, 2016, https://www.cbpp.org/research/family-income-support/why-tanf-is-not-a-model-for-other-safety-net-programs.
[7] School districts also have the option of providing after-school snacks under the National School Lunch Program. It is unclear whether funding for such snacks would be included in the block grant, in which case the funding would be frozen, or excluded.
More from the Authors