Rising Federal Debt Should Not Shortchange Response to COVID-19 Crisis
Some policymakers have cited the growing national debt in opposing or delaying further efforts to relieve the health, humanitarian, and economic crises stemming from COVID-19. But it would be unwise and self-defeating to let debt concerns deter policymakers from taking needed steps to fight hardship and to bolster and then revive the economy. As former Congressional Budget Office Director Douglas Elmendorf [T1] said, “I think the idea that we should not let the debt constrain our response to the pandemic is exactly right.”[1] As Greg Mankiw, chairman of the Council of Economic Advisers for President George W. Bush, put it, “There are times to worry about the growing government debt. This is not one of them.” [2] Here’s why.
- The dollar amount of the federal debt has little or no economic significance. The standard measure for examining trends in debt over time is debt relative to the size of the economy — that is, debt as a percentage of gross domestic product (GDP) — because it accounts for factors that heavily affect the nation’s ability to handle debt, such as inflation, population growth, and productivity growth.
-
Additional measures to fight COVID-19 and reduce economic hardship will speed recovery, thereby lessening the rise in the debt-to-GDP ratio. Legislation to heal the economy costs money and so raises the debt ratio now, but to the extent that it increases GDP, such legislation shrinks the debt ratio. Under some circumstances, the debt ratio may eventually be lower than it would be under a less stimulative policy. Conversely, failing to pass legislation to heal the economy, passing legislation that does too little, or pivoting to austerity too soon would run up less debt now but leave the economy weaker for an extended period of time.
The cost of doing too little includes lost wages, lost jobs, and lost work experience. The latter can cause a lasting erosion of human capital, lowering productivity for years. Notably, these costs fall disproportionately on low-income households and people of color. Therefore, the size of the health, human, and economy-wide problem — not the level of the debt, or even of the debt ratio — should determine the size of the legislative response. As Federal Reserve Chairman Jerome Powell explained on May 13, “The record shows that deeper and longer recessions can leave behind lasting damage to the productive capacity of the economy. … Additional fiscal support could be costly, but worth it if it helps avoid long-term economic damage and leaves us with a stronger recovery.”[3]
- The pandemic-related budgetary costs are large but temporary. The debt ratio can’t grow forever without eventually risking harm to the economy, and the government already faced a long-term budget problem before COVID-19 hit. But while fighting the virus and recession will cause a one-time jump in the debt ratio, it may not substantially increase the long-run fiscal challenge. That’s because a temporary cost, even if very large, is just temporary, in contrast to permanent costs (such as permanent tax cuts), which add growing amounts to the debt every year, forever. So even though the debt ratio will grow in the short run, the long-term “fiscal gap” — a measure of the program cuts or revenue increases needed to keep the debt ratio the same at the end of a given period as at its beginning — may be only somewhat larger than before COVID-19 hit.
- There’s no magic number at which a debt ratio becomes dangerous. A debt ratio of 100 percent of GDP, which the nation will reach sometime in 2021 according to the Congressional Budget Office (CBO), is a striking round number but has no particular significance. Moreover, that particular measure — debt held by the public — is not the most comprehensive way to assess the nation’s debts. A more complete measure of the federal government’s financial position would also include its financial assets; a better measure of debt’s effect on the credit markets would also exclude debt held by the Federal Reserve. Neither of these measures will reach 100 percent of GDP or surpass their all-time highest levels any time in the next ten years, CBO projects, although both will grow substantially over the period.[4]
- Historically low interest rates are moderating the impact of higher debt. The inescapable cost of debt is debt service, or the interest that the government pays on its debt. Treasury interest rates are currently very low — and, in fact, negative in inflation-adjusted terms — and CBO projects them to stay below historical levels for more than a decade. As a result, even though the debt ratio is high, the interest-payment-to-GDP ratio is well below its peak levels of the 1980s and early 1990s. Moreover, low interest rates indicate that a growing debt is not overheating the economy or crowding out private-sector investment that could raise future productivity and incomes.
Debt Relative to Size of Economy Is Proper Measure for Examining Trends
Looking just at the dollar growth of debt from year to year misses three factors that heavily affect the degree to which a given level of debt could be a problem: inflation erodes the real value of the debt, the nation’s population continues to grow, and average incomes generally rise over time. Economists and budget analysts use the ratio of debt to GDP as the standard measure for examining trends over time because that ratio accounts for all three factors. A rising ratio means that debt is growing faster than the economy, while a shrinking ratio means the opposite.
What happens to the economy can affect the debt ratio even more than what happens to the dollar level of the debt, as the historical examples in the box show. For instance, in the 28 years following World War II, the debt grew by 42 percent in dollar terms but the economy grew by 552 percent, so the debt ratio plummeted from 106 percent of GDP to just 23 percent. This reinforces the point that a growing economy can be more important than a growing debt. (See box.)
Further Relief Measures Can Also Speed Recovery, Lessening Rise in the Debt Ratio
The coronavirus pandemic affects the debt ratio in three distinct ways. First, the business closures and other societal and individual actions to limit the virus’ spread significantly raise unemployment and shrink the economy. This raises the debt ratio by reducing its denominator (that is, GDP) for as long as the economy remains depressed. Second, the recession reduces tax revenues and increases spending for programs that respond automatically to worsening economic conditions, such as Medicaid and SNAP, thereby increasing the deficit. This raises the debt ratio by increasing the numerator (the debt), since the debt is the sum of all annual deficits.
Third, legislative actions to combat the pandemic’s health and economic effects have a more complex impact. Spending increases and tax reductions initially add to the budget deficit and the debt ratio, but the favorable economic effects of these measures will work in the opposite direction thereafter. More specifically, well-designed fiscal stimulus will put the economy on a higher recovery growth path with larger GDP, and the additional GDP will mean more revenues and less spending on safety-net programs than if policymakers enacted less (or no) stimulus. Both of these factors will limit the growth in the debt ratio. Under some circumstances, the debt ratio may eventually be lower than it would be under a less stimulative policy.[5]
The response to the Great Recession of 2007-2009 provides important lessons. The 2009 Recovery Act — the major fiscal stimulus enacted that year — directly added $836 billion to the deficit, not counting its offsetting feedback effects on the economy, according to CBO. But CBO also estimates that the Recovery Act increased full-time-equivalent employment by between 2.1 million and 11.6 million years during the recovery.[6] (A year of full-time-equivalent employment is 40 hours of employment per week for one year.) It was thus a valuable effort that improved many lives.
In fact, economists have generally concluded that the Recovery Act stimulus was too small and ended too soon. Misguided concerns about budget deficits and debt resulted in a premature turn toward fiscal austerity in 2010-2011, even though unemployment remained high. These concerns not only prevented policymakers from adopting further needed stimulus but encouraged them to impose deep cuts in non-defense appropriations. The result was a drag on growth that impeded the recovery and prolonged hardship.[7]
Policymakers should not repeat that mistake. As Goldman Sachs explained May 5, “A forceful fiscal response is necessary to help offset the human cost of the crisis. It is also justifiable on narrower economic grounds — the alternative would imply a sharp loss of productive capacity and with it the destruction of a substantial share of the fiscal base. Not only would this be much more damaging for national income, it is not clear that it would ultimately be better for government credit.”[8]
Because the length and depth of the current economic downturn remain very uncertain, policymakers should tie the duration and size of additional relief measures to economic conditions rather than to an arbitrary calendar date. For example, measures to reduce hardship and keep the economy from sinking further now, and to stimulate a recovery once it is safe to do so[T2] , should remain in place until the unemployment rate is clearly falling and nears pre-crisis levels. In some cases, the amount of assistance provided could be tied to a state’s unemployment rate. This approach would automatically expand or shrink the amount of assistance as appropriate and avoid ending fiscal stimulus prematurely or continuing it when no longer needed.[9]
The costs of an inadequate fiscal response to the pandemic and recession include lost wages, lost jobs, and lost work experience, and these costs appear even more concentrated on the economically vulnerable in this recession than in previous ones. People of color are experiencing disproportionately more infections and hospitalizations — and among Black people, highly disproportionate death rates — likely due to structural inequities in health and its social determinants, such as access to safe housing and adequate nutrition.[10] Job losses also appear to be concentrated in low-paid service-sector jobs, which cannot be performed remotely from home and are disproportionately performed by people of color, women, and immigrants. These groups also disproportionately perform essential front-line jobs such as transporting people and goods or producing and selling food, at increased risk to their health. Enacting additional policies to reduce the pandemic’s extent and costs would alleviate economic hardship, speed the recovery, possibly improve the economy’s long-run productivity, and thereby lessen the rise in the debt ratio.[11]
History Shows Economic Growth Can Lower Debt Ratio Despite Rising Debt
Economic growth benefits not only the nation overall but also, if sufficiently robust, the federal government’s financial position as measured by the debt ratio. For instance, President Franklin D. Roosevelt’s first term was much more expensive in dollar terms than Herbert Hoover’s and the debt rose almost twice as fast, but the debt ratio (which accounts for the state of the economy) more than doubled under Hoover while hardly rising during the New Deal’s first four years. The post-World War II economic boom also lowered the debt ratio despite rising debt levels.
Example 1: The Great Depression. The economy stood tall in 1929, but the Great Depression laid the economy low over the next four years; by 1933, unemployment stood at 25 percent and the economy had shrunk by 43 percent in nominal terms. Meanwhile, collapsing revenues and rising spending turned surpluses to deficits, with the debt rising 33 percent by 1933. The combination of rising debt and falling GDP raised the debt ratio from 17 percent of GDP in 1929 to 39 percent in 1933.
Example 2: The early New Deal. After Roosevelt’s inauguration in March 1933, he and Congress enacted programs to aid stricken farmers, create deposit insurance, directly employ the unemployed (e.g., through the Civilian Conservation Corps), and provide direct relief. Policymakers only partly offset the cost by raising income taxes on the wealthy. Over the next four years, the debt rose by 62 percent but the economy grew by 52 percent and the unemployment rate fell to about 15 percent. Because of the rapidly growing economy, the debt ratio rose only from 39 percent of GDP in 1933 to 41 percent in 1937.a
Example 3: The post-World War II boom. At the end 1946, the federal debt stood at $242 billion due to massive war-related spending, and the debt ratio stood at 106 percent of GDP, an all-time high. The budget was in deficit for 20 of the next 28 years, during which the debt rose by 42 percent, from $228 billion to $344 billion in 1974. But the economy grew a remarkable 552 percent over that period, so the debt ratio fell from 106 percent of GDP to 23 percent.
| Changing Debt, GDP, and Debt Ratios (in billions and percentages) | |||
|---|---|---|---|
| Federal fiscal yearb | Debt | GDP | Debt ratio |
| 1929 (before Great Depression started) | $16.9 | $101.5 | 17% |
| 1933 (trough of Great Depression) | 22.5 | 58.4 | 39% |
| change, % or percentage points (pts) | +33% | -42% | +22 pts |
| 1937 (after four years of New Deal) | 36.4 | 89.0 | 41% |
| change, % or percentage points (pts) | +62% | +52% | +2 pts |
| 1946 (just after World War II ended) | 242 | 228 | 106% |
| 1974 (modern low point of debt ratio) | 344 | 1,486 | 23% |
| change, % or percentage points (pts) | +42% | +552% | -83 pts |
a We chose 1937 for the symmetry of four years of contraction followed by four years of growth. But the debt was still 41 percent of GDP at the end of fiscal year 1941, two months before the United States entered World War II, even though the dollar level of debt had risen another 33 percent.
b Through 1976, the federal fiscal year started on July 1, six months earlier than the calendar year. Thereafter, the fiscal year starts on October 1.
Pandemic Response Costs Are Temporary, So They May Have a Modest Long-Term Impact
The legislation enacted so far to combat COVID-19 is costly, but its costs are temporary.[12] Over the long run, the legislation will cost less than, for example, the revenue losses from the 2017 tax cuts if those are made permanent (as the Trump Administration and congressional Republicans propose). This is even more true to the extent that the current legislation cushions the downturn and helps the economy recover more quickly and thoroughly.
It is widely understood that a nation’s debt ratio cannot keep growing forever, to great heights, without ultimately risking harm to the nation’s economy.[13] That understanding led to the concept of the “fiscal gap.” CBO explains that the fiscal gap is a single figure that “measures the change in spending or revenues that would be necessary to keep the ratio of debt to GDP the same at the end of a given period as at the beginning of the period.”[14]
Last fall, we calculated the 25-year fiscal gap — the spending and revenue changes needed to stabilize the debt at its 2019 level of 79 percent of GDP — at 1.5 percent of GDP.[15] If our calculations had factored in the legislation enacted to date to fight COVID-19, relieve hardship, and support the economy, we would have estimated a fiscal gap of 1.9 percent of GDP, all else equal. (CBO estimates that those four bills will cost $2.6 trillion, almost entirely in 2020 and 2021.) [RK3]
The increase in the fiscal gap associated with the legislation enacted so far — 0.4 percent of GDP — is not small, which is one reason why any such legislation needs to deliver good medical, human, and economic value. But 0.4 percent of GDP is much smaller than the Bush tax cuts enacted in 2001 and 2003, which cost nearly 2 percent of GDP in 2010, the year they were fully phased in.[16] It’s also smaller than what the Trump tax cuts enacted in 2017 will cost over 25 years if made permanent: roughly 0.7 percent of GDP. And the value to the nation of combating the pandemic’s medical, human, and economic costs almost certainly will far exceed the value of the Bush or Trump tax cuts,[17] which have mainly exacerbated the already high level of inequality.
These facts also suggest that the nation can handle the costs of further legislation to combat the disease and its harmful human and economic effects.[18]
No Special Significance to Any Particular Debt Ratio, Especially Since More Financially Meaningful Measurements of Debt Exist
Some observers are concerned about CBO’s new projection that the debt ratio will surpass 100 percent sometime in 2021 and 106 percent, the previous U.S. record, before the end of 2023.[19] But 100 percent has no inherent meaning; it only sounds important, like an NHL player scoring 50 goals in a season.[20]
Indeed, there is no evidence for any particular bright line between safe and unsafe levels of debt.[21] Earlier academic research purporting to show significant economic damage when debt exceeds 90 percent of GDP has been thoroughly discredited. Moreover, today’s very low real (inflation-adjusted) interest rates on new issues of Treasury securities suggest that the economy can support a higher debt-to-GDP ratio than was appropriate when the government faced much higher borrowing costs.[22]
All else being equal, a lower debt ratio is preferable because of the lower interest costs it carries (see below) and the additional flexibility it provides policymakers facing economic or financial crises. But all else is never equal. Lowering the debt ratio requires program cuts, tax increases, or both. That is why both the quantity and quality of deficit reduction are important: measures to reduce deficits should not harm disadvantaged individuals and households, increase poverty, inequality, or racial disparities, or cut programs that can boost future productivity.
It is also worth noting that there are other, more comprehensive ways to measure debt (as a percent of GDP) than the commonly used “debt held by the public,” and those other measures have not surpassed some magic number and are not at all-time highs (see Table 1). For instance, CBO and the Office of Management and Budget regularly estimate the debt held by the public minus the financial assets held by the federal government, such as the hundreds of billions in cash the Treasury customarily holds. At the end of 2019, those assets totaled $1.9 trillion, partly offsetting the $16.8 trillion in Treasury debt held by the public and reducing the 2019 debt ratio from 79.2 percent of GDP (if only debt is counted) to 70.2 percent. Many economists and budget analysts believe that debt net of financial assets is a superior measure.[23]
Another measure also removes the debt held by the Federal Reserve, which is fundamentally different from Treasury debt held by the private sector or foreign governments. Specifically, the Fed’s purchase of Treasury debt offsets any crowding out of private-sector activity that the Treasury’s borrowing might have caused, and the Fed remits its net profits each year to the Treasury, so much of the interest payments the Treasury pays to the Fed are then returned to the Treasury. As a result, the Treasury debt held by the Fed cannot be considered a burden on government finances or the private sector.[24]
| TABLE 2 | |||||||||
|---|---|---|---|---|---|---|---|---|---|
| Government’s Financial Assets Partially Offset Its Debt | |||||||||
| as percentages of GDP, with CBO estimates for 2020, 2021, and 2030 | |||||||||
| 1946 | 1980 | 1990 | 2000 | 2010 | 2019 | 2020 | 2021 | 2030 | |
| Debt held by the public | 106.1 | 25.5 | 40.9 | 33.7 | 60.8 | 79.2 | 98.2 | 104.4 | 108.9 |
| less government net financial assets | 105.1 | 26.1 | 41.3 | 32.7 | 53.3 | 70.2 | 88.5 | 95.6 | 101.7 |
| and less debt held by the Fed | 94.6 | 21.7 | 37.3 | 27.6 | 47.8 | 60.2 | 60.6 | 67.9 | 80.2 |
In sum, even if the debt held by the public reaches an all-time high in the next year, other, more comprehensive measures of debt are not reaching all-time highs. And there seems to be no particular known level above which debt — however measured — starts causing special problems. This is one more reason that the fear of rising debt should not frighten policymakers into shortchanging the fight against medical and economic threats.
Low Interest Rates Moderate Impact of Higher Debt
Higher debt service costs are the direct way in which higher debt constitutes a burden, because interest costs compete for resources with government programs. But Treasury interest rates differ from era to era. In examining the cost of debt over time, it thus is more meaningful to examine the interest ratio — interest costs as a share of GDP — than the debt ratio.
Treasury interest rates are currently very low — so low, in fact, that inflation is expected to exceed them. And CBO projects Treasury rates to stay lower than historical levels for some time.[25] Low interest rates shrink the significance of government debt. To be clear, there are circumstances under which high and rising debt could lead the economy to overheat, and the idea that excessive debt could crowd out productive private-sector investments is standard economics. But low interest rates signify that neither of those is occurring now or projected to occur over the coming decade.
So, while interest costs compete with other public-sector needs, it would be self-defeating to cut important government programs now, and permanently, out of fear that growing interest costs may eventually squeeze them.
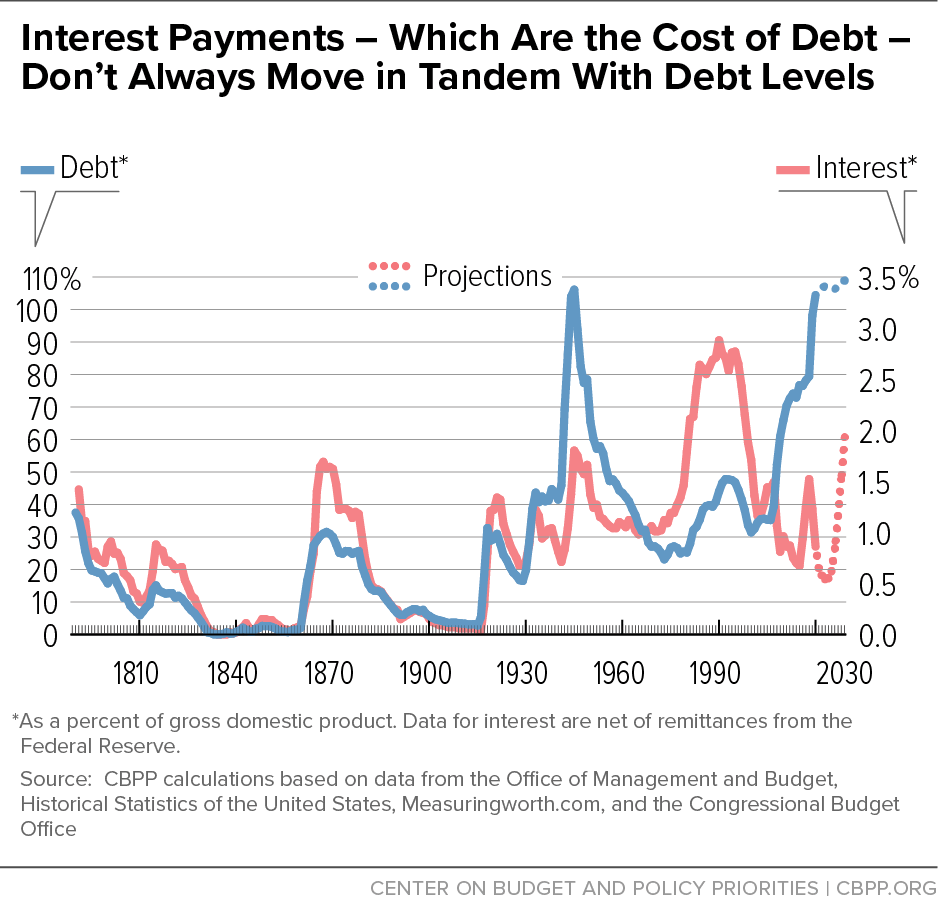
Figure 1 shows federal government debt held by the public and federal interest costs[26] as a percent of GDP. The figures for 2020 through 2030 are from CBO’s estimates of September 2[T4] [RK5] , 2020.[27] Three points stand out:
- Interest is related to debt, but not necessarily closely.
- Interest costs were highest not at the end of World War II, when debt reached a historic high, but rather in the 1980s and into the 1990s, because interest rates on outstanding Treasury debt were high then. Interest costs will rise when interest rates return to more normal levels but the new normal will likely be lower interest rates than the historical normal.
- Because interest rates are at historically low levels, interest payments are far below all-time highs as a percent of GDP. CBO expects interest costs to fall as a percent of GDP through 2024, notwithstanding growing debt, because Treasury interest rates have already fallen substantially and CBO expects them to remain quite low. [RK6] [RK7] [LG8]
Conclusion
In short, concern about debt should not shortchange the nation’s efforts to fight the coronavirus, care for those harmed by it and by the sudden and deep recession, and restore the economy to health when the situation allows. Starving the economy in the name of fighting debt would be shortsighted and self-defeating.
End Notes
[1] As quoted in Jim Tankersley, “Federal Borrowing Amid Pandemic Puts U.S. Debt on Path to Exceed World War II,” New York Times, September 2, 2020, https://www.nytimes.com/2020/09/02/business/us-federal-debt.html.
[2] Greg Mankiw, “Thoughts on the Pandemic,” March 13, 2020, http://gregmankiw.blogspot.com/2020/03/thoughts-on-pandemic.html.
[3] Jerome Powell, remarks at the Peterson Institute for International Economics, May 13, 2020, https://www.federalreserve.gov/newsevents/speech/powell20200513a.htm.
[4] Congressional Budget Office, “An Update to the Budget Outlook: 2020 to 2030,” September 2, 2020, https://www.cbo.gov/publication/56517.
[5] See research discussed in Chye-Ching Huang et al., “Putting the Size of the Needed COVID-19 Fiscal Response in Perspective,” Center on Budget and Policy Priorities, May 4, 2020, https://www.cbpp.org/research/federal-budget/putting-the-size-of-the-needed-covid-19-fiscal-response-in-perspective.
[6] Congressional Budget Office, Estimated Impact of the American Recovery and Reinvestment Act on Employment and Economic Output in 2014, February 2015, https://www.cbo.gov/sites/default/files/114th-congress-2015-2016/reports/49958-ARRA.pdf.
[7] Chad Stone, “Fiscal Stimulus Needed to Fight Recessions,” Center on Budget and Policy Priorities, April 16, 2020, https://www.cbpp.org/research/economy/fiscal-stimulus-needed-to-fight-recessions.
[8] Goldman Sachs, EM Macro Themes: “Post-Covid: Dealing with the EM Debt Overhang,” May 5, 2020.
[9] Chad Stone and Sharon Parrott, “Labor Market Conditions Should Determine Duration, Size of COVID-19 Relief Measures,” Center on Budget and Policy Priorities, April 13, 2020, https://www.cbpp.org/research/economy/labor-market-conditions-should-determine-duration-size-of-covid-19-relief-measures.
[10] Erica Williams and Cortney Sanders, “3 Principles for an Anti-Racist, Equitable State Response to COVID-19 — and a Stronger Recovery,” Center on Budget and Policy Priorities, May 21, 2020, https://www.cbpp.org/research/state-budget-and-tax/3-principles-for-an-anti-racist-equitable-state-response-to-covid-19.
[11] Huang et al., op. cit.
[12] The four bills enacted to date in response to the epidemic are (1) the Coronavirus Preparedness and Response Supplemental Appropriations Act, 2020 (P.L. 116-123); (2) the Families First Coronavirus Response Act (P.L. 116-127); (3) the Coronavirus Aid, Relief, and Economic Security Act (the CARES Act, P.L. 116-136); and (4) the Paycheck Protection Program and Health Care Enhancement Act (P.L. 116-139).
[13] The United States borrows in dollars, which gives it more breathing room than nations that cannot borrow in their own currencies. Likewise, the United States has a multi-century history of honoring its debt obligations in full and on time, again giving it more breathing room than some other nations.
[14] CBO, The 2013 Long-Term Budget Outlook, September 17, 2013, p. 10, https://www.cbo.gov/publication/44521.
[15] Richard Kogan, Paul N. Van de Water, and Kathleen Bryant, “Long-Term Budget Outlook Has Improved Substantially Since 2010 But Remains Challenging,” Center on Budget and Policy Priorities, October 10, 2019, https://www.cbpp.org/research/federal-budget/long-term-budget-outlook-has-improved-substantially-since-2010-but-remains. Technically, a 25-year fiscal gap equals a) the present value of the needed reduction in primary (non-interest) deficits over the 25-year period, divided by b) the present value of GDP over that period. Using present values accounts for the fact that deficit reduction earlier in the 25-year period generates interest savings (debt service savings) over a longer period.
[16] Emily Horton, “The Legacy of the 2001 and 2003 ‘Bush’ Tax Cuts,” Center on Budget and Policy Priorities, updated October 23, 2017, https://www.cbpp.org/research/federal-tax/the-legacy-of-the-2001-and-2003-bush-tax-cuts.
[17] Horton, op cit. Also see Chye-Ching Huang, “Fundamentally Flawed 2017 Tax Law Largely Leaves Low- and Moderate-Income Americans Behind,” testimony before the House Budget Committee, February 27, 2019, https://www.cbpp.org/federal-tax/fundamentally-flawed-2017-tax-law-largely-leaves-low-and-moderate-income-americans.
[18] See “Greenstein: New COVID-19 Bill Helpful But Inadequate — More Needed for States and Localities, the Most Vulnerable, and the Economy,” Center on Budget and Policy Priorities, April 21, 2020, https://www.cbpp.org/press/statements/greenstein-new-covid-19-bill-helpful-but-inadequate-more-needed-for-states-and.
[19] CBO, September 2020, op cit.
[20] The National Hockey League’s season has twice ended prematurely (this season and the 2012-2013 season), both times depriving the Washington Capitals’ Alex Ovechkin of reaching 50 goals in that season; had he done so, he’d now have ten 50-goal seasons, breaking the record of nine shared by Wayne Gretzky and Mike Bossy.
[21] Chad Stone, “From a Deficit to a Surplus and Back Again,” US News & World Report, April 25, 2013, https://www.usnews.com/opinion/blogs/economic-intelligence/2013/04/25/debt-economic-growth-relationship; Chad Stone, “International Evidence Provides Poor Guide for U.S. Budget Policy,” Center on Budget and Policy Priorities, March 21, 2011, https://www.cbpp.org/blog/international-evidence-provides-poor-guide-for-us-budget-policy; Andrea Pescatori, Damiano Sandri, and John Simon, “Debt and Growth: Is There a Magic Threshold?” International Monetary Fund, February 2014, https://www.imf.org/external/pubs/ft/wp/2014/wp1434.pdf; and CBO, “Federal Debt, A Primer,” March 2020, p. 25, https://www.cbo.gov/publication/56309.
[22] In fact, real interest rates are currently negative. More generally, see Douglas Elmendorf and Louise Sheiner, “Federal Budget Policy with an Aging Population and Persistently Low Interest Rates,” Journal of Economic Perspectives, Vol. 31, No. 3, Summer 2017, pp. 175-194, https://pubs.aeaweb.org/doi/pdf/10.1257/jep.31.3.175; Olivier Blanchard, “Public Debt: Fiscal and Welfare Costs in a Time of Low Interest Rates,” PIIE Policy Brief 19-2, February 2019, https://www.piie.com/publications/policy-briefs/public-debt-fiscal-and-welfare-costs-time-low-interest-rates; and Jason Furman and Lawrence H. Summers, “Who’s Afraid of Budget Deficits? How Washington Should End Its Debt Obsession,” Foreign Affairs, March/April 2019, https://www.foreignaffairs.com/articles/2019-01-27/whos-afraid-budget-deficits.
[23] See, for example, CBO, Federal Debt, A Primer, March 2020, op cit.: “[D]ebt held by the public net of financial assets reflects the government’s overall financial condition more comprehensively than other measures can.” Also see Center on Budget and Policy Priorities, “Policy Basics: Deficits, Debt, and Interest,” updated July 29, 2020, https://www.cbpp.org/research/federal-budget/policy-basics-deficits-debt-and-interest.
[24] Goldman Sachs explains the point this way: “[E]very dollar used to purchase securities at auction by the Fed is a dollar that does not need to be borrowed from other investors.” Goldman Sachs, Macro Economics Research, US Daily: “Q&A on the Fed’s Balance Sheet,” January 19, 2017. CBO says, “An additional measure, which also excludes Treasury securities held by the Federal Reserve, better reflects the government’s overall effect on credit markets.” CBO, September 2020, op cit.
[25] CBO September 2020, op cit., shows the average rate on all outstanding Treasury securities dropping to 1.2 percent by 2025 before rising to 2.1 percent by 2030. And Olivier Blanchard recently wrote that “safe interest rates are likely to be even lower in the future than they were expected to be before the COVID-19 crisis. Precautionary saving is likely to be higher, and uncertainty is likely to hamper private investment; both imply a lower neutral rate for a long time to come.” See “‘Whatever It Takes.’ Getting into the Specifics of Fiscal Policy to Fight COVID-19,” Peterson Institute for International Economics, March 30, 2020, https://www.piie.com/blogs/realtime-economic-issues-watch/whatever-it-takes-getting-specifics-fiscal-policy-fight-covid.
[26] Figure 1 shows the net interest function of the federal budget minus Federal Reserve remittances to the Treasury of interest on the securities it holds because, as explained, those remittances offset much of the interest payments from the Treasury to the Fed.
[27] CBO September 2020, op cit.
More from the Authors

Areas of Expertise