Pell Grants — a Key Tool for Expanding College Access and Economic Opportunity — Need Strengthening, Not Cuts
For 45 years, the federal Pell Grant program has been the cornerstone of financial assistance for students from low- and moderate-income families, helping millions go to college. Pell Grants are awarded to students solely based on financial need and serve as the foundation of an eligible student’s financial aid package upon which other forms of aid are layered, including loans and state and institutional aid. Pell has been by far the single largest source of grants for postsecondary education, expanding college access and economic opportunity over the past 40 years. Last year alone (academic year 2015-16), Pell provided more than $28.5 billion to support 7.7 million students,[2] or nearly 40 percent of undergraduate students.[3]
By expanding college access, Pell Grants help narrow the postsecondary achievement gap between low- and moderate-income students and those of greater means. They boost college enrollment, reduce drop-out rates, and improve student outcomes. By enabling students to work less and take more courses, they also help accelerate graduation and improve college completion rates. Nor, despite widespread claims to the contrary, do Pell Grants do much if anything to fuel tuition increases at colleges. That is, in general, colleges don’t raise tuition on the assumption that Pell Grants will cushion the blow.
Despite their proven success, however, Pell Grants now cover a small and shrinking share of college costs for students who receive them. That’s true whether you compare Pell Grants to rising tuition and fees or you add room and board. Today, Pell covers just 29 percent of the average costs of tuition, fees, room, and board at public four-year colleges, its lowest level in more than 40 years and far below the 79 percent it covered in 1975. Rising college costs have outstripped the rate of general inflation, and Pell awards have not always kept pace even with general inflation. At public colleges, the rising cost of college in recent years has been due in large measure to state funding cuts that have forced larger tuition increases.
For most of their history, the President and Congress funded Pell Grants entirely through annual appropriations, which continue to provide 80 percent of Pell’s federal funding. But President George W. Bush and Congress created an additional funding piece in 2007, adding a “mandatory” source that’s funded through an authorizing law that remains in effect from year to year unless policymakers change it. President Obama and Congress expanded that mandatory source by enacting an automatic annual inflation adjustment in Pell Grants for five years so that they keep pace with overall inflation. In addition, Congress also periodically provides additional mandatory funding for Pell to supplement annual discretionary funding. This is because, due to the ebbs and flows of college enrollment, the program sometimes faces significant funding shortfalls (and sometimes builds up excess funds that carry over from one year to the next) that policymakers must address by providing additional funding or cutting the program by restricting eligibility or reducing the grant level.
Policymakers should consider funding Pell on the mandatory side of the budget.In funding the government for fiscal year 2017, the President and Congress took an important step when they restored a provision known as “year-round Pell,” which policymakers had eliminated in 2011 as a cost-saving measure and which will now allow more students to attend college during the summer and graduate more quickly. Policymakers can build on that important step by extending the annual inflation adjustment in Pell Grant levels, which is due to expire after the 2017-18 academic year; raise the maximum Pell Grant, which would help boost college attendance and completion; and look for further ways to promote college completion for Pell students by incentivizing both students and institutions to increase completion rates. Over the longer run, policymakers should consider funding Pell (which operates like an entitlement program, where all who are eligible and apply receive assistance) on the mandatory side of the budget, so that it automatically responds to increases and decreases in student enrollment without the need for congressional action.
What policymakers should not do is adopt the proposal from the Trump administration to cut carry-over balances by $4 billion and not use any of those balances to increase the maximum Pell Grant or strengthen Pell’s impact. (Unfortunately, the House Appropriations Committee has followed suit, cutting $3.3 billion from carry-over balances in 2018 on top of the $1.3 billion in cuts made in 2017.) Nor should they enact the House Republican proposal of recent years — included once again in the House Republican 2018 budget resolution — to eliminate all mandatory funding for the program. That would immediately reduce the maximum Pell Grant by more than $1,000 and, together with an end to the inflation adjustment, would sharply reduce Pell’s purchasing power. Because, as explained below, Pell eligibility is tied to the maximum grant level, hundreds of thousands of students would lose their Pell eligibility entirely and millions more would find themselves with significantly reduced grants. Moreover, eliminating the mandatory funding now available to supplement the annual discretionary appropriation would create a funding shortfall in the program in just a few years, forcing Congress either to find new resources or to cut eligibility.
The Basics
Pell provides need-based grants to undergraduate students who haven’t earned a bachelor’s degree and, unlike loans, students don’t need to repay them. The maximum award was $5,815 for the 2016-17 award year and is $5,920 for 2017-2018. Eligible students can use their grant at any of the approximately 5,100 participating accredited postsecondary institutions that receive such funds from the Education Department, but they must be enrolled for the purpose of getting a degree or certificate. Students can receive funds to attend only one school at any time.
Pell awards for students attending school part time are prorated accordingly. In 2008, the President and Congress limited Pell lifetime eligibility to 18 semesters, and in 2012 further reduced eligibility to 12 semesters.
Pell award amounts depend on a student’s Expected Family Contribution (EFC), the cost of attendance (COA) as determined by each institution (tuition, fees, room and board, books and supplies, computer, transportation, and dependent care), the student’s full- or part-time status, and the length of the academic program (whether it runs a full academic year or less).
To apply for Pell Grants, students file a Free Application for Federal Student Aid (FAFSA). The Education Department uses the information to determine the EFC, using a formula defined in the Higher Education Act. The difference between a student’s EFC and COA determines the student’s unmet need. The main factors driving the EFC are a family’s income, assets, and size, the number of family members in school, whether the student is a dependent (and, if so, must provide information about the parents) or independent (and, if so, need not provide parental information), and whether the student has dependents.[4] In the 2015-16 academic year, the most recent year for which data are available, independent students accounted for approximately half of Pell recipients and spending. (See Table 1.)
| TABLE 1 | |||||
|---|---|---|---|---|---|
| Pell Recipients, Expenditures, and Average Grant By dependency status, academic year 2015-16 |
|||||
| Recipients | Expenditures | Average Pell | |||
| Status | Number | Share | Dollars | Share | |
| Dependent | 3,610,000 | 47% | $14,506,278,000 | 51% | $4,018 |
| Independent with dependents | 2,380,000 | 31% | 5,735,575,000 | 20% | 3,495 |
| Independent without dependents | 1,670,000 | 22% | 8,317,071,000 | 29% | 3,435 |
| Total | 7,660,000 | 100% | $28,558,924,000 | 100% | $3,728 |
Public institutions account for more than two-thirds of Pell recipients and spending, followed by for-profit schools and private nonprofit schools. Four-year public institutions serve the largest number of Pell students (36 percent) and receive the most funds (39 percent). Community colleges serve slightly fewer students than public four-year institutions (32 percent) and receive 29 percent of Pell funding. (See Table 2.) A larger share of Pell students attend for-profit colleges than do students overall (17 percent vs. 7 percent).[5]
| TABLE 2 | |||||
|---|---|---|---|---|---|
| Pell Recipients, Expenditures, and Average Grant By control and type of institution, academic year 2015-16 |
|||||
| Recipients | Expenditures | Average Pell | |||
| Institution type | Number | Share | Dollars | Share | |
| Public | 5,204,000 | 68% | $19,270,606,000 | 68% | $3,703 |
| Public 4-Year | 2,748,000 | 36% | 11,014,954,000 | 39% | 4,008 |
| Public 2-Year | 2,456,000 | 32% | 8,255,651,000 | 29% | 3,325 |
| For-Profit | 1,306,000 | 17% | 4,719,838,000 | 17% | 3,615 |
| Nonprofit | 1,151,000 | 15% | 4,568,480,000 | 16% | 3,970 |
| Total | 7,660,000 | 100% | $28,558,924,000 | 100% | $3,728 |
What Pell Achieves
Pell Grants are very well targeted to the neediest students, providing the largest awards to the lowest-income students. More than half or 53 percent of all Pell recipients had family incomes below $20,000, 70 percent below $30,000, and 95 percent below $60,000.[6] (See Figure 1.) Moreover, 3 out of 4 recipients had no net family assets and more than 96 percent had less than $7,500. (A very small share of Pell recipients has incomes over $60,000; that’s because the EFC factors in several variables, such as whether several family members are attending college simultaneously or attending colleges with a higher COA.) Almost two-thirds of recipients (64 percent) had no EFC, more than half of whom had incomes of $24,000 or less and, therefore, automatically qualified for a zero EFC.[7]
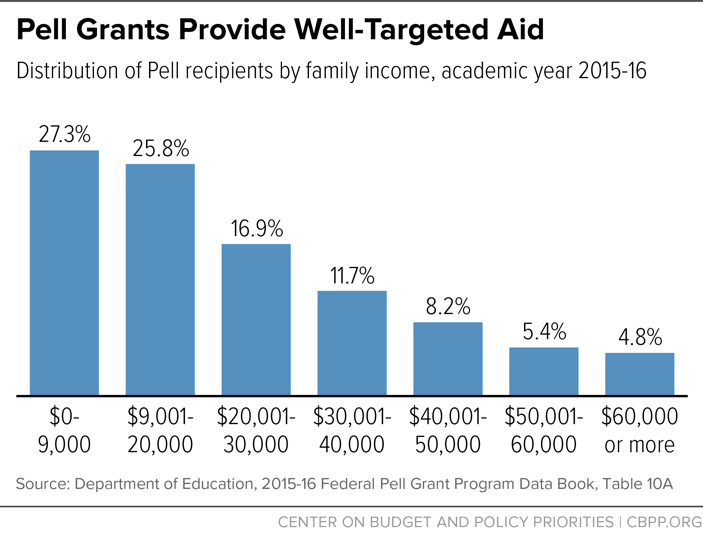
The distribution of Pell expenditures is also very well targeted, with 75 percent of Pell expenditures going to students with incomes of $30,000 or less. (See Table 3.)
| TABLE 3 | ||||
|---|---|---|---|---|
| Pell Recipients, Expenditures, and Average Grant By income level, academic year 2015-16 |
||||
| Income | Recipients | Expenditures | Average Pell | Share of Pell |
| $0-9,000 | 2,092,000 | $8,554,928,000 | $4,089 | 30% |
| 9,001-20,000 | 1,975,000 | 7,723,367,000 | 3,910 | 27% |
| 20,001-30,000 | 1,292,000 | 5,074,722,000 | 3,928 | 18% |
| 30,001+ | 2,300,000 | 7,205,907,000 | 3,132 | 25% |
| Total | 7,660,000 | $28,558,924,000 | $3,728 | 100% |
Pell Grants play a critical role in expanding postsecondary opportunity for non-traditional and historically underserved populations, including older students and students who are parents. In the 2015-16 academic year, more than half (53 percent) of Pell recipients were financially independent[8] (e.g., 24 or older, or married), of whom 59 percent had dependent children. Almost half (45 percent) were older students (24 or older), who typically must manage work and, often, parenting responsibilities along with school. Almost 3 out of 4 Pell students (71 percent) were enrolled full time.[9]
Comparing the 41 percent of students who receive Pell to non-recipient students in the 2011-12 academic year (the most recent year for which data are available) shows that Pell students are more likely to be older, a member of a racial or ethnic minority group, financially independent, and a first-generation college student, and more likely to attend school full time and throughout the academic year. (See Table 4.)
| TABLE 4 | |||
|---|---|---|---|
| Characteristics of Pell Recipients vs. Other Students Academic year 2011-12 |
|||
| With Pell | Without Pell | Difference | |
| Age | |||
| 23 or younger | 51.4 | 59.6 | -8.2 |
| 24-29 | 21.9 | 16.1 | 5.8 |
| 30 or older | 26.7 | 24.4 | 2.3 |
| Race/ethnicity (excl. Puerto Rico) | |||
| White | 47.0 | 65.5 | -18.5 |
| Black | 24.1 | 10.4 | 13.7 |
| Hispanic | 19.4 | 13.7 | 5.7 |
| Asian/Pacific Islander | 5.0 | 6.9 | -1.9 |
| American Indian | 1.2 | 0.7 | 0.5 |
| Other or Two or more races | 3.3 | 2.8 | 0.5 |
| Attendance status | |||
| Full-time, full-year | 43.9 | 34.6 | 9.3 |
| Part-time or part-year | 56.1 | 65.4 | -9.3 |
| Dependency status | |||
| Dependent | 40.9 | 54.2 | -13.3 |
| Independent | 59.1 | 45.8 | 13.3 |
| Employment status | |||
| Not employed | 37.0 | 32.1 | 4.9 |
| Employed part time | 41.9 | 41.7 | 0.2 |
| Employed full time | 21.1 | 26.1 | -5 |
| Parental educational attainment | |||
| High school or less | 45.0 | 25.7 | 19.3 |
| Some postsecondary education | 29.4 | 27.2 | 2.2 |
| Bachelor’s degree or higher | 25.6 | 47.1 | -21.5 |
Pell students also take a larger course load, on average, and are somewhat less likely to work, particularly full time. That suggests that Pell Grants may help some students work less and focus on completing their degree or certificate programs. That’s important because research shows that those who work more than 15-20 hours per week and enroll part time are likelier to drop out of college.[10]
Pell assists a broad range of college students and, in fact, nearly 4 in 10 veterans attending college (38 percent) receive Pell.[11] For the distribution of Pell recipients and spending by state of institution, see Appendix A.
Need-based grants expand college access and advance academic success, a significant body of research shows, helping to narrow the postsecondary achievement gap based on income through higher college enrollment, persistence, and completion rates for lower- and middle-income students.[12]
- A $1,000 reduction in college costs — through either lower tuition or more grant aid — boosts enrollment by three to five percentage points, with lower-income students being more price sensitive, according to several studies.[13]
- A $1,000 increase in grant aid improves college retention rates by one to five percentage points, research also shows.[14] And recent studies in Florida and Wisconsin found that a $1,300 and $3,500 need-based grant led, respectively, to bachelor’s degree completion gains of 22 percent (over six years) and 29 percent (over four years).[15]
- From 1996 to 2004, when grant support to low-income students grew faster than tuition at lower-priced public colleges, due mainly to Pell Grant increases, college attendance rates among lower-income youth increased, a 2008 Brookings Institution report found.[16] Specifically, a cost decline of about $1,000 due to more grant aid for students from families with incomes below $30,000 was associated with a college attendance rate increase of six to seven percentage points immediately after high school. “Pell awards,” the report concluded, “are an important contributor to the positive impact of grant-induced declines in net prices on college-going.”[17]
- Pell had a significant effect on college enrollment among older adults, a 2002 study in The Journal of Human Resources concluded.[18] In particular, an examination of Current Population Survey microdata found that Pell’s introduction in the 1970s increased the probability of enrollment for eligible independent students ages 22 to 35 by 1.3 to 1.5 percentage points (relative growth of 16 percent for men and 40 percent for women), while changes to the definition of independent students in 1986 that restricted eligibility decreased the probability of attending college by about four percentage points for those who lost benefits.
Beyond promoting access to higher education, Pell also reduces college drop-out rates and strengthens student persistence and academic success:
- A $1,000 increase in Pell boosted retention by 1.5 percentage points, according to a 2011 study in Social Science Quarterly that used data from the nationally representative Beginning Postsecondary Study. [19]
- “Receiving a Pell Grant was positively associated with persevering and becoming transfer-ready,” for students intending to transfer, even after controlling for demographic, attendance status, and other factors, a 2009 MPR Associates study of California community college students found. Pell was also associated with other measures of academic success, such as transferring to a four-year institution or getting an associate’s degree or certificate.[20]
- Using student data from Ohio’s public institutions, a 2004 National Bureau of Economic Research paper found that a $1,000 increase in a student’s Pell Grant reduced the likelihood that he or she would withdraw by six to nine percentage points, suggesting “strongly that a Pell Grant reduces dropout rates.”[21]
Moreover, Pell helps students work less and take more courses. “[R]eceiving a modest Pell Grant instead of additional loans leads students to reduce labor supply and increase enrollment intensity,” a March 2017 study by researchers at Columbia University’s Community College Research Center shows.[22] The study focused on students enrolling in college from 2008 to 2010 at more than 20 community colleges and the differences between those who fell just below the Pell eligibility cutoff and received the $500 minimum Pell award and those who fell just above it and did not. The authors found that the Pell award to students just below the eligibility cutoff “increases the intensity of enrollment, with recipients 4-7 percentage points more likely to enroll full-time from the spring of their first year to the spring of their second year,” and earn less from work, due to shifting more of their time from work to school, compared to students just above the cutoff.[23]
Pell bolsters school completion as well. Using a national sample of full-time dependent students who enrolled in four-year degree programs in the 2003-04 academic year, a 2014 study by a University of Massachusetts (at Boston) researcher found that for every $1,000 dollar increase in Pell, lower-income students’ chances of getting a bachelor’s degree within six years rose by 3 percent.[24] “The results,” the study concludes, “show that for students coming from the lowest income backgrounds, need-based grants do have a large impact on their chances to graduate. In particular, federal and state need-based grants are found most influential, with [Pell] showing even slightly larger positive effects.”[25]
Finally, additional federal financial aid, including Pell Grants, accelerates graduation because students take more courses and their grades don’t suffer.[26] Using data from all Texas public institutions of higher education from academic years 2003-04 through 2013-14 tied to earnings records and focusing on older independent students (seniors who turn 24 during the academic year), a 2017 Upjohn Institute report examined what happened when a person received more aid as a result of becoming financially independent. It found that a Pell increase reduces the time that someone takes to earn a degree by increasing the number of credits taken without affecting his or her grades, especially for needier students.
At the same time, the debate over the “Bennett Hypothesis” continues. Since 1987, when then-Education Secretary William Bennett wrote that “If anything, increases in financial aid in recent years have enabled colleges and universities blithely to raise their tuitions, confident that Federal loan subsidies would help cushion the increase,”[27] many others have tied tuition increases to student aid increases[28] — despite the widespread evidence to the contrary, particularly with regard to public and nonprofit institutions that enroll more than 90 percent of all students:
- After reviewing research studies to examine whether there is a causal relationship between student aid and tuition increases, the nonpartisan Congressional Research Service concluded in 2014 that “clear evidence on the effects of aid on prices is seemingly not available” and “there is certainly no consensus on the existence, and certainly not the magnitude, of causal relationship between aid and price.” [29]
- In a comprehensive review of the research for the American Council on Education, focusing on the role of federal student aid, Don Heller, Dean of Michigan State University’s College of Education, concluded in 2013, “While any change in federal aid may be a very small piece of the puzzle that leads to year-to-year tuition increases, there is scant evidence that it is a major contributing factor,” and “there is little compelling evidence” to support the Bennett Hypothesis.[30]
Other research has reached the same conclusion.[31] Indeed, George Washington University researcher Stephanie Cellini summarized the available evidence this way, “My reading of the literature is that there is no compelling evidence of a causal relationship between federal student aid and tuition among public and nonprofit colleges. However, my own research on the for-profit sector suggests that for-profit institutions increase their costs to take in federal aid.”[32]
Pell’s Erosion
Despite the evidence that Pell lowers the net price of tuition for low- and moderate-income students and raises enrollment, persistence, and completion rates, Pell Grants now cover a shrinking share of college costs. That’s due to rising tuition costs — which, at public institutions, is tied to state funding cuts — as well as periods when Pell Grants didn’t keep pace with general inflation or tuition increases that generally outpace general inflation.[33]
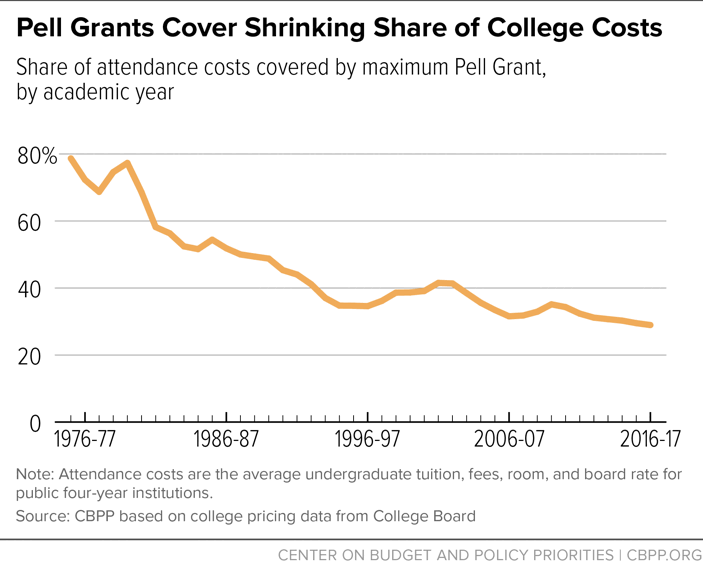
Unfortunately, the gap between college costs and Pell Grants has been gradually expanding since the Pell program was fully in effect in 1975. Whether comparing the maximum Pell Grant just to tuition and fees or including room and board, the picture is the same: Pell has failed to keep up with the rising cost of college and has shrunk to its lowest levels of purchasing power.
In the 2016-17 academic year, the maximum Pell Grant of $5,815 covered just 29 percent of the average cost of tuition, fees, room, and board at public four-year colleges, the lowest point since it covered almost 80 percent in 1975. In the past 15 years alone, the share of college costs covered by the maximum Pell Grant has fallen from 42 percent in 2001 to 29 percent in 2016. (See Figure 2.) The maximum grant covered just 60 percent of tuition and fees, also the lowest point in 40 years.[34]
While the Pell level is one side of the equation, the other is college costs, which have risen much faster than general inflation over the past 70 years.[35] Tuition rose four times faster than inflation from 1978 to 2012[36] and three times faster in the last decade.[37]
A key driver behind rising college prices are cuts in state funding for public four-year colleges and universities and community colleges, which have a large impact on the tuition bills that Pell students pay. More than 2 of 3 Pell recipients are enrolled in public colleges and universities — including four-year institutions and community colleges[38] — so the major cuts in state funding for higher education over the last two decades affect college affordability for most Pell students.
Between 1990 and 2009, inflation-adjusted state funding per student fell by 26 percent while inflation-adjusted tuition more than doubled (rising 116 percent) at public four-year colleges and universities and rose by 71 percent at community colleges.[39] State funding cuts accelerated rapidly during the Great Recession, when inflation-adjusted, per-student state funding dropped 25 percent from 2008 through 2012, hitting a low of $6,277 in 2012.[40]
Today, 44 states spend less per student (in inflation-adjusted terms) than they did before the recession — with the average inflation-adjusted reduction totaling 17 percent.[41] Consequently, tuition at four-year public colleges (after accounting for inflation) has risen by about $2,500, or 35 percent, since the 2007-08 academic year.[42] Over the same period, the maximum Pell Grant has only risen by roughly $800 (adjusting for inflation), so the gap between the Pell amount and college costs has grown almost $1,700 over this period for tuition alone.[43]
The large and growing gap means that Pell students must assume significantly more debt to attend the same school as higher income students. In 2012, nearly 90 percent of Pell four-year college graduates carried student debt, compared to 53 percent of non-Pell, four-year college graduates. Pell graduates of four-year colleges who took student loans finished college with an average of $31,200 in student debt, $4,750 more than the average debt burden of non-Pell graduates who also borrowed to attend college.[44]
Pell’s Federal Financing
For roughly its first three decades, Pell was financed entirely through annual appropriations (funds that the President and Congress provide each year through the appropriations process), with policymakers increasing the grant amount from time to time. Today, more than 80 percent of Pell funding continues to come through appropriations.
To raise the Pell Grant, however, President George W. Bush and Congress in 2007 added a mandatory funding piece, funded through an authorizing law (which remains in effect from year to year unless policymakers change it). President Obama and Congress later used that mandatory piece to enact an annual inflation adjustment in the grant over the 2013-2017 period so that inflation doesn’t lose value even faster. Under current law, however, that adjustment will end after the 2017-18 academic year. For the 2017-18 academic year, this mandatory funding finances $1,060 of the $5,920 maximum Pell Grant.
In addition, Congress has periodically provided additional mandatory funding to the Pell program to supplement the discretionary appropriation and address funding shortfalls. Currently, Pell receives $1.4 billion in such “ad hoc” funding; this will decline to $1.1 billion in 2021 and beyond. Without these funds, Congress either would have to provide more discretionary funds (which are in short supply due to cuts in this area of the budget), or cut the program by restricting eligibility or lowering the Pell award.
Although, as noted, more than 80 percent of Pell funding is subject to annual appropriations, the program is implemented so that all eligible students who apply can receive a Pell Grant based on the maximum award that the President and Congress set.[45] Thus, Pell operates like entitlement programs such as SNAP (formerly known as food stamps) or Medicare, in which all eligible applicants who apply receive the benefit or service.
Due to its mix of funding from appropriations and authorizing laws, Pell periodically builds up significant carry-over funding from year to year when costs come in lower than expected and can face significant shortfalls when costs come in higher. This pattern held during and after the Great Recession. When, during the sharp economic turndown, large Pell funding shortfalls emerged, President Obama and Congress increased funding and also restricted eligibility to lower costs. When the economy rebounded, funding grew faster than costs and significant carry-over balances emerged.
Pell Costs Are Driven by Enrollment
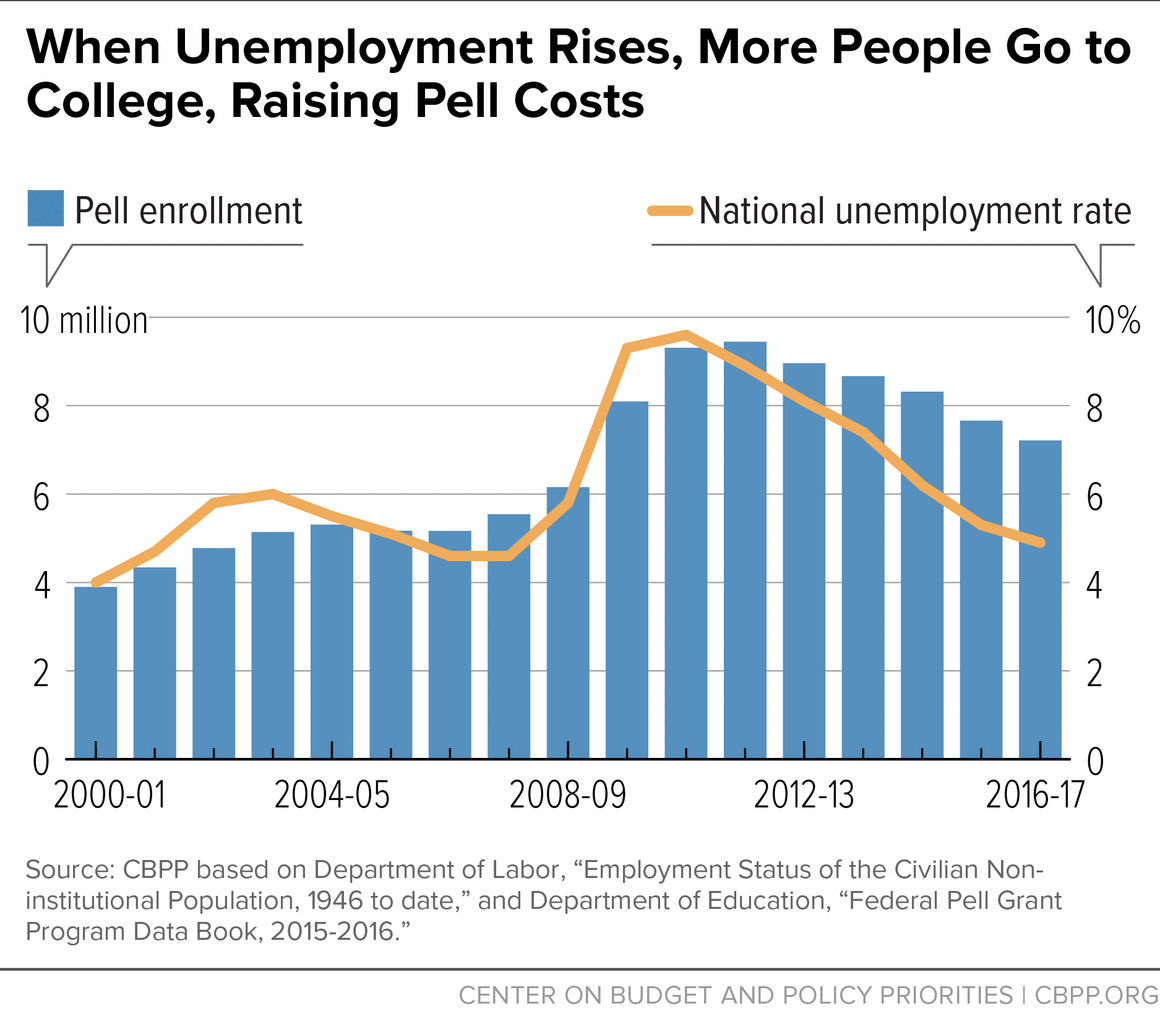
Enrollment is the largest factor driving Pell costs. As more Americans go to college, Pell spending rises. Indeed, college enrollment and Pell spending trends have always been closely aligned.[46] Pell Grants help raise the skill level and productivity of both individual students and the economy as a whole.
During the last recession, enrollment rose substantially as labor market conditions deteriorated — i.e., more people went to college due to a scarcity of jobs — and fell when the labor market rebounded.[47] In general, Pell’s availability during recessions is important because it lets a larger group of students attend school and upgrade their skills when jobs are scarce. That not only helps the individual worker, but also raises the overall skill level of the labor force, which benefits the economy overall. During the Great Recession, however, some low-quality for-profit colleges expanded rapidly, provided poor returns for students, and folded shortly after the recession ended.
Because Pell costs are so largely dependent on economic conditions, which are hard to predict, policymakers are hard-pressed to set funding levels accurately from year to year. During the Great Recession and prolonged high unemployment that it created, Pell enrollment rose by 50 percent from 2007-08 to 2009-10, fueling a large projected funding shortfall. Facing, in 2011, a $20 billion shortfall over two years,[48] the President and Congress made significant changes to restrict eligibility — eliminating year-round Pell (which allowed students to get additional Pell funding to take classes in a third semester during the year, typically the summer, to accelerate completion), which was enacted in 2008, and reducing lifetime eligibility from 18 to 12 semesters, among others. Overall, policymakers reduced Pell costs by more than $50 billion over ten years.[49]
To see how, over the last 20 years, Pell enrollment rose with rising unemployment and fell when labor markets rebounded, see Figure 3 below.
Current Pell Funding Outlook
As expected, the improving economy has driven steady enrollment declines. As recently as 2014, the Congressional Budget Office (CBO) projected a $2.3 billion Pell shortfall in fiscal year 2017. By 2017, however, CBO reported that “spending for Pell Grants dipped by $2 billion in 2016, primarily because of a drop in the number of students receiving such grants,” [50] and projected an $8.6 billion surplus for 2017 — even though Congress cut carry-over funding by $1.3 billion and restored “year-round” Pell in the fiscal year 2017 appropriations legislation.[51]
Pell’s financing outlook is positive. The improving economy, declining enrollments, and the program cuts made after the Great Recession have all reduced Pell costs significantly from their peak of 2011. Pell is projected to remain adequately funded through 2026 even if the President and Congress keep discretionary funding at its current level (assuming Congress does not continue to rescind carry-over funds) each year until then.[52] At that point, policymakers would need to begin increasing discretionary funding to avoid a funding shortfall and cuts in Pell Grants. (Note that the need for increased discretionary funding will come sooner if Congress continues to rescind carry-over Pell funding that is needed to meet Pell costs in coming years.)
Of note, discretionary Pell funding has been essentially frozen (in nominal terms) since 2011. By 2026, the inflation-adjusted value of discretionary Pell funding would have fallen by more than a quarter over the previous 15 years. (And those figures assume that policymakers do not continue to rescind Pell funding. If they do, they will need to boost discretionary appropriations by an earlier date to cover program costs.[53])
If Inflation Adjustment Ends, Affordability Gap Will Grow
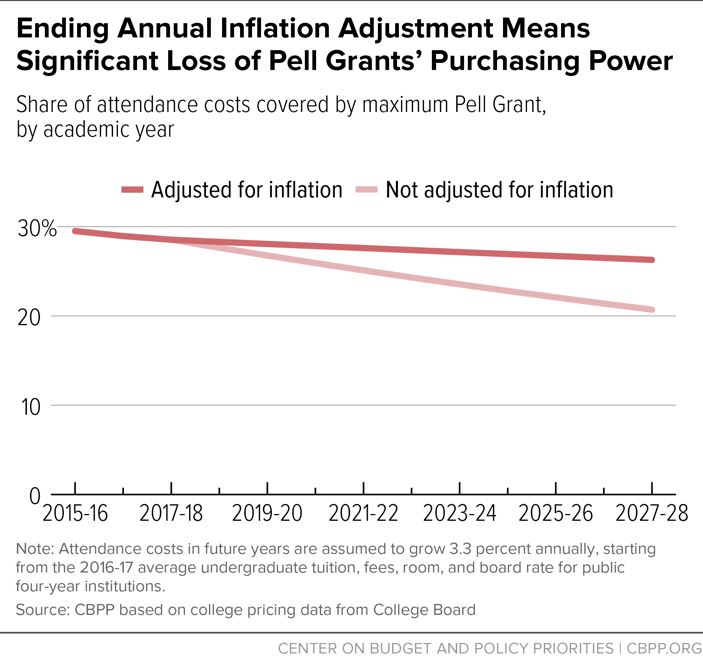
As noted, the annual inflation adjustment in Pell’s mandatory funding piece is scheduled to end after the 2017-18 academic year. During the five years of inflation indexing, from academic years 2013-14 to 2017-18, Pell’s purchasing power as compared to the cost of attending college fell by less than 3 percentage points — reflecting the fact that college costs rose faster than inflation, due in turn largely to state funding cuts. Without inflation indexing, the loss of purchasing power would have been much larger.
Pell will lose significant purchasing power if indexing ends. Using very conservative assumptions for college cost increases (an average of 3.3 percent a year[54]), Pell’s purchasing power will drop from 29 percent in 2017-18 to a projected 21 percent in 2027-28. If, however, the President and Congress extend indexing, Pell’s purchasing power will fall much less — to a projected 26 percent. (See Figure 4.)
The Right — And Wrong — Way Forward
The Right Way
For more than 40 years, Pell has helped millions of Americans go to college, and it remains the largest single federal investment to expand college opportunity and provide a pathway to the middle class. Nevertheless, its purchasing power as a share of college costs has steadily deteriorated and has now reached its lowest point in more than four decades. Now that Pell’s financing has stabilized since the Great Recession, policymakers should strengthen the program so that more students can earn a degree or certificate and take out less in loans.
The President and Congress took an important first step in the fiscal 2017 omnibus appropriations bill by restoring year-round Pell eligibility, allowing more students to attend school in the summer and graduate more quickly.
Policymakers could take the following steps to improve Pell’s effectiveness even more:
- Continue indexing: Policymakers should extend the Pell provision that indexes its grants to the overall inflation rate, rather than allowing it to end after the 2017-2018 academic year, which will help prevent or at least mitigate any further erosion in Pell’s purchasing power as compared to the cost of college attendance.
- Raise the maximum Pell award: Indexing alone won’t fully address the large loss in Pell’s purchasing power. As noted, Pell todays covers only 29 percent of the basic cost of attending a public college (tuition, fees, room, and board). For Pell to cover half of that cost — as it did in the 1987-88 academic year — the maximum grant would have to rise by about $4,500. While, politically speaking, that may not be immediately attainable, research suggests that even more modest increases would have a positive impact on attendance and completion among low-income students. Even replicating the roughly $1,000 maximum Pell increase that President Obama and Congress enacted for 2008 to 2014 (from $4,731 to $5,730 in nominal terms) would, research suggests, significantly help improve attendance and completion.[55]
- Innovate to support completion: Policymakers should look for ways to promote college completion for Pell students by incentivizing both students and institutions to improve their performance and states to invest in higher education. The graduation gap between lower-income students and their more well-to-do peers is well-documented.[56] President Obama proposed a College Opportunity and Graduation Bonus to reward colleges with a strong record of not only enrolling but also graduating Pell students, as well as an additional $300 On-Track Pell Bonus award for full-time students who take at least 15 credits each semester (the number typically needed to graduate a four-year college in four years). At a minimum, policymakers should support rigorous demonstration projects to test how financial incentives as well as other supports and services can best promote completion.
Finally, the President and Congress should consider converting Pell to an entitlement, under which its funding would be guaranteed — providing the necessary additional funding when, for instance, more people want to attend college when jobs are scarce. While there are political challenges to making this shift, it would provide a more stable fiscal outlook for the program.
The Wrong Way
The Trump Administration has proposed to cut carry-over balances by $4 billion in fiscal year 2018 — while the House Appropriations Committee would cut these balances by $3.3 billion on top of the $1.3 billion cut in 2017 — and neither would use any of those balances to increase the maximum award or improve Pell’s effectiveness.
At the same time, House Republican budgets of recent years[57] — and the House Budget Committee’s 2018 budget resolution — have proposed to eliminate mandatory funding for the program entirely. Because $1,060 of the $5,920 maximum Pell award in the 2017-2018 academic year is financed with mandatory funding, ending it would mean an immediate, sharp cut in the maximum award to $4,860. Cutting the maximum to this extent and failing to index Pell after 2017-2018 would slash Pell’s purchasing power, as compared to the average COA, to an estimated 23 percent in the 2018-2019 academic year and an estimated 17 percent by 2027-2028. Because eligibility for Pell depends in part on the maximum Pell Grant, this sharp cut would mean that hundreds of thousands of students would lose Pell eligibility entirely while millions more would see their grant significantly reduced.
In total, eliminating all of Pell’s mandatory funding — both the mandatory funding that supports $1,060 of the current grant and the additional mandatory funding that policymakers have provided to supplement discretionary funding — would mean more than $75 billion cut over ten years and a new funding shortfall in 2019, requiring either a funding increase or more cuts to eligibility and benefit on top of the $1,060 cut that would occur immediately.[58]
| APPENDIX A | ||
|---|---|---|
| Pell Recipients and Expenditures in the U.S. States and Territories By state of institution, academic year 2015-16 |
||
| Recipients | Expenditures | |
| Alabama | 135,000 | $511,517,000 |
| Alaska | 11,000 | 37,259,000 |
| Arizona | 311,000 | 1,145,032,000 |
| Arkansas | 69,000 | 270,978,000 |
| California | 985,000 | 3,778,572,000 |
| Colorado | 120,000 | 418,151,000 |
| Connecticut | 76,000 | 264,295,000 |
| Delaware | 17,000 | 62,164,000 |
| District of Columbia | 38,000 | 136,278,000 |
| Florida | 517,000 | 1,891,171,000 |
| Georgia | 249,000 | 876,753,000 |
| Hawaii | 20,000 | 76,316,000 |
| Idaho | 45,000 | 170,498,000 |
| Illinois | 299,000 | 1,091,522,000 |
| Indiana | 190,000 | 686,649,000 |
| Iowa | 97,000 | 343,927,000 |
| Kansas | 63,000 | 234,598,000 |
| Kentucky | 99,000 | 372,576,000 |
| Louisiana | 102,000 | 395,155,000 |
| Maine | 26,000 | 97,949,000 |
| Maryland | 110,000 | 379,336,000 |
| Massachusetts | 128,000 | 475,788,000 |
| Michigan | 224,000 | 790,120,000 |
| Minnesota | 133,000 | 450,719,000 |
| Mississippi | 81,000 | 335,524,000 |
| Missouri | 145,000 | 520,502,000 |
| Montana | 17,000 | 65,345,000 |
| Nebraska | 37,000 | 130,536,000 |
| Nevada | 40,000 | 138,012,000 |
| New Hampshire | 51,000 | 135,345,000 |
| New Jersey | 164,000 | 635,864,000 |
| New Mexico | 50,000 | 179,599,000 |
| New York | 472,000 | 1,936,749,000 |
| North Carolina | 220,000 | 831,340,000 |
| North Dakota | 11,000 | 41,326,000 |
| Ohio | 221,000 | 800,757,000 |
| Oklahoma | 84,000 | 313,531,000 |
| Oregon | 89,000 | 320,237,000 |
| Pennsylvania | 239,000 | 888,621,000 |
| Puerto Rico | 207,000 | 893,304,000 |
| Rhode Island | 29,000 | 106,839,000 |
| South Carolina | 100,000 | 376,061,000 |
| South Dakota | 22,000 | 75,037,000 |
| Tennessee | 140,000 | 536,347,000 |
| Texas | 575,000 | 2,144,055,000 |
| Utah | 112,000 | 413,402,000 |
| Vermont | 11,000 | 39,199,000 |
| Virginia | 184,000 | 674,909,000 |
| Washington | 113,000 | 417,904,000 |
| West Virginia | 57,000 | 207,005,000 |
| Wisconsin | 104,000 | 371,423,000 |
| Wyoming | 8,000 | 27,890,000 |
| American Samoa | 1,000 | 4,378,000 |
| Micronesia | 2,000 | 9,716,000 |
| Guam | 4,000 | 14,729,000 |
| Marshall Islands | 1,000 | 4,613,000 |
| Northern Mariana Islands | 1,000 | 3,933,000 |
| Palau | 1,000 | 2,218,000 |
| Virgin Islands | 1,000 | 5,351,000 |
| Total | 7,660,000 | $28,558,924,000 |
End Notes
[1] Spiros Protopsaltis is Visiting Associate Professor and Fellow, College of Education and Human Development, George Mason University and served as the Deputy Assistant Secretary for Higher Education and Student Financial Aid at the U.S. Department of Education from 2015 to 2017.
[2] Department of Education. (2017). “FY 2018 Budget Request: Student Financial Assistance.” Available at https://www2.ed.gov/about/overview/budget/budget18/justifications/o-sfa.pdf
[3] Department of Education. (2016). “New U.S. Department of Education Report Highlights Colleges Increasing Access and Supporting Strong Outcomes for Low-Income Students.” Available at https://www.ed.gov/news/press-releases/new-us-department-education-report-highlights-colleges-increasing-access-and-supporting-strong-outcomes-low-income-students.
[4] The formula also allows for certain applicants to be automatically determined to be eligible for the maximum Pell. For the 2016-17 year, dependent students whose parents’ adjusted gross income was below $25,000 and independent students (and their spouses, if applicable) with dependents with AGI below $25,000, qualify for the maximum Pell award regardless of other financial characteristics.
[5] National Center for Education Statistics. (2015). “Total undergraduate fall enrollment in degree-granting postsecondary institutions, by attendance status, sex of student, and control and level of institution: Selected years, 1970 through 2025.” Available at https://nces.ed.gov/programs/digest/d15/tables/dt15_303.70.asp?current=yes.
[6] Department of Education. (2017). “Federal Pell Grant Program Data Book, 2015-2016,” Table 10A, calculations by the authors. Available at https://www2.ed.gov/finaid/prof/resources/data/pell-data.html.
[7] Ibid., Table 57A, calculations by the authors.
[8] An independent student meets one or more of the following criteria: at least 24 years old, married, a veteran, a member of the armed forces, an orphan, a ward of the court, someone with legal dependents other than a spouse, an emancipated minor or someone who is homeless or at risk of becoming homeless. Graduate students, who are ineligible for Pell, are also deemed independent students for financial aid purposes, regardless of their age.
[9] Department of Education. (2017). “Federal Pell Grant Program Data Book, 2015-2016,” Tables 11A, 13, and 92, calculations by the authors. Available at https://www2.ed.gov/finaid/prof/resources/data/pell-data.html.
[10] Anthony P. Carnevale. (2015). “Learning While Earning: The New Normal,” Georgetown University Center on Education and the Workforce. Available at https://cew.georgetown.edu/wp-content/uploads/Working-Learners-Report.pdf; Paul Attewell, Scott Heil, and Liza Reisel. (2012). “What is Academic Momentum? And does it Matter?” Educational Evaluation and Policy Analysis, Vol. 34(1); Alexander McCormick, John Moore III, and George Kuh. (2010). “Working during College: Its Relationships to Student Engagement and Education Outcomes,” in Laura Perna (Ed.). “Understanding the Working College student: New Research and Its Implications for Policy and Practice”; Clifford Adelman. (2006). “The Toolbox Revisited: Paths to Degree Completion from High School through College.” U.S. Department of Education. Available at http://www2.ed.gov/rschstat/research/pubs/toolboxrevisit/toolbox.pdf; Lauren Dundes and Jeff Marx. (2006). “Balancing Work and Academics in College: Why do students working 10 to 19 hours per week excel?” Journal of College Student Retention: Research, Theory and Practice, Vol. 8(1); Jacqueline King. (2002). “Crucial Choices: How Students’ Financial Decisions Affect Their Academic Success.” American Council on Education.
[11] National Center of Education Statistics. “2012 National Postsecondary Student Aid Study: Data Lab,” calculations by the authors. Available at https://nces.ed.gov/datalab/.
[12] See, for example: Sara Goldrick-Rab, Robert Kelchen, Douglas Harris, and James Benson. (2015). “Reducing Income Inequality in Educational Attainment: Experimental Evidence on the Impact of Financial Aid on College Completion.” University of Wisconsin-Madison, IRP Discussion Paper No. 1393-12; Ben Castleman and Bridget Terry Long. (2015). “Looking Beyond Enrollment: The Causal Effect of Need-Based Grants on College Access, Persistence, and Graduation.” National Bureau of Economic Research Working Paper No. 19306; Eric Bettinger. (2015). “Need-Based Aid and Student Outcomes: The Effects of the Ohio College Opportunity Grant.” Educational Evaluation and Policy Analysis, Vol. 37(1); Cody Davidson. (2014). “The Effects of a State Need-based Access Grant on Traditional and Non-traditional Student Persistence.” Higher Education Policy, Vol. 28(2);
Susan Dynarski Judith Scott-Clayton. (2013). “Financial Aid Policy: Lessons from Research.” National Bureau of Economic Research Working Paper No. 18710; Donald Heller. (2012). “Testimony before the Committee on Health, Education, Labor, and Pensions United States Senate. Making College Affordability a Priority: Promising Practices and Strategies”; Sandy Baum, Michael McPherson, and Patricia Steele (Eds.). (2008). “The Effectiveness of Student Aid Policies: What the Research Tells Us.” College Board; Bridget Terry-Long. (2008). “What Is Known About the Impact of Financial Aid? Implications for Policy.” National Center for Postsecondary Education Working Paper; Don Hossler, Mary Ziskin, Jacob Gross, Sooyeon Kim, and Osman Cekic. (2007). “Student Aid and Its Role in Encouraging Persistence.” In J.C. Smart, (Ed.), Higher Education: Handbook of Theory and Research, Vol. 24; Donald Heller. (2003). “Informing Public Policy: Financial Aid and Student Persistence.” Western Interstate Commission for Higher Education; Larry Singell. (2001). “Come and Stay a While: Does Financial Aid Effect Enrollment and Retention at a Large Public University?” Cornell Higher Education Research Institute; Susan Dynarski. (1999). “Does Aid Matter? Measuring the Effect of Student Aid on College Attendance and Completion.” National Bureau of Economic Research Working Paper No. 7422; Laura Walter Perna. (1998). “The Contribution of Financial Aid to Undergraduate Persistence.” Journal of Student Financial Aid, Vol. 28(3).
[13] Lindsay Page and Judith Scott-Clayton. (2016). “Improving college access in the United States: Barriers and policy responses,” Economics of Education Review, Vol. 51; Ben Castleman and Bridget Terry Long. (2015). “Looking Beyond Enrollment: The Causal Effect of Need-Based Grants on College Access, Persistence, and Graduation.” National Bureau of Economic Research Working Paper No. 19306; Will Doyle. (2014). “College Affordability: What the Research Says.” Southern Regional Education Board. Available at http://www.sreb.org/sites/main/files/file-attachments/affordability_doyle_dec2014.pdf; Jeffrey Denning. (2014). “College on the Cheap: Costs and Benefits of Community College.” University of Texas at Austin, Job Market Paper. Available at http://www.terry.uga.edu/media/events/documents/Denning_Paper.pdf; Ray Franke. (2014). “Towards the Education Nation? Revisiting the Impact of Financial Aid, College Experience, and Institutional Context on Baccalaureate Degree Attainment for Low-Income Students.” Prepared for Presentation at the Annual Meeting of the American Educational Research Association (AERA), Philadelphia, PA, (April 3-7). [Cited with author’s permission]; David Deming and Susan Dynarski. (2009). “Into College, Out of Poverty? Policies to Increase the Postsecondary Attainment of the Poor.” National Bureau of Economic Research, Working Paper No. 15387; Thomas Kane (2004). “Evaluating the Impact of the D.C. Tuition Assistance Grant Program.” National Bureau of Economic Research, Working Paper 10658; Susan Dynarski. (2003). “Does Aid Matter? Measuring the Effect of Student Aid on College Attendance and Completion.” American Economic Review Vol. 93(1); Thomas Kane. (2003). “A Quasi-Experimental Estimate of the Impact of Financial Aid on College-Going.” National Bureau of Economic Research, Working Paper 9703; Susan Dynarski. (2000). “Hope for Whom? Financial Aid for the Middle Class and Its Impact on College Attendance.” National Tax Journal, Vol. 53(3); Thomas Kane. (1995). “Rising Public College Tuition and College Entry: How Well Do Public Subsidies Promote Access to College?” National Bureau of Economic Research, Working Paper 5164.
[14] Sara Goldrick-Rab, Robert Kelchen, Douglas Harris, and James Benson. (2015). “Reducing Income Inequality in Educational Attainment: Experimental Evidence on the Impact of Financial Aid on College Completion.” University of Wisconsin-Madison, IRP Discussion Paper No. 1393-12.
[15] Ben Castleman and Bridget Terry Long. (2015). “Looking Beyond Enrollment: The Causal Effect of Need-Based Grants on College Access, Persistence, and Graduation.” National Bureau of Economic Research Working Paper No. 19306; Sara Goldrick-Rab, Robert Kelchen, Douglas Harris, and James Benson. (2015). “Reducing Income Inequality in Educational Attainment: Experimental Evidence on the Impact of Financial Aid on College Completion.” University of Wisconsin-Madison, IRP Discussion Paper No. 1393-12.
[16] David Mundel with Lois Rice. (2008). “The Impact of Increases in Pell Grant Awards on College-going among Lower Income Youth: Evidence from a Natural Experiment.” Brookings Institution, Center on Children and Families Brief #40. Available at https://www.brookings.edu/wp-content/uploads/2016/06/12_pell_grants_rice.pdf.
[17] Ibid, p. 2.
[18] Neil Seftor and Sarah Turner. (2002). “Back to School: Federal Student Aid Policy and Adult College Enrollment.” The Journal of Human Resources, Vol. 37(2).
[19] Sigal Alon. (2011). “Who Benefits Most from Financial Aid? The Heterogeneous Effect of Need-Based Grants on Students' College Persistence.” Social Science Quarterly, Vol. 92(3).
[20] Jennie Woo. (2009). “The Impact of Pell Grants on Academic Outcomes for Low-Income California Community College Students.” MPR Associates: p. 3. Available at http://files.eric.ed.gov/fulltext/ED537848.pdf.
[21] Eric Bettinger. (2004). “How Financial Aid Affects Persistence.” National Bureau of Economic Research, Working Paper No. 10242: p. 31. Available at http://www.nber.org/papers/w10242.pdf.
[22] Rina Seung Eun Park and Judith Scott-Clayton. (2017). “The Impact of Pell Grant Eligibility on Community College Students’ Financial Aid Packages, Labor Supply, and Academic Outcomes.” Center for Analysis of Postsecondary Education and Employment: Abstract. Available at http://ccrc.tc.columbia.edu/media/k2/attachments/impact-pell-grant-eligibility-community-college-students.pdf.
[23] Ibid., p. 2.
[24] Ray Franke. (2014). “Towards the Education Nation? Revisiting the Impact of Financial Aid, College Experience, and Institutional Context on Baccalaureate Degree Attainment for Low-Income Students.” Prepared for Presentation at the Annual Meeting of the American Educational Research Association (AERA), Philadelphia, PA, (April 3-7). [Cited with author’s permission].
[25] Ibid., p. 32.
[26] Jeffrey Denning. (2016). “Born Under a Lucky Star: Financial Aid, College Completion, Labor Supply, and Credit Constraints.” Upjohn Institute Working Paper 17-267. Available at http://research.upjohn.org/cgi/viewcontent.cgi?article=1285&context=up_workingpapers.
[27] William Bennett. (1987). “Our Greedy Colleges.” New York Times. Available at http://www.nytimes.com/1987/02/18/opinion/our-greedy-colleges.html.
[28] See, for example: Andrew Kreighbaum. (2017). “The Conservative Approach to Student Loans.” Inside Higher Education. Available at https://www.insidehighered.com/news/2017/02/22/consensus-forms-loan-policies-among-conservative-thinkers; Theodore Bromund. (2016). “Blame Washington for Skyrocketed College Costs.” Heritage Foundation; Lindsay Burke. (2016). “Pertinent Issues Surrounding Reauthorization of the Higher Education Act.” Testimony before Committee on Education and the Workforce, United States House of Representatives, March 2, 2016. Available at http://www1.heritage.org/research/testimony/pertinent-issues-surrounding-reauthorization-of-the-higher-education-act; Neal McCluskey. (2015). “Yet More Empirical Evidence That Yes, Federal Student Aid Fuels College Price Inflation.” Cato Institute. Available at https://www.cato.org/blog/yet-more-empirical-evidence-yes-federal-student-aid-fuels-college-price-inflation; Joseph Lawler (2015). “Republicans Turn a Skeptical Eye on Effects of Federal College Aid.” Washington Examiner. Available at http://www.washingtonexaminer.com/republicans-turn-a-skeptical-eye-on-effects-of-federal-college-aid/article/2573358; Andrew Kelly. (2014). “Paul Ryan and the Emerging Conservative Reform Agenda in Higher Education.” Forbes. Available at https://www.forbes.com/sites/akelly/2014/07/30/paul-ryan-and-the-emerging-conservative-reform-agenda-in-higher-education/#6f46c14f7669; Andrew Gillen. (2012). “Introducing Bennett Hypothesis 2.0.” Center for College Affordability and Productivity. Available at http://files.eric.ed.gov/fulltext/ED536151.pdf; John Healy. (2012). “Republicans applying 'supply side' theory to benefits.” Los Angeles Times. Available at http://articles.latimes.com/2012/apr/30/news/la-ol-supply-side-new-meaning-house-republicans-20120427#; Neal McCluskey. (2008). “Higher Education Policy.” In David Boaz. (Ed.). “Cato Handbook for Policymakers.” 7th Edition, Cato Institute. Available at https://object.cato.org/sites/cato.org/files/serials/files/cato-handbook-policymakers/2009/9/hb111-21.pdf.
[29] Adam Stoll, David Bradley and Shannon Mahan. (2014). “Overview of the Relationship between Federal Student Aid and Increases in College Prices.” Congressional Research Service, R43692: pp. 32-33.
[30] Donald Heller. (2013). “Does Federal Financial Aid Drive Up College Prices?” American Council on Education: p. 18. Available at http://www.acenet.edu/news-room/Documents/Heller-Monograph.pdf.
[31] Robert B. Archibald and David H. Feldman. (2016). “Federal Financial Aid Policy and College Behavior.” American Council on Education; Bridget Terry Long. (2006). “College Tuition Pricing and Federal Financial Aid: Is there a Connection?” Testimony before the U.S. Senate Committee on Finance. Available at https://www.finance.senate.gov/imo/media/doc/120506bltest.pdf; Caroline Hoxby (Ed.). (2004). “College Choices: The Economics of Where to Go, When to Go, and How to Pay For It.” National Bureau of Economic Research: p. 6. Available at http://www.nber.org/chapters/c10096.pdf; Alisa Cunningham, Jane Wellman, Melissa Clinedinst, Jamie Merisotis, and Dennis Carroll (2001). “Study of College Costs and Prices, 1988–89 to 1997–98: Volume 1.” National Center for Education Statistics, NCES 2002–157: p. x. Available at https://nces.ed.gov/pubs2002/2002157.pdf; James Harvey, Roger Williams, Rita Kirshstein, Amy Smith O'Malley, and Jane V. Wellman. (1998). “Straight Talk About College Costs and Prices: Report of The National Commission on the Cost of Higher Education.” American Council on Education and The Oryx Press: p. 1.
[32] Stephanie Riegg Cellini. (2017). February 21, 2017, Letter to The Honorable Bobby Scott, Ranking Member, House Committee on Education and the Workforce, U.S. House of Representatives. Available at http://ticas.org/sites/default/files/u159/cellini_letter_housecommitteeonedworkforce_2-21-2017.pdf.
[33] Congressional Budget Office. (2013). “The Federal Pell Grant Program: Recent Growth and Policy Options.” Available at https://www.cbo.gov/publication/44448.
[34] Calculations by the authors, using data provided in: College Board. (2016). “Trends in College Pricing 2016: Figures and Tables.” Available at https://trends.collegeboard.org/sites/default/files/2016-trends-college-pricing-source-data_0.xlsx. Maximum Pell Grants’ purchasing power has decreased from covering 100 percent of public four-year tuition and fees in 2001-02 to 60 percent in 2016-17, and from 42 percent of public four-year tuition, fees, room and board in 2001-02 to 29 percent in 2016-17. According to the College Board, “Until 1985, individual Pell Grants were capped at 50% of the student’s cost of attendance. The cap was raised to 60% of the cost of attendance in 1985-86 and removed entirely in 1993.” (2016). “Trends in Student Aid 2016: Figures and Tables,” Table 8. Available at https://trends.collegeboard.org/sites/default/files/2016-trends-student-aid-source-data_0.xls.
[35] David H. Feldman. (2012). “Myths and Realities about Rising College Tuition.” National Association of Student Financial Aid Administrators. Available at http://www.nasfaa.org/news-item/4565/Myths_and_Realities_about_%20Rising_College_Tuition; Mark Kantrowitz. (2017). “Tuition Inflation.” Available at http://www.finaid.org/savings/tuition-inflation.phtml; College Board. (2017). “Tuition and Fees and Room and Board over Time.” Available at https://trends.collegeboard.org/college-pricing/figures-tables/tuition-fees-room-and-board-over-time.
[36] Huffington Post. (2012). “Cost Of College Degree In U.S. Has Increased 1,120 Percent In 30 Years, Report Says.” Available at http://www.huffingtonpost.com/2012/08/15/cost-of-college-degree-increase-12-fold-1120-percent-bloomberg_n_1783700.html.
[37] Bureau of Labor Statistics. (2016). “College tuition and fees increase 63 percent since January 2006.” Available at https://www.bls.gov/opub/ted/2016/college-tuition-and-fees-increase-63-percent-since-january-2006.htm.
[38] Department of Education. (2016). “Federal Pell Grant Program 2014-2015 End of Year Research Tables,” Table 18, calculations by the authors. Available at https://www2.ed.gov/finaid/prof/resources/data/pell-data.html.
[39] John Quinterno and Viany Orozco. (2012). “The Great Cost Shift: How Higher Education Cuts Undermine the Future Middle Class.” Demos. Available at http://www.demos.org/publication/great-cost-shift-how-higher-education-cuts-undermine-future-middle-class.
[40] State Higher Education Executive Officers. (2017). “State Higher Education Finance: FY 2016.” Available at http://sheeo.org/sites/default/files/SHEEO_SHEF_2016_Report.pdf.
[41] CBPP analysis of data from State Higher Education Executive Officers Association “State Higher Education Finance: FY2016,” April 2017, http://www.sheeo.org/projects/shef-fy16
[42] Ibid. See also: Michael Mitchell, Michael Leachman, and Kathleen Masterson. (2016). “Funding Down, Tuition Up: State Cuts to Higher Education Threaten Quality and Affordability at Public Colleges.” Center on Budget and Policy Priorities. Available at https://www.cbpp.org/research/state-budget-and-tax/funding-down-tuition-up; Michael Mitchell. (2015). “State Higher Ed Cuts Largely Driving Recent Tuition Hikes.” Center on Budget and Policy Priorities. Available at https://www.cbpp.org/blog/state-higher-ed-cuts-largely-driving-recent-tuition-hikes.
[43] Department of Education, “Federal Pell Grant Program 2015-2016 End of Year Research Tables,” Table 1. Available at https://www2.ed.gov/finaid/prof/resources/data/pell-data.html & U.S. Department of Education, “Federal Student Aid.” Available at https://teststudentaid.ed.gov/testise/about/announcements/pell-2016-17
[44] The Institute for College Access and Success. (2014). “Quick Facts About Student Debt” Available at http://ticas.org/sites/default/files/pub_files/Debt_Facts_and_Sources.pdf.
[45] The last award reduction was made in 1990, see: Department of Education. (2016). “Federal Pell Grant Program 2014-2015 End of Year Research Tables,” Table 1. Available at https://www2.ed.gov/finaid/prof/resources/data/pell-data.html.
[46] Calculations by the authors, using data provided in: Department of Education. (2017). “Federal Pell Grant Program Data Book, 2015-2016,” Table 1. Available at https://www2.ed.gov/finaid/prof/resources/data/pell-data.html; Department of Education. (2017). “FY 2018 Budget Request: Student Financial Assistance.” Available at https://www2.ed.gov/about/overview/budget/budget18/justifications/o-sfa.pdf; College Board. (2016). “Trends in Student Aid 2016: Figures and Tables.” Available at https://trends.collegeboard.org/sites/default/files/2016-trends-student-aid-source-data_0.xls.
[47] See, for example: Jeffrey Brown and Caroline Hoxby (2015). “How the Financial Crisis and Great Recession Affected Higher Education.” National Bureau of Economic Research. Available at http://papers.nber.org/books/brow12-1; Andrew Barr and Sarah Turner. (2013). “Expanding Enrollments and Contracting State Budgets The Effect of the Great Recession on Higher Education,” The Annals of the American Academy of Political and Social Science Vol. 650(1); Nicholas Hillman and Erica Lee Orians. (2013). “Community Colleges and Labor Market Conditions: How Does Enrollment Demand Change Relative to Local Unemployment Rates?” Research in Higher Education, Vol. 54(7); National Student Research Clearinghouse. (2011). “National Postsecondary Enrollment Trends: Before, During, and After the Great Recession.” Available at https://nscresearchcenter.org/signaturereport1/; Harris Dellas and Plutarchos Sakellaris. (2002). “On the Cyclicality of Schooling: Theory and Evidence,” Oxford Economic Papers Vol. 55(1).
[48] Derek Quizon. (2011). “End of Year-Round Pell Grants Could Lead Many Nontraditional Students to Drop Out.” Chronicle of Higher Education. Available at http://www.chronicle.com/article/End-of-Year-Round-Pell-Grants/127153.
[49] David Reich and Brandon DeBot. (2015). “House Budget Committee Plan Cuts Pell Grants Deeply, Reducing Access to Higher Education.” Center on Budget and Policy Priorities.
[50] Congressional Budget Office. (2017). “The Budget and Economic Outlook: 2017 to 2027,” p. 12. Available at
https://www.cbo.gov/sites/default/files/115th-congress-2017-2018/reports/52370-budeconoutlook.pdf.
[51] Congressional Budget Office. (2017). “Pell Grant Program, Discretionary: Cumulative Shortfall/Surplus – CBO’s June 2017 Baseline.” Available at https://www.cbo.gov/sites/default/files/recurringdata/51304-2017-06-pellgrant.pdf.
[52] CBPP calculations based on the June 2017 CBO baseline projections for Pell.
[53] If Congress were to continue to rescind an additional $1.3 billion per year, then it would need to increase discretionary appropriations in 2023. And, if Congress rescinds larger balances, as the House Appropriations Committee bill would do, additional discretionary resources will be needed sooner. And, if Congress rescinds larger balances, as the House Appropriations Committee bill would do, additional discretionary resources will be needed sooner.
[54] Annual growth rate in the average costs of tuition, fees, room, and board at public four-year colleges has averaged 5.3 percent over the last 20 academic years, ranging from 2.7 percent to 8.9 percent. For historical data on the increase in college costs, see: College Board. (2016). “Trends in College Pricing 2016: Figures and Tables,” Table 2. Available at https://trends.collegeboard.org/sites/default/files/2016-trends-college-pricing-source-data_0.xlsx.
[55] While some of this increase stemmed from indexing which began in 2013, most of this increase came from two pieces of legislation that raised the maximum grant before indexation began.
[56] See, for example: The Pell Institute for the Study of Opportunity in Higher Education and the University of Pennsylvania Alliance for Higher Education and Democracy. (2016). “Indicators of Higher Education Equity in the United States: 2016 Historical Trend Report.” Available at http://www.pellinstitute.org/downloads/publications-Indicators_of_Higher_Education_Equity_in_the_US_2016_Historical_Trend_Report.pdf; Andrew Nichols. (2015). “The Pell Partnership: Ensuring a Shared Responsibility for Low-Income Student Success.” The Education Trust. Available at https://edtrust.org/wp-content/uploads/2014/09/ThePellPartnership_EdTrust_20152.pdf.
[57] House Education and Workforce Committee. (2017). “Budget Views and Estimates for Fiscal Year 2018.” Available at https://edworkforce.house.gov/uploadedfiles/budget_views_and_estimates_for_fiscal_year_2018_-_final.pdf; House Budget Committee. (2016). “A Balanced Budget for a Stronger America: Fiscal Year 2017 Budget Resolution.” Available at http://budget.house.gov/uploadedfiles/fy2017_a_balanced_budget_for_a_stronger_america.pdf.
[58] CBPP calculations based on the June 2017 CBO baseline projections for Pell; Lindsay Ahlman. (2017). “What the House Republican proposal to cut $77 billion in mandatory Pell Grant funding means for students.” The Institute for College Access and Success. Available at http://ticas.org/blog/what-house-republican-proposal-cut-77-billion-mandatory-pell-grant-funding-means-students.
More from the Authors

Spiros Protopsaltis is Visiting Associate Professor and Fellow, College of Education and Human Development, George Mason University and served as the Deputy Assistant Secretary for Higher Education and Student Financial Aid at the U.S. Department of Education from 2015 to 2017.